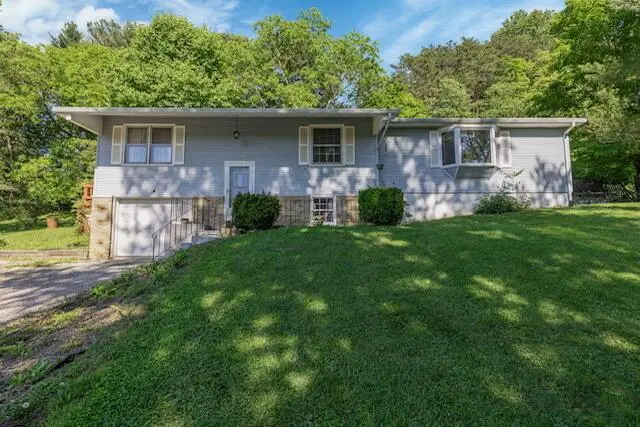
13388 Eagle Dr · Rockbridge, OH
Flood risk 1/10 · Minimal
- FEMA flood zone
- X (unshaded)
- Chance of flooding over 30 yrs
- 0.0%
- Est. flood insurance / yr
- $507 – $1,088
Fire risk 4/10 · Minor
- Est. fire insurance / yr
- $713 – $1,323
Heat risk 3/10 · Minor
- Hot days now (above 99°F)
- 7 days/yr
- Hot days in 30 yrs
- 18 days/yr
Wind risk 2/10 · Minimal
- Chance of severe wind over 30 yrs
- 1.0%
Air-quality risk 2/10 · Minimal
- Unhealthy air days now
- 1 days/yr
- Unhealthy air days in 30 yrs
- 2 days/yr
Risk factors via First Street. Map © Google.
Why this score? — see what drove the C- grade
The composite is a weighted blend of 9 inputs, each scored 0–100. Each bar is that input's sub-score; the figure is the points it added to the 100-point composite (weight × sub-score).
- Cash flow +16.2/30.0
- ARV discount +7.5/15.0
- Appreciation +7.5/10.0
- DSCR +5.0/10.0
- Schools +4.7/10.0
- 1% rule +3.5/10.0
- Rent growth +2.5/5.0
- Condition / age +2.5/5.0
- Livability +2.2/5.0
$224,900
🖨 Deal sheet 📄 Offer letter ✓ Due diligence
Listing remarks
Tucked away on nearly half an acre and backing up to peaceful woods, this 3 bedroom 2 bath Rockbridge home offers the perfect blend of privacy, convenience, and opportunity. Imagine enjoying your morning coffee while watching the seasons change in your own wooded backyard, or gathering with friends and family in the spacious lower-level rec room complete with a bar--perfect for game days, celebrations, and making memories. Located at 13388 Eagle Drive, you'll love the easy access to the US-33 bypass, making commuting simple while still being just minutes from the natural beauty, hiking trails, and attractions of Hocking Hills. Whether you're looking for a full-time residence, weekend retrea
Key facts
- Wooded backyard
- Hiking trails
- 0.43 acre lot
Tags
Property features AI
Exterior
- Parking: Attached 2-car garage
- Utilities: Well water; Private sewer
- Home design: Single-family residence; Bi-level design; Built in 1972; No common walls
- Construction: Block foundation
- Exterior features: Deck
Interior
- Bathrooms: 2 full bathrooms
- Interior features: Walk-out basement
Neighborhood map
What this means for you Summary
Snapshot
- This is a 3-bed/2.0-bath single-family listed at $225k.
Deal economics
- At list price, monthly cash flow is $121 ($1k/yr) — positive.
- The deal already cash-flows at list — no discount required.
- To meet the 1% rule (rent ≥ 1% of price), the offer needs to be $192k (14.8% below list).
- Recommended offer: $192k (14.8% below list) — sets the bar for 1% rule.
- Cap rate 6.9% vs local median 1.0% in Rockbridge — top-decile yield for the area; either an underpriced asset or a hidden risk that comps aren't pricing in. Stress-test before assuming the spread holds.
Location & tenants
- Location reads 44/100 on livability (#1,188 in OH) — a working-class tenant base; expect higher turnover. Strengths: cost of living A+, crime A; Watch: health & safety C-, schools D+, amenities F.
- Logan-Hocking Local (rural): math 55% / reading 58% proficiency, ranked #354 of 656 in OH (top 54%) — acceptable for families but not a draw, mixed tenant base, ~2y average lease.
- Market conditions: 45 active listings in the ZIP; 11 units permitted in Hocking County in 2024 (0 in 5+ unit buildings).
- This rent runs 40% of the median local income ($57k/yr) — at the standard rent-burdened threshold; future hikes will face affordability resistance.
Forward outlook
- In year one you build about $13k of equity ($2k loan paydown + $11k appreciation (5.0% local appreciation)).
- Hocking County population projected at -22% by 2050 — secular population decline; favor cash flow + early exit over multi-decade hold.
- At projected returns (5.0% appreciation + 3.0% rent growth), your $63k cash investment doubles in ~4 years — after that, you're playing with house money.
- By year 3, paydown + projected appreciation supports a ~$32k cash-out refi (75% LTV) — recoverable capital for the next deal without selling this one.
Negotiation context
- Only 14 days on market — expect competitive offers; lowballing is unlikely to land.
Questions for the listing agent
- Built in 1972 — when were the roof, HVAC, electrical panel, plumbing, and water heater last replaced?
- Is there a deadline driving the sale (1031 exchange, divorce, estate, relocation)? That informs how much negotiation room exists.
- Schools are D-rated, which usually means shorter tenancies and higher turnover. Who's the typical renter profile here, and what's been the actual vacancy rate?
- What's the average days-on-market for RENTAL listings here right now (not sales)? A rising rental-DOM trend means longer vacancies and softer asking-rent achievability than the comps imply.
- What's the recent tenant-quality profile in this submarket — average credit score on applications, eviction rate, late-payment / NSF rate, and stable-employment percentage? A property-management company in the area should have these aggregated.
- How much new for-sale + rental construction is in the pipeline within 1–3 miles? Heavy new supply typically softens prices + rents 12–24 months out; constrained supply supports both.
Investment metrics
- 1% rule
- 0.85% ✗
- Cap rate
- 6.94%
- Cash-on-cash
- 2.30%
- DSCR
- 1.10
- GRM
- 9.8
CMA / ARV
- ARV (on-the-fly)
- $648,000
- Comps found
- 1
Show comp detail 1 sale within ~0.75 mi
| Address | Dist | Beds/Ba | Sqft | Sold | Price | $/sf | Match |
|---|---|---|---|---|---|---|---|
| 13500 Pleasant Valley Rd | 0.11mi | 4/2.0 (+1) | 1,300 (-10%) | 2mo | $585,000 | $450 | 72 |
Match score weights: distance 35% · size 25% · config 20% · recency 20%. Top-matched comps best support the ARV.
Projected returns pro-forma
5.05% appreciation · 3.0% rent growth · sell at horizon
- IRR
- 14.9%
- Equity multiple
- 1.95×
- Total profit
- $60,076
- Equity at exit
- $128,106
- IRR
- 15.5%
- Equity multiple
- 3.77×
- Total profit
- $174,582
- Equity at exit
- $221,640
Cash invested: $62,972 (down + closing). Projections, not guarantees.
Landlord ↔ Tenant lean methodology
- Overall (STATE)
- 73 Landlord-Friendly
- State Ohio
- 73 Landlord-Friendly · R+6
- County
- — inherits STATE
- City
- — inherits STATE
ZIP-level market 43149
- Home prices YoY
- 1.8%
- Active inventory
- 45
- Price-to-rent
- 9.8×
Monthly cashflow live
- Estimated rent
- $1,915 medium interval (Pro) →
- Mortgage (P&I)
- −$1,179
- Tax from tax record
- −$119 /mo · $1,432/yr
- Insurance
- −$94
- HOA
- −$0
- Vacancy / Maint / Mgmt
- −$402
- Net cashflow
- $121
Break-even live
UW: 25.0% down · 7.5% · 30yr · 1.5% tax · 5.0% vac · 8.0% maint · 8.0% mgmt
Financing live
Cash to close
- Down payment
- $56,225
- Closing costs
- $6,747
- Reserves months
- —
- Total cash needed
- —
Loan-product check · same deal, 3 products live
Conventional
25% down · 7.5% · 30yr
- Down + closing
- —
- Monthly P&I
- —
- Monthly cashflow
- —
- DSCR
- —
- Eligible?
- —
Personal DTI + credit; lowest rate.
DSCR
20% down · 8.5% · 30yr
- Down + closing
- —
- Monthly P&I
- —
- Monthly cashflow
- —
- DSCR
- —
- Eligible?
- —
No personal income docs; deal must DSCR.
Hard money
10% down · 12.0% · 12mo
- Down + closing
- —
- Monthly P&I
- —
- Monthly cashflow
- —
- DSCR
- —
- Eligible?
- —
Short-term bridge; refi at stabilization.
Listing history 11 events
-
2026-06-18days on market $224,900 Active 14 DOM
-
2026-06-17days on market $224,900 Active 13 DOM
-
2026-06-16pricedays on market $224,900 Active 12 DOM
-
2026-06-15days on market $249,900 Active 11 DOM
-
2026-06-13days on market $249,900 Active 9 DOM
-
2026-06-13days on market $249,900 Active 8 DOM
-
2026-06-09days on market $249,900 Active 5 DOM
-
2026-06-08days on market $249,900 Active 4 DOM
-
2026-06-07days on market $249,900 Active 3 DOM
-
2026-06-05remarks 699-char remark
-
2026-06-05$249,900 Active 1 DOM
ⓘ Source: listings_history table (triggers on properties + properties_extension) + one-shot
backfill from property_details.listing_events for pre-trigger history.
Tax reassessment forecast OH · Partial reset (capped growth)
- Current annual tax
- $1,432 · $119/mo
- Projected year-2 tax
- $2,470 · $206/mo
- Expected delta
- +$1,038/yr (+$87/mo · 72.5%)
ⓘ Screening estimate from a state-policy table — verify with the county assessor before closing.
Climate risk First Street
- Flood 1/10 Low FEMA zone X (unshaded) · 0% chance over 30 yrs
- Wildfire 4/10 Moderate
- Heat 3/10 Moderate 7 d/yr ≥99°F today · 18 d/yr by 30 yrs out
- Wind 2/10 Low 100% chance of damaging wind over 30 yrs
- Air quality 2/10 Low 1 unhealthy d/yr today · 2 by 30 yrs out
Nearby sold comps map
Loading sold comps map…
Walkable amenities ~0.75 mi
Loading nearby amenities…
Taxation est. · year 1
- Rental income
- $22,986
- − Mortgage interest
- −$12,598
- − Property taxes
- −$1,432
- − Insurance
- −$1,124
- − Repairs & maintenance
- −$1,839
- − Management
- −$1,839
- − Depreciation
- −$6,543
- Taxable loss
- −$2,389
- Est. tax savings @ 24.0%
- +$573
- After-tax cash flow
- $2,023/yr
For passive investors: Depreciation is non-cash, so a rental often shows a tax loss while cash-flowing — sheltering income. Rental losses are passive: they offset passive income freely, and up to $25,000/yr can offset ordinary (W-2) income if you actively participate and your MAGI is under $100k (phasing out to $0 by $150k); unused losses carry forward. On sale, claimed depreciation is recaptured at up to 25%, and gains may owe capital-gains tax (a 1031 exchange can defer both). Figures are a year-1 estimate at your 24.0% rate — not tax advice; consult a CPA.
Schools (NCES district)
- District
- Logan-Hocking Local
- NCES district ID
- 3904424
- Math proficiency
- 55% ▼ -16.00%
- Reading proficiency
- 58% ▼ -11.00%
- Median HH income
- $42,737
- Composite
- 47.48/100
- National rank
- #2276
- State rank
- #354 of 656 in OH
Livability — Rockbridge
- Score
- 44/100
- State rank
- #1188
- US rank
- #26794
Category grades
Schools grade is shown separately in the Schools card above.
Census & demographics
- County
- Hocking · 26,658 people
- Metro
- Columbus, OH
- Population (ZIP)
- 2,160
- Household income
- $57,004
- Rent vs Own
Population outlook (Hocking County) Hauer SSP2
- Today (2025)
- 26,807 people
- By 2030
- 25,723 · -4.0%
- By 2040
- 23,370 · -12.8%
- By 2050
- 20,947 · -21.9%
- By 2075
- 15,624 · -41.7%
- By 2100
- 11,134 · -58.5%
Race, ethnicity, and origin ACS 2023
- Neighborhood character
- Predominantly White (96%)
- Race & ethnicity
- White 96% Two or more races 2% Asian 2% Hispanic / Latino 1%
- Common ancestry
- Italian 4% Iranian 3% Polish 2%
- Foreign-born
- 2% · India
- Languages at home
- 95% English-only · German/W. Germanic 2% Other Indo-European 2% Spanish 1%
Political lean MEDSL · Hocking
- 2024 margin
- Solid R (+44.3) · D 27.5% · R 71.8%
- 2008→2024 swing
- -43.5pp toward R · 2008: -0.8pp · 2024: -44.3pp
- All cycles
- 2024: R+44.3 2020: R+42.4 2016: R+36.5 2012: R+1.1 2008: R+0.8
Not yet ingested
- Civics
- —
Market trends
- HPI YoY
- ▲ 5.05%
- Current HPI
- 285.4089
- Rent YoY
- —
- Metro
- —
- State GDP YoY
- ▲ 1.98%
- F500 in state
- 48
Industry mix (Fortune 500 HQ in OH)
| Industry | F500 HQs | Revenue |
|---|---|---|
| Insurance | 3 | $145B |
|
||
| Industrial Machinery | 3 | $49B |
|
||
| Financial Services | 3 | $24B |
|
||
| Consumer Goods | 2 | $93B |
|
||
| Aerospace / Defense | 2 | $47B |
|
||
| Utilities | 2 | $33B |
|
||
Price history
1 event — show timeline
- 2026-06-04 Listed $249,900 CBRMLS
Property tax history
+1.1%/yrLatest (2025): $1,432 · +5.7% YoY. Source: county tax records.
Cash-flow waterfall
monthlySold comps — $/sqft
last 12 mo · ≤1 miLoading sold comps…