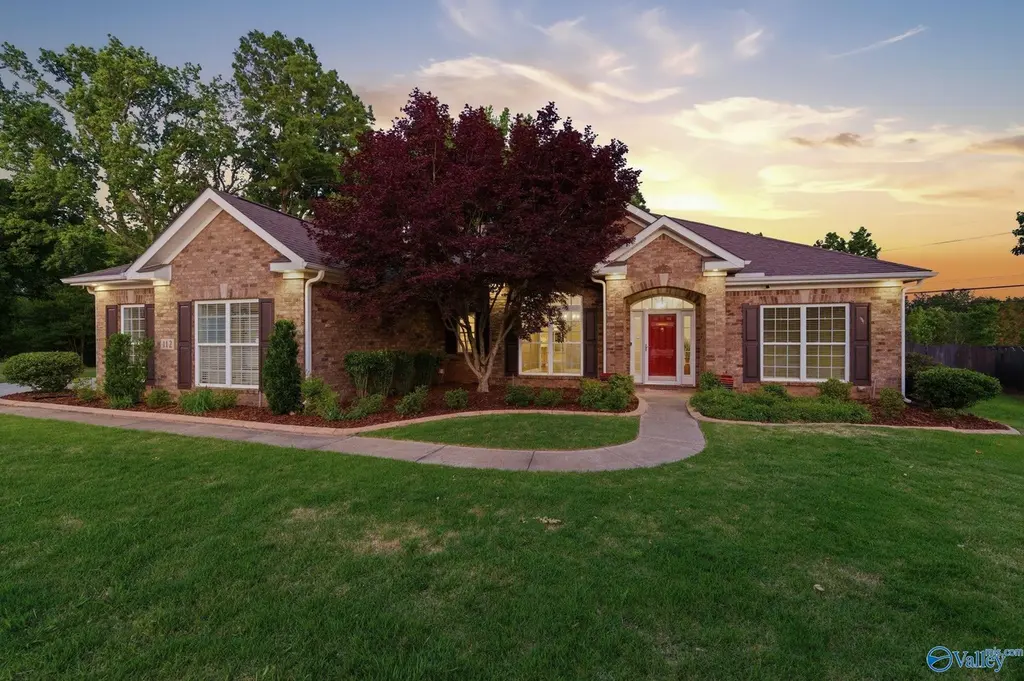
112 Mill Walk Ct · Madison, AL
Flood risk 1/10 · Minimal
- FEMA flood zone
- X (unshaded)
- Chance of flooding over 30 yrs
- 0.0%
- Est. flood insurance / yr
- $507 – $1,088
Fire risk 3/10 · Minor
- Est. fire insurance / yr
- $916 – $1,700
Heat risk 5/10 · Moderate
- Hot days now (above 106°F)
- 7 days/yr
- Hot days in 30 yrs
- 19 days/yr
Wind risk 4/10 · Minor
- Chance of severe wind over 30 yrs
- 19.0%
Air-quality risk 2/10 · Minimal
- Unhealthy air days now
- 1 days/yr
- Unhealthy air days in 30 yrs
- 1 days/yr
Risk factors via First Street. Map © Google.
Why this score? — see what drove the D- grade
The composite is a weighted blend of 9 inputs, each scored 0–100. Each bar is that input's sub-score; the figure is the points it added to the 100-point composite (weight × sub-score).
- Appreciation +10.0/10.0
- ARV discount +9.5/15.0
- Schools +5.6/10.0
- Cash flow +4.4/30.0
- Livability +3.8/5.0
- Rent growth +2.9/5.0
- Condition / age +2.5/5.0
- 1% rule +0.0/10.0
- DSCR +0.0/10.0
$625,000
🖨 Deal sheet (PDF) 📄 Offer letter ✓ Due diligence
Listing remarks
WELCOME HOME! ASSUMABLE VA LOAN AT 2.25% for qualified buyers. Quiet cul-de-sac in an established Madison City neighborhood sits this beautiful 4bed/4.5bath home. Dedicated office/study for those that work from home, formal dining room plus a generous breakfast room. Large kitchen with plenty of cabinetry and pantry. Primary bedroom and glamor bathroom separated from the additional 3 bedrooms. Bonus/rec room upstairs with walk-in storage and a full bathroom. HEATED AND COOLED Sunroom with Champion windows, perfect for relaxing and enjoying the view. STORM SHELTER, HVAC 2018,2009, ROOF 2023, FRESH PAINT & NEW CARPET. Walk to the Bradford Creek Greenway and the Dog park!
Key facts
- 3 garage spots
- Community pool
- Built 2009
Property features AI
Finance
- Other: Lot dimensions approx. 55 x 126 x 162 x 108 x 155; Living area listed as 3,539 square feet
- HOA & community: HOA with annual fee ($525/year); Community clubhouse; Community pool; Curbs and sidewalks in the community; Subdivision: Millstone
Exterior
- Parking: Attached three-car garage that faces the side
- Utilities: Public water; Public sewer; Electrical service (standard)
- Home design: Single-family residence; Residential property; Built in 2009; One and one-half story
- Construction: Brick construction; Slab foundation
- Exterior features: Curb and gutters; Sidewalk; Underground utilities; Sprinkler system; Storm shelter; Patio; Front porch; Covered porch
Interior
- Bathrooms: 4 full bathrooms; 1 half bathroom
- Heating & cooling: Central heating; Central cooling
- Interior features: One fireplace
Neighborhood map
What this means for you Summary
Snapshot
- This is a 4-bed/2.0-bath single-family listed at $625k.
Deal economics
- At list price, monthly cash flow is $-2k ($-20k/yr) — negative.
- To cash-flow at today's rent, offer at most $336k (46.2% below list).
- To meet the 1% rule (rent ≥ 1% of price), the offer needs to be $267k (57.3% below list).
- Recommended offer: $267k (57.3% below list) — sets the bar for 1% rule.
- Cap rate 3.2% vs local median 2.6% in Madison — meaningfully above typical; check what's discounted (condition, days-on-market, listing class) to confirm the premium yield is real.
Location & tenants
- Location reads 76/100 on livability (#12 in AL, #3,280 nationally) — a middle-class / working-renter tenant base. Strengths: employment A+, housing A+, crime B+; Watch: amenities F, commute F.
- Madison City (suburban): math 51% / reading 71% proficiency, ranked #4 of 129 in AL (top 3%) — acceptable for families but not a draw, mixed tenant base, ~2y average lease; only 17% free/reduced lunch — higher-income household profile.
- Zoned schools: Mill Creek Elementary School (math 61% / reading 77%, grade A-, #29 of 627 statewide, top 5%, 940 students, 22% FRL).
- Market conditions: Rents rising (+1.6%/yr); 382 active listings in the ZIP; 8 comparable units currently listed for rent nearby; rentals at typical pace (median 25d on market — plan ~3-4 weeks tenant-placement turnaround); high-income renter base; 4,709 units permitted in Madison County in 2024 (1,186 in 5+ unit buildings).
Forward outlook
- In year one you build about $67k of equity ($4k loan paydown + $62k appreciation (10.0% local appreciation)).
- Madison County population projected at +18% by 2050 — long-run rental-demand tailwind backs the buy-and-hold thesis.
- By year 2, paydown + projected appreciation supports a ~$107k cash-out refi (75% LTV) — recoverable capital for the next deal without selling this one.
Negotiation context
- It's been on market 35 days — a 3% lower offer ($606k) is reasonable based on typical stale-listing flexibility.
- 2 sale attempts with the ask held roughly flat each time — persistent listings suggest the price (not the market) is what's stuck; bring a comps-based counter.
Risks & watch-outs
- Climate carrying-cost: extreme-heat days projected 7→19/yr by 2055 (HVAC capex compounding) — expect insurance premiums to compound above CPI over the hold.
Questions for the listing agent
- What do current leases actually rent for vs. the listed asking? Can we see a recent rent roll and the last 12 months of T-12 income?
- It's been on market 35 days. Have you received any prior offers? Is the seller open to a 57% concession, seller financing, or rate buy-down credit?
- What does the HOA fee cover, when was the last increase, and are there any pending special assessments or reserve-fund shortfalls?
- Is there a deadline driving the sale (1031 exchange, divorce, estate, relocation)? That informs how much negotiation room exists.
- Schools are A-rated — typically a magnet for longer-tenancy family renters. What's the average tenant stay here, and is there a school-zone premium baked into asking?
- The area grade is low — what's the realistic commute time and amenity access for the typical tenant pool here? Any planned neighborhood developments (good or bad) we should know about?
- What's the average days-on-market for RENTAL listings here right now (not sales)? A rising rental-DOM trend means longer vacancies and softer asking-rent achievability than the comps imply.
- What's the recent tenant-quality profile in this submarket — average credit score on applications, eviction rate, late-payment / NSF rate, and stable-employment percentage? A property-management company in the area should have these aggregated.
- How much new for-sale + rental construction is in the pipeline within 1–3 miles? Heavy new supply typically softens prices + rents 12–24 months out; constrained supply supports both.
Investment metrics
- 1% rule
- 0.43% ✗
- Cap rate
- 3.16%
- Cash-on-cash
- -11.21%
- DSCR
- 0.50
- GRM
- 19.5
CMA / ARV
- ARV (median comp)
- $653,632
- List price
- $625,000
- Delta
- -4.38%
- Verdict
- FAIR
- Comps
- 20 within 1.0 mi
Show comp detail 12 sales within ~0.75 mi
| Address | Dist | Beds/Ba | Sqft | Sold | Price | $/sf | Match |
|---|---|---|---|---|---|---|---|
| 268 Heritage Mill Dr | 0.11mi | 4/3.5 | 3,239 (-0%) | 1mo | $547,500 | $169 | 88 |
| 520 Mill Rd | 0.12mi | 5/3.0 (+1) | 3,349 (+3%) | 5mo | $1,250,000 | $373 | 76 |
| 111 Mill Ridge Dr | 0.15mi | 4/4.5 | 3,259 (+0%) | 10mo | $529,000 | $162 | 74 |
| 134 Mill Park Ln | 0.33mi | 4/3.5 | 2,827 (-13%) | 0mo | $525,000 | $186 | 57 |
| 108 Pitalo St | 0.54mi | 5/3.5 (+1) | 3,366 (+4%) | 1mo | $549,000 | $163 | 56 |
| 100 Spotted Fawn Rd | 0.70mi | 4/3.0 | 3,191 (-2%) | 9mo | $519,000 | $163 | 53 |
| 135 Mill Park Ln | 0.33mi | 5/4.5 (+1) | 3,590 (+11%) | 6mo | $605,000 | $169 | 46 |
| 137 Spotted Fawn Rd | 0.62mi | 4/3.0 | 2,810 (-13%) | 0mo | $470,000 | $167 | 44 |
| 123 Cormorant Lndg | 0.69mi | 4/3.5 | 3,618 (+12%) | 1mo | $585,000 | $162 | 42 |
| 104 Pitalo St | 0.52mi | 5/3.5 (+1) | 3,596 (+11%) | 7mo | $515,000 | $143 | 41 |
| 102 Kayo Rd | 0.70mi | 4/3.0 | 2,773 (-14%) | 3mo | $474,000 | $171 | 37 |
| 117 Westminster Way | 0.63mi | 3/2.5 (-1) | 2,767 (-15%) | 7mo | $425,000 | $154 | 33 |
Match score weights: distance 35% · size 25% · config 20% · recency 20%. Top-matched comps best support the ARV.
Projected returns pro-forma
10.0% appreciation · 1.58% rent growth · sell at horizon
- IRR
- 16.2%
- Equity multiple
- 2.33×
- Total profit
- $232,241
- Equity at exit
- $563,050
- IRR
- 15.4%
- Equity multiple
- 5.33×
- Total profit
- $757,935
- Equity at exit
- $1,214,238
Cash invested: $175,000 (down + closing). Projections, not guarantees.
Landlord ↔ Tenant lean methodology
- Overall (STATE)
- 90 Strongly Landlord-Friendly
- State Alabama
- 90 Strongly Landlord-Friendly · R+15
- County
- — inherits STATE
- City
- — inherits STATE
ZIP-level market 35758
- Home prices YoY
- 4.2%
- Rents YoY
- 1.6%
- Active inventory
- 382
- Price-to-rent
- 19.5×
Monthly cashflow live
- Estimated rent
- $2,669 high interval (Pro) →
- Mortgage (P&I)
- −$3,278
- Tax from tax record
- −$160 /mo · $1,925/yr
- Insurance
- −$260
- HOA
- −$44
- Vacancy / Maint / Mgmt
- −$560
- Net cashflow
- $-1,634
Break-even live
Sensitivity live
| Price | -10% $-1,280 | -5% $-1,457 | +0% $-1,634 | +5% $-1,811 | +10% $-1,988 |
|---|---|---|---|---|---|
| Rent | -10% $-1,845 | -5% $-1,740 | +0% $-1,634 | +5% $-1,529 | +10% $-1,423 |
| Rate | -1.0pp $-1,319 | -0.5pp $-1,475 | base $-1,634 | +0.5pp $-1,796 | +1.0pp $-1,961 |
UW: 25.0% down · 7.5% · 30yr · 1.5% tax · 5.0% vac · 8.0% maint · 8.0% mgmt
Financing live
Cash to close
- Down payment
- $156,250
- Closing costs
- $18,750
- Reserves months
- —
- Total cash needed
- —
Loan-product check · same deal, 3 products live
Conventional
25% down · 7.5% · 30yr
- Down + closing
- —
- Monthly P&I
- —
- Monthly cashflow
- —
- DSCR
- —
- Eligible?
- —
Personal DTI + credit; lowest rate.
DSCR
20% down · 8.5% · 30yr
- Down + closing
- —
- Monthly P&I
- —
- Monthly cashflow
- —
- DSCR
- —
- Eligible?
- —
No personal income docs; deal must DSCR.
Hard money
10% down · 12.0% · 12mo
- Down + closing
- —
- Monthly P&I
- —
- Monthly cashflow
- —
- DSCR
- —
- Eligible?
- —
Short-term bridge; refi at stabilization.
Rent comps 8 comps
| Address | Beds | Baths | Sqft | Rent | $/sqft | DOM | Units | Dist |
|---|---|---|---|---|---|---|---|---|
| 101 Mill Ridge Dr Madison, AL | 4.0 | 3.5 | 3453 | $3,100 | $0.90 | 15d | 1 | 0.12mi |
| 240 Heritage Mill Dr Madison, AL | 4.0 | 4.5 | 3600 | $2,975 | $0.83 | 45d | 1 | 0.36mi |
| 227 Park Stone Dr Madison, AL | 4.0 | 2.5 | 2516 | $2,300 | $0.91 | 24d | 1 | 0.65mi |
| 137 Cormorant Lndg Madison, AL | 4.0 | 3.5 | 3692 | $3,600 | $0.98 | 24d | 1 | 0.77mi |
| 104 Horseshoe Bnd S Madison, AL | 4.0 | 3.5 | 3100 | $2,650 | $0.85 | 45d | 1 | 1.17mi |
| 189 Merganser Blvd Madison, AL | 4.0 | 2.5 | 2225 | $1,995 | $0.90 | 24d | 1 | 1.24mi |
| 123 Chelsea Park Madison, AL | 3.0 | 3.0 | 2580 | $2,650 | $1.03 | 15d | 1 | 1.31mi |
| 110 Chelsea Park Madison, AL | 3.0 | 2.5 | 2311 | $2,600 | $1.13 | 45d | 1 | 1.32mi |
HOA detail
- Monthly dues
- $44 · $528/yr
Listing history 18 events
-
2026-06-18days on market $625,000 Active 35 DOM
-
2026-06-17days on market $625,000 Active 34 DOM
-
2026-06-16days on market $625,000 Active 33 DOM
-
2026-06-15days on market $625,000 Active 32 DOM
-
2026-06-14days on market $625,000 Active 30 DOM
-
2026-06-10days on market $625,000 Active 27 DOM
-
2026-06-09days on market $625,000 Active 26 DOM
-
2026-06-08days on market $625,000 Active 25 DOM
-
2026-06-07days on market $625,000 Active 24 DOM
-
2026-06-03days on market $625,000 Active 20 DOM
-
2026-06-02days on market $625,000 Active 19 DOM
-
2026-06-01days on market $625,000 Active 18 DOM
-
2026-05-31days on market $625,000 Active 17 DOM
-
2026-05-30days on market $625,000 Active 16 DOM
-
2026-05-14$625,000 Active 682-char remark
-
2026-04-28historical $3,500
-
2026-04-08price $3,500
-
2026-02-06$3,750
ⓘ Source: listings_history table (triggers on properties + properties_extension) + one-shot
backfill from property_details.listing_events for pre-trigger history.
Tax reassessment forecast AL · Resets to sale price
- Current annual tax
- $1,925 · $160/mo
- Projected year-2 tax
- $2,562 · $214/mo
- Expected delta
- +$637/yr (+$53/mo · 33.1%)
ⓘ Screening estimate from a state-policy table — verify with the county assessor before closing.
Climate risk First Street
- Flood 1/10 Low FEMA zone X (unshaded) · 0% chance over 30 yrs
- Wildfire 3/10 Moderate
- Heat 5/10 Major 7 d/yr ≥106°F today · 19 d/yr by 30 yrs out
- Wind 4/10 Moderate 19% chance of damaging wind over 30 yrs
- Air quality 2/10 Low 1 unhealthy d/yr today · 1 by 30 yrs out
Nearby sold comps map
Loading sold comps map…
Walkable amenities ~0.75 mi
Loading nearby amenities…
Taxation est. · year 1
- Rental income
- $32,025
- − Mortgage interest
- −$35,010
- − Property taxes
- −$1,925
- − Insurance
- −$3,125
- − Repairs & maintenance
- −$2,562
- − Management
- −$2,562
- − HOA
- −$528
- − Depreciation
- −$18,182
- Taxable loss
- −$31,869
- Est. tax savings @ 24.0%
- +$7,648
- After-tax cash flow
- $-11,961/yr
For passive investors: Depreciation is non-cash, so a rental often shows a tax loss while cash-flowing — sheltering income. Rental losses are passive: they offset passive income freely, and up to $25,000/yr can offset ordinary (W-2) income if you actively participate and your MAGI is under $100k (phasing out to $0 by $150k); unused losses carry forward. On sale, claimed depreciation is recaptured at up to 25%, and gains may owe capital-gains tax (a 1031 exchange can defer both). Figures are a year-1 estimate at your 24.0% rate — not tax advice; consult a CPA.
Schools (NCES district)
- District
- Madison City
- NCES district ID
- 0100008
- Math proficiency
- 51% ▼ -25.00%
- Reading proficiency
- 71% ▼ -2.00%
- Median HH income
- $89,091
- Composite
- 55.56/100
- National rank
- #1238
- State rank
- #4 of 129 in AL
Livability — Madison
- Score
- 76/100
- State rank
- #12
- US rank
- #3280
Category grades
Schools grade is shown separately in the Schools card above.
Census & demographics
- Census place
- Madison, AL
- County
- Madison County · 380,832 people
- City population
- 93,742
- Metro
- Huntsville, AL
- Population (ZIP)
- 50,266
- Household income
- $117,380
- Rent vs Own
- Severe rent burden
- 875.0
Population outlook (Madison County) Hauer SSP2
- Today (2025)
- 392,086 people
- By 2030
- 409,788 · +4.5%
- By 2040
- 440,557 · +12.4%
- By 2050
- 460,990 · +17.6%
- By 2075
- 502,872 · +28.3%
- By 2100
- 513,623 · +31.0%
Race, ethnicity, and origin ACS 2023
- Neighborhood character
- Predominantly White (68%)
- Race & ethnicity
- White 68% Black 14% Hispanic / Latino 8% Asian 7% Two or more races 7%
- Hispanic origin (detail)
- Mexican 3% Puerto Rican 2%
- Common ancestry
- Slovak 3% Italian 2% Lithuanian 2%
- Foreign-born
- 9% · Canada, South Korea, Vietnam
- Languages at home
- 87% English-only · Spanish 5% Other Asian/Pacific 2% Chinese 1%
Political lean MEDSL · Madison
- 2024 margin
- Lean R (+9.0) · D 44.7% · R 53.7% · Other 1.6%
- 2008→2024 swing
- +6.0pp toward D · 2008: -14.9pp · 2024: -9.0pp
- All cycles
- 2024: R+9.0 2020: R+8.0 2016: R+16.8 2012: R+18.7 2008: R+14.9
Not yet ingested
- Civics
- —
Market trends
- HPI YoY
- ▲ 14.46%
- Current HPI
- 355.2784
- Rent YoY
- ▲ 1.58%
- Metro
- Huntsville, AL
- State GDP YoY
- ▲ 2.94%
- F500 in state
- 4
Industry mix (Fortune 500 HQ in AL)
| Industry | F500 HQs | Revenue |
|---|---|---|
| Financial Services | 1 | $8B |
|
||
| Healthcare | 1 | $5B |
|
||
Price history
+16566.7% since first listed4 events — show timeline
- 2026-05-14 Listed $625,000 VMLS
- 2026-04-28 Rental Removed $3,500 VMLS
- 2026-04-08 Price Changed $3,500 VMLS
- 2026-02-06 Listed for Rent $3,750 VMLS
Property tax history
+3.0%/yrLatest (2017): $1,925 · +7.9% YoY. Source: county tax records.
Cash-flow waterfall
monthlySold comps — $/sqft
last 12 mo · ≤1 miLoading sold comps…