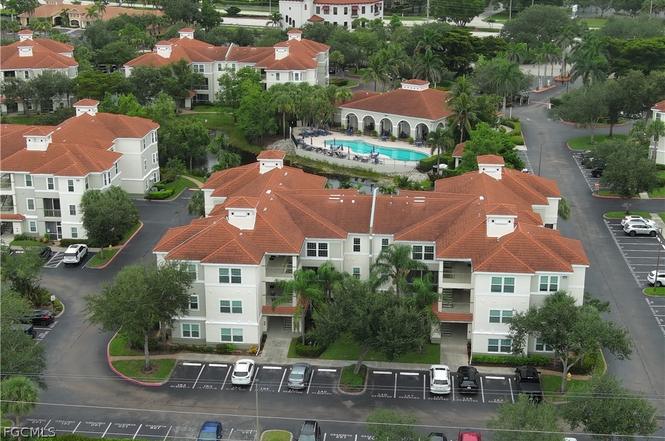
23660 Walden Center Dr #305 · Estero, FL
Flood risk 3/10 · Minor
- FEMA flood zone
- X (unshaded)
- Chance of flooding over 30 yrs
- 0.12%
- Est. flood insurance / yr
- $507 – $1,088
Fire risk 1/10 · Minimal
- Est. fire insurance / yr
- $947 – $1,759
Heat risk 10/10 · Severe
- Hot days now (above 107°F)
- 7 days/yr
- Hot days in 30 yrs
- 31 days/yr
Wind risk 10/10 · Severe
- Chance of severe wind over 30 yrs
- 99.0%
Air-quality risk 3/10 · Minor
- Unhealthy air days now
- 2 days/yr
- Unhealthy air days in 30 yrs
- 2 days/yr
Risk factors via First Street. Map © Google.
Why this score? — see what drove the C grade
The composite is a weighted blend of 9 inputs, each scored 0–100. Each bar is that input's sub-score; the figure is the points it added to the 100-point composite (weight × sub-score).
- Cash flow +20.7/30.0
- 1% rule +7.6/10.0
- ARV discount +7.5/15.0
- DSCR +6.6/10.0
- Schools +4.1/10.0
- Livability +4.0/5.0
- Rent growth +3.2/5.0
- Condition / age +2.5/5.0
- Appreciation +0.0/10.0
$149,000
🖨 Deal sheet 📄 Offer letter ✓ Due diligence
Listing remarks
Priced for Immediate Sale! Previous buyer unable to obtain financing - agents review remarks for complete description - Move-in ready and priced to sell! See 3D Tour! Lowest priced unit in The Tides by nearly $50,000 (more expensive unit is smaller than this unit) and $41,000 lower than the most recent sale of this exact floorplan! Ready and available for immediate occupancy. Top floor unit offers privacy and no neighbors above you! Surrounded by tropical, well-manicured grounds, residents enjoy access to a heated swimming pool, an inviting clubhouse, tennis and pickleball courts, basketball facilities, and a sand volleyball court. Ideally situated directly across from Coconut Point, minute
Key facts
- Top floor unit
- Inviting clubhouse
- Heated swimming pool
Tags
Property features AI
Finance
- Other: Community contains approximately 640 units
- Financial info: Pets allowed with conditions; contact for details
- HOA & community: Homeowners association with quarterly fee; Association amenities include clubhouse, management, pool, tennis courts and basketball court; HOA covers irrigation water, grounds maintenance, recreation facilities, road maintenance, sewer and water
Exterior
- Parking: Assigned parking (one space)
- Security: Fire sprinkler system; Smoke detectors; Gated community
- Utilities: Public water; Public sewer; Cable available
- Home design: 3-story building; Entry on level 3; Northeast-facing; Southwest exposure
- Construction: Block, concrete and stucco construction; Tile roof
- Exterior features: Community tennis courts; Community pool
Interior
- Kitchen: Dishwasher; Freezer; Microwave; Refrigerator; Self-cleaning oven
- Bedrooms: Great Room
- Flooring: Carpet; Tile
- Bathrooms: 1 full bathroom
- Heating & cooling: Central heating (electric); Central air conditioning (electric); Ceiling fans
- Interior features: Separate/formal dining room; Shower-only bath with a separate shower; Single-hung windows; Unfurnished
- Laundry & utility: Inside laundry
Neighborhood map
What this means for you Summary
Snapshot
- This is a 1-bed/1.0-bath condo listed at $149k.
Deal economics
- At list price, monthly cash flow is $201 ($2k/yr) — positive.
- The deal already cash-flows at list — no discount required.
- Meets the 1% rule at list price ($2k rent vs $149k).
- Recommended offer: $140k (6.0% below list) — sets the bar for market timing.
- Cap rate 7.9% vs local median 3.4% in Estero — top-decile yield for the area; either an underpriced asset or a hidden risk that comps aren't pricing in. Stress-test before assuming the spread holds.
Location & tenants
- Location reads 79/100 on livability (#149 in FL, #2,242 nationally) — a middle-class / working-renter tenant base. Strengths: crime A+, employment A+, housing A+; Watch: amenities F, commute F, cost of living D-.
- Lee (suburban): math 47% / reading 50% proficiency, ranked #42 of 73 in FL (top 58%) — families likely to look elsewhere, expect single-tenant / working-renter base with shorter leases.
- Market conditions: Rents rising (+2.9%/yr); 699 active listings in the ZIP; 9 comparable units currently listed for rent nearby; rentals at typical pace (median 19d on market — plan ~3-4 weeks tenant-placement turnaround); high-income renter base; 15,411 units permitted in Lee County in 2024 (4,686 in 5+ unit buildings).
- This rent is only 17% of the median local income ($131k/yr) — well below the 30% rent-burden line; pricing power to push rent on renewal without tenant pushback.
Forward outlook
- Local home prices are declining (-3.0%/yr); year-one equity from $1k of loan paydown is wiped out by about $4k of value loss. Plan a longer hold.
- Lee County population projected at +44% by 2050 — long-run rental-demand tailwind backs the buy-and-hold thesis.
Negotiation context
- It's been on market 90 days — a 6% lower offer ($140k) is reasonable based on typical stale-listing flexibility.
- 2 sale attempts; this cycle's ask has dropped $16k (10%) from the opening price — seller is motivated, your offer sets the floor, not the list.
Risks & watch-outs
- Climate carrying-cost: severe wind risk, 99% chance of damaging wind over 30y; extreme-heat days projected 7→31/yr by 2055 (HVAC capex compounding) — expect insurance premiums to compound above CPI over the hold.
Questions for the listing agent
- It's been on market 90 days. Have you received any prior offers? Is the seller open to a 6% concession, seller financing, or rate buy-down credit?
- What does the HOA fee cover, when was the last increase, and are there any pending special assessments or reserve-fund shortfalls?
- Any open or pending special assessments — roof, HVAC, plumbing, elevator, façade? What's the per-unit balance and payoff schedule, and is the seller paying it off at close or rolling it to the buyer?
- Why hasn't it sold? Are there any deal-killer items the seller is aware of (foundation, flood, title, zoning, code violations)?
- Is there a deadline driving the sale (1031 exchange, divorce, estate, relocation)? That informs how much negotiation room exists.
- Schools are A-rated — typically a magnet for longer-tenancy family renters. What's the average tenant stay here, and is there a school-zone premium baked into asking?
- What's the average days-on-market for RENTAL listings here right now (not sales)? A rising rental-DOM trend means longer vacancies and softer asking-rent achievability than the comps imply.
- What's the recent tenant-quality profile in this submarket — average credit score on applications, eviction rate, late-payment / NSF rate, and stable-employment percentage? A property-management company in the area should have these aggregated.
- How much new apartment / multifamily construction is in the pipeline within 1–3 miles? Heavy new supply (>2% of stock underway) typically softens rents 12–24 months out; light construction supports rent growth.
Investment metrics
- 1% rule
- 1.26% ✓
- Cap rate
- 7.91%
- Cash-on-cash
- 5.79%
- DSCR
- 1.26
- GRM
- 6.6
CMA / ARV
No comps found within radius.
Projected returns pro-forma
-3.0% appreciation · 2.85% rent growth · sell at horizon
- IRR
- -7.4%
- Equity multiple
- 0.73×
- Total profit
- $-11,432
- Equity at exit
- $22,216
- IRR
- 2.1%
- Equity multiple
- 1.15×
- Total profit
- $6,123
- Equity at exit
- $12,883
Cash invested: $41,720 (down + closing). Projections, not guarantees.
Landlord ↔ Tenant lean methodology
- Overall (STATE)
- 87 Strongly Landlord-Friendly
- State Florida
- 87 Strongly Landlord-Friendly · R+3
- County
- — inherits STATE
- City
- — inherits STATE
ZIP-level market 34134
- Rents YoY
- 2.9%
- Active inventory
- 699
- Price-to-rent
- 6.6×
Monthly cashflow live
- Estimated rent
- $1,871 high interval (Pro) →
- Mortgage (P&I)
- −$781
- Tax from tax record
- −$142 /mo · $1,698/yr
- Insurance
- −$62
- HOA
- −$292
- Vacancy / Maint / Mgmt
- −$393
- Net cashflow
- $201
Break-even live
UW: 25.0% down · 7.5% · 30yr · 1.5% tax · 5.0% vac · 8.0% maint · 8.0% mgmt
Financing live
Cash to close
- Down payment
- $37,250
- Closing costs
- $4,470
- Reserves months
- —
- Total cash needed
- —
Loan-product check · same deal, 3 products live
Conventional
25% down · 7.5% · 30yr
- Down + closing
- —
- Monthly P&I
- —
- Monthly cashflow
- —
- DSCR
- —
- Eligible?
- —
Personal DTI + credit; lowest rate.
DSCR
20% down · 8.5% · 30yr
- Down + closing
- —
- Monthly P&I
- —
- Monthly cashflow
- —
- DSCR
- —
- Eligible?
- —
No personal income docs; deal must DSCR.
Hard money
10% down · 12.0% · 12mo
- Down + closing
- —
- Monthly P&I
- —
- Monthly cashflow
- —
- DSCR
- —
- Eligible?
- —
Short-term bridge; refi at stabilization.
Rent comps 9 comps
| Address | Beds | Baths | Sqft | Rent | $/sqft | DOM | Units | Dist |
|---|---|---|---|---|---|---|---|---|
| 23660 Walden Center Dr Estero, FL | 1.0 | 1.0 | 557 | $1,498 | $2.69 | 21d | 1 | 0.04mi |
| 23660 Walden Center Dr Estero, FL | 1.0 | 1.0 | 649 | $1,522 | $2.34 | 14d | 1 | 0.04mi |
| 23500 Walden Center Dr Estero, FL | 1.0–2.0 | 1.0–2.0 | 803 | $1,500 | $1.87 | 15d | 3 | 0.11mi |
| 23540 Walden Center Dr #206 Estero, FL | 1.0 | 1.0 | 557 | $1,600 | $2.87 | 23d | 1 | 0.14mi |
| 23580 Walden Center Dr #209 Estero, FL | 1.0 | 1.0 | 742 | $1,550 | $2.09 | 19d | 1 | 0.17mi |
| 23560 Walden Center Dr #207 Estero, FL | 1.0 | 1.0 | 557 | $1,475 | $2.65 | 3d | 1 | 0.18mi |
| 22201 Fountain Lakes Blvd Estero, FL | 1.0–3.0 | 1.0–2.0 | 1000 | $1,299 | $1.30 | 23d | 1 | 1.15mi |
| 3100 Seasons Way Estero, FL | 1.0–2.0 | 1.0–2.0 | 842 | $1,300 | $1.54 | 3d | 4 | 1.44mi |
| 3100 Seasons Way Estero, FL | 1.0–2.0 | 1.0–2.0 | 842 | $1,339 | $1.59 | 18d | 4 | 1.44mi |
HOA detail condo
- Monthly dues
- $292 · $3,504/yr
- Likely covers
- landscapingpool
- Assessments
- None detected in remarks — confirm with the listing agent.
Listing history 17 events
-
2026-06-17days on market $149,000 Active 90 DOM
-
2026-06-16days on market $149,000 Active 89 DOM
-
2026-06-15days on market $149,000 Active 88 DOM
-
2026-06-13days on market $149,000 Active 86 DOM
-
2026-06-10days on market $149,000 Active 83 DOM
-
2026-06-09days on market $149,000 Active 82 DOM
-
2026-06-07days on market $149,000 Active 80 DOM
-
2026-06-03days on market $149,000 Active 76 DOM
-
2026-06-02days on market $149,000 Active 75 DOM
-
2026-06-01days on market $149,000 Active 74 DOM
-
2026-06-01days on market $149,000 Active 73 DOM
-
2026-05-13status Active
-
2026-05-13price $149,000
-
2026-04-07status Pending
-
2026-02-11$165,000 Active
-
2006-09-13soldstatus $175,000
-
2004-09-30soldstatus $27,500,000
ⓘ Source: listings_history table (triggers on properties + properties_extension) + one-shot
backfill from property_details.listing_events for pre-trigger history.
Tax reassessment forecast FL · Resets to sale price
- Current annual tax
- $1,698 · $142/mo
- Projected year-2 tax
- $1,698 · $142/mo
- Expected delta
- $0/yr ($0/mo · 0.0%)
ⓘ Screening estimate from a state-policy table — verify with the county assessor before closing.
Climate risk First Street
- Flood 3/10 Moderate FEMA zone X (unshaded) · 12% chance over 30 yrs
- Wildfire 1/10 Low
- Heat 10/10 Extreme 7 d/yr ≥107°F today · 31 d/yr by 30 yrs out
- Wind 10/10 Extreme 99% chance of damaging wind over 30 yrs
- Air quality 3/10 Moderate 2 unhealthy d/yr today · 2 by 30 yrs out
Nearby sold comps map
Loading sold comps map…
Walkable amenities ~0.75 mi
Loading nearby amenities…
Taxation est. · year 1
- Rental income
- $22,453
- − Mortgage interest
- −$8,346
- − Property taxes
- −$1,698
- − Insurance
- −$745
- − Repairs & maintenance
- −$1,796
- − Management
- −$1,796
- − HOA
- −$3,504
- − Depreciation
- −$4,335
- Taxable income
- $233
- Est. tax owed @ 24.0%
- −$56
- After-tax cash flow
- $2,358/yr
For passive investors: Depreciation is non-cash, so a rental often shows a tax loss while cash-flowing — sheltering income. Rental losses are passive: they offset passive income freely, and up to $25,000/yr can offset ordinary (W-2) income if you actively participate and your MAGI is under $100k (phasing out to $0 by $150k); unused losses carry forward. On sale, claimed depreciation is recaptured at up to 25%, and gains may owe capital-gains tax (a 1031 exchange can defer both). Figures are a year-1 estimate at your 24.0% rate — not tax advice; consult a CPA.
Schools (NCES district)
- District
- Lee
- NCES district ID
- 1201080
- Math proficiency
- 47% ▼ -11.00%
- Reading proficiency
- 50% ▼ -4.00%
- Median HH income
- $49,518
- Composite
- 41.49/100
- National rank
- #3458
- State rank
- #42 of 73 in FL
Livability — Estero
- Score
- 79/100
- State rank
- #149
- US rank
- #2242
Category grades
Schools grade is shown separately in the Schools card above.
Census & demographics
- Census place
- Estero, FL
- County
- Lee County · 788,662 people
- City population
- 64,727
- Metro
- Cape Coral-Fort Myers, FL
- Population (ZIP)
- 16,475
- Household income
- $130,719
- Rent vs Own
- Severe rent burden
- 554.0
Population outlook (Lee County) Hauer SSP2
- Today (2025)
- 871,946 people
- By 2030
- 955,468 · +9.6%
- By 2040
- 1,113,587 · +27.7%
- By 2050
- 1,256,891 · +44.1%
- By 2075
- 1,560,270 · +78.9%
- By 2100
- 1,726,848 · +98.0%
Race, ethnicity, and origin ACS 2023
- Neighborhood character
- Predominantly White (91%)
- Race & ethnicity
- White 91% Hispanic / Latino 5% Two or more races 3% Asian 1%
- Common ancestry
- Slovak 5% Romanian 4% Serbian 2%
- Foreign-born
- 10% · Canada, Jamaica
- Languages at home
- 91% English-only · Spanish 4% German/W. Germanic 1% Other Indo-European 1%
Political lean MEDSL · Lee
- 2024 margin
- Strong R (+28.4) · D 35.5% · R 63.9%
- 2008→2024 swing
- -18.0pp toward R · 2008: -10.4pp · 2024: -28.4pp
- All cycles
- 2024: R+28.4 2020: R+19.2 2016: R+20.4 2012: R+16.6 2008: R+10.4
Not yet ingested
- Civics
- —
Market trends
- HPI YoY
- ▼ -236.48%
- Current HPI
- 237.4416
- Rent YoY
- ▲ 2.85%
- Metro
- Cape Coral-Fort Myers, FL
- State GDP YoY
- ▲ 3.28%
- F500 in state
- 36
Industry mix (Fortune 500 HQ in FL)
| Industry | F500 HQs | Revenue |
|---|---|---|
| Industrial Technology | 2 | $29B |
|
||
| Insurance | 2 | $17B |
|
||
| Retail | 1 | $60B |
|
||
| Technology Distribution | 1 | $58B |
|
||
| Homebuilding | 1 | $35B |
|
||
| Technology Manufacturing | 1 | $35B |
|
||
Price history
-99.5% since first listed6 events — show timeline
- 2026-05-13 Relisted — FORTMLS
- 2026-05-13 Price Changed $149,000 FORTMLS
- 2026-04-07 Pending — FORTMLS
- 2026-02-11 Listed $165,000 FORTMLS
- 2006-09-13 Sold (Public Records) $175,000 Public Records
- 2004-09-30 Sold (Public Records) $27,500,000 Public Records
Property tax history
+3.3%/yrLatest (2025): $1,698 · -1.4% YoY. Source: county tax records.
Cash-flow waterfall
monthlySold comps — $/sqft
last 12 mo · ≤1 miLoading sold comps…