3902 Idleway · East Tawakoni, TX
Flood risk 1/10 · Minimal
- FEMA flood zone
- X (unshaded)
- Chance of flooding over 30 yrs
- 0.0%
- Est. flood insurance / yr
- $507 – $1,088
Fire risk 3/10 · Minor
- Est. fire insurance / yr
- $1,222 – $2,270
Heat risk 7/10 · Major
- Hot days now (above 110°F)
- 7 days/yr
- Hot days in 30 yrs
- 23 days/yr
Wind risk 6/10 · Moderate
- Chance of severe wind over 30 yrs
- 27.0%
Air-quality risk 2/10 · Minimal
- Unhealthy air days now
- 0 days/yr
- Unhealthy air days in 30 yrs
- 1 days/yr
Risk factors via First Street. Map © Google.
Why this score? — see what drove the B+ grade
The composite is a weighted blend of 9 inputs, each scored 0–100. Each bar is that input's sub-score; the figure is the points it added to the 100-point composite (weight × sub-score).
- Cash flow +30.0/30.0
- 1% rule +10.0/10.0
- DSCR +10.0/10.0
- Appreciation +10.0/10.0
- ARV discount +7.5/15.0
- Schools +3.7/10.0
- Livability +2.6/5.0
- Rent growth +2.5/5.0
- Condition / age +2.5/5.0
$64,504
🖨 Deal sheet 📄 Offer letter ✓ Due diligence
Listing remarks MLS
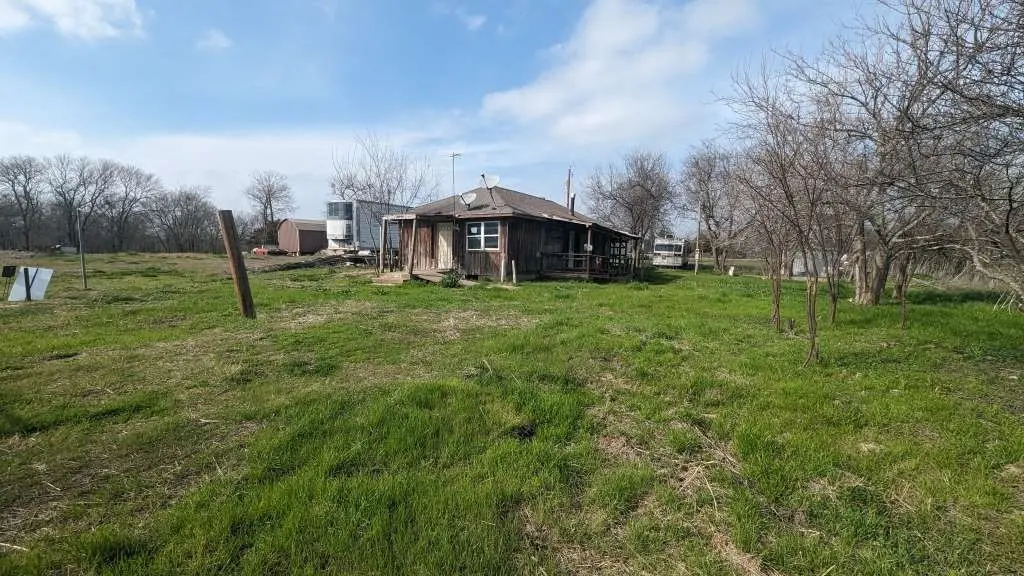
CLOSE TO THE LAKE! Situated just moments away from Lake Tawakoni in Texas, 3902 Idle Way offers a tranquil retreat with exciting potential. This three-bedroom, one-bathroom home, spanning 840 Sq. Ft., awaits a few fixes and renovations. While the property does require a bit of work, its optimal location and lakeside living make it a wonderful investment opportunity. The charming covered front porch also adds a welcoming touch, providing a perfect spot to unwind and enjoy the quiet surrounding atmosphere. With the right touches, this home invites you to create your dream haven in an even better setting. WE MAKE IT EASY TO OWN. This is a great opportunity! Don't wait, call us today to get more information on the owner's easy terms and smooth process that may be able to put the deed in your name and make this your dream getaway.
Key facts
- Covered front porch
- Close to the lake
- Lakeside living
Tags
Neighborhood map
What this means for you Summary
Snapshot
- This is a 3-bed/1.0-bath single-family listed at $65k.
Deal economics
- At list price, monthly cash flow is $759 ($9k/yr) — positive.
- The deal already cash-flows at list — no discount required.
- Meets the 1% rule at list price ($1k rent vs $65k).
- Recommended offer: $57k (12.0% below list) — sets the bar for market timing.
- Cap rate 20.4% vs local median 4.5% in East Tawakoni — top-decile yield for the area; either an underpriced asset or a hidden risk that comps aren't pricing in. Stress-test before assuming the spread holds.
Location & tenants
- Location reads 52/100 on livability (#1,455 in TX) — a working-class tenant base; expect higher turnover. Strengths: cost of living A+, housing A+; Watch: crime D, schools F, amenities F.
- Lone Oak ISD (rural): math 42% / reading 43% proficiency, ranked #310 of 826 in TX (top 38%) — families likely to look elsewhere, expect single-tenant / working-renter base with shorter leases.
- Market conditions: 115 active listings in the ZIP; 1,289 units permitted in Hunt County in 2024 (527 in 5+ unit buildings).
Forward outlook
- In year one you build about $7k of equity ($446 loan paydown + $6k appreciation (10.0% local appreciation)).
- Hunt County population projected at +15% by 2050 — modest demand growth; plan on rents tracking national, not racing it.
- At projected returns (10.0% appreciation + 3.0% rent growth), your $18k cash investment doubles in ~2 years — after that, you're playing with house money.
- By year 5, paydown + projected appreciation supports a ~$32k cash-out refi (75% LTV) — recoverable capital for the next deal without selling this one.
Negotiation context
- It's been on market 472 days — a 12% lower offer ($57k) is reasonable based on typical stale-listing flexibility.
Risks & watch-outs
- Climate carrying-cost: major wind risk, 27% chance of damaging wind over 30y; extreme-heat days projected 7→23/yr by 2055 (HVAC capex compounding) — expect insurance premiums to compound above CPI over the hold.
Questions for the listing agent
- It's been on market 472 days. Have you received any prior offers? Is the seller open to a 12% concession, seller financing, or rate buy-down credit?
- Why hasn't it sold? Are there any deal-killer items the seller is aware of (foundation, flood, title, zoning, code violations)?
- Is there a deadline driving the sale (1031 exchange, divorce, estate, relocation)? That informs how much negotiation room exists.
- Schools are F-rated, which usually means shorter tenancies and higher turnover. Who's the typical renter profile here, and what's been the actual vacancy rate?
- Crime grade is D in this area — have there been break-ins, vandalism, or insurance claims at this property in the last 3 years? What carrier currently insures it and at what premium?
- What's the average days-on-market for RENTAL listings here right now (not sales)? A rising rental-DOM trend means longer vacancies and softer asking-rent achievability than the comps imply.
- What's the recent tenant-quality profile in this submarket — average credit score on applications, eviction rate, late-payment / NSF rate, and stable-employment percentage? A property-management company in the area should have these aggregated.
- How much new for-sale + rental construction is in the pipeline within 1–3 miles? Heavy new supply typically softens prices + rents 12–24 months out; constrained supply supports both.
Investment metrics
- 1% rule
- 2.29% ✓
- Cap rate
- 20.42%
- Cash-on-cash
- 50.46%
- DSCR
- 3.25
- GRM
- 3.6
CMA / ARV
- ARV (median comp)
- $133,992
- List price
- $64,504
- Delta
- -51.86%
- Verdict
- UNDERPRICED
- Comps
- 2 within 1.0 mi
Projected returns pro-forma
10.0% appreciation · 3.0% rent growth · sell at horizon
- IRR
- 64.0%
- Equity multiple
- 5.62×
- Total profit
- $83,501
- Equity at exit
- $58,110
- IRR
- 57.6%
- Equity multiple
- 12.51×
- Total profit
- $207,855
- Equity at exit
- $125,317
Cash invested: $18,061 (down + closing). Projections, not guarantees.
Landlord ↔ Tenant lean methodology
- Overall (STATE)
- 87 Strongly Landlord-Friendly
- State Texas
- 87 Strongly Landlord-Friendly · R+5
- County
- — inherits STATE
- City
- — inherits STATE
ZIP-level market 75453
- Home prices YoY
- 25.2%
- Active inventory
- 115
- Price-to-rent
- 3.6×
Monthly cashflow live
- Estimated rent
- $1,477 medium interval (Pro) →
- Mortgage (P&I)
- −$338
- Tax from tax record
- −$42 /mo · $509/yr
- Insurance
- −$27
- HOA
- −$0
- Vacancy / Maint / Mgmt
- −$310
- Net cashflow
- $759
Break-even live
UW: 25.0% down · 7.5% · 30yr · 1.5% tax · 5.0% vac · 8.0% maint · 8.0% mgmt
Financing live
Cash to close
- Down payment
- $16,126
- Closing costs
- $1,935
- Reserves months
- —
- Total cash needed
- —
Loan-product check · same deal, 3 products live
Conventional
25% down · 7.5% · 30yr
- Down + closing
- —
- Monthly P&I
- —
- Monthly cashflow
- —
- DSCR
- —
- Eligible?
- —
Personal DTI + credit; lowest rate.
DSCR
20% down · 8.5% · 30yr
- Down + closing
- —
- Monthly P&I
- —
- Monthly cashflow
- —
- DSCR
- —
- Eligible?
- —
No personal income docs; deal must DSCR.
Hard money
10% down · 12.0% · 12mo
- Down + closing
- —
- Monthly P&I
- —
- Monthly cashflow
- —
- DSCR
- —
- Eligible?
- —
Short-term bridge; refi at stabilization.
Listing history 14 events
-
2026-06-18days on market $64,504 Active 472 DOM
-
2026-06-17days on market $64,504 Active 471 DOM
-
2026-06-16days on market $64,504 Active 470 DOM
-
2026-06-15days on market $64,504 Active 469 DOM
-
2026-06-13days on market $64,504 Active 467 DOM
-
2026-06-09days on market $64,504 Active 463 DOM
-
2026-06-08days on market $64,504 Active 462 DOM
-
2026-06-07days on market $64,504 Active 461 DOM
-
2026-06-04days on market $64,504 Active 458 DOM
-
2026-06-03days on market $64,504 Active 457 DOM
-
2026-06-02days on market $64,504 Active 456 DOM
-
2026-06-01days on market $64,504 Active 455 DOM
-
2026-05-31days on market $64,504 Active 454 DOM
-
2025-03-03$64,504 Active 837-char remark
Show marketing remark (837 chars)
CLOSE TO THE LAKE! Situated just moments away from Lake Tawakoni in Texas, 3902 Idle Way offers a tranquil retreat with exciting potential. This three-bedroom, one-bathroom home, spanning 840 Sq. Ft., awaits a few fixes and renovations. While the property does require a bit of work, its optimal location and lakeside living make it a wonderful investment opportunity. The charming covered front porch also adds a welcoming touch, providing a perfect spot to unwind and enjoy the quiet surrounding atmosphere. With the right touches, this home invites you to create your dream haven in an even better setting. WE MAKE IT EASY TO OWN. This is a great opportunity! Don't wait, call us today to get more information on the owner's easy terms and smooth process that may be able to put the deed in your name and make this your dream getaway.
ⓘ Source: listings_history table (triggers on properties + properties_extension) + one-shot
backfill from property_details.listing_events for pre-trigger history.
Tax reassessment forecast TX · Resets to sale price
- Current annual tax
- $509 · $42/mo
- Projected year-2 tax
- $1,180 · $98/mo
- Expected delta
- +$671/yr (+$56/mo · 131.8%)
ⓘ Screening estimate from a state-policy table — verify with the county assessor before closing.
Climate risk First Street
- Flood 1/10 Low FEMA zone X (unshaded) · 0% chance over 30 yrs
- Wildfire 3/10 Moderate
- Heat 7/10 Severe 7 d/yr ≥110°F today · 23 d/yr by 30 yrs out
- Wind 6/10 Major 27% chance of damaging wind over 30 yrs
- Air quality 2/10 Low 0 unhealthy d/yr today · 1 by 30 yrs out
Nearby sold comps map
Loading sold comps map…
Walkable amenities ~0.75 mi
Loading nearby amenities…
Taxation est. · year 1
- Rental income
- $17,727
- − Mortgage interest
- −$3,613
- − Property taxes
- −$509
- − Insurance
- −$323
- − Repairs & maintenance
- −$1,418
- − Management
- −$1,418
- − Depreciation
- −$1,876
- Taxable income
- $8,570
- Est. tax owed @ 24.0%
- −$2,057
- After-tax cash flow
- $7,057/yr
For passive investors: Depreciation is non-cash, so a rental often shows a tax loss while cash-flowing — sheltering income. Rental losses are passive: they offset passive income freely, and up to $25,000/yr can offset ordinary (W-2) income if you actively participate and your MAGI is under $100k (phasing out to $0 by $150k); unused losses carry forward. On sale, claimed depreciation is recaptured at up to 25%, and gains may owe capital-gains tax (a 1031 exchange can defer both). Figures are a year-1 estimate at your 24.0% rate — not tax advice; consult a CPA.
Schools (NCES district)
- District
- Lone Oak ISD
- NCES district ID
- 4828020
- Math proficiency
- 42% ▼ -9.00%
- Reading proficiency
- 43% ▼ -7.00%
- Median HH income
- $51,628
- Composite
- 36.72/100
- National rank
- #4593
- State rank
- #310 of 826 in TX
Livability — East Tawakoni
- Score
- 52/100
- State rank
- #1455
- US rank
- #24873
Category grades
Schools grade is shown separately in the Schools card above.
Census & demographics
- Population (ZIP)
- 2,832
Population outlook (Hunt County) Hauer SSP2
- Today (2025)
- 97,090 people
- By 2030
- 100,452 · +3.5%
- By 2040
- 106,544 · +9.7%
- By 2050
- 111,218 · +14.6%
- By 2075
- 121,695 · +25.3%
- By 2100
- 123,683 · +27.4%
Race, ethnicity, and origin ACS 2023
- Neighborhood character
- Predominantly White (73%)
- Race & ethnicity
- White 73% Hispanic / Latino 17% Two or more races 7% Black 1%
- Hispanic origin (detail)
- Mexican 15%
- Common ancestry
- Italian 2% Portuguese 1% Romanian 1%
- Foreign-born
- 7% · Canada
- Languages at home
- 93% English-only · Spanish 6% Other Asian/Pacific 1%
Political lean MEDSL · Hunt
- 2024 margin
- Solid R (+55.5) · D 21.9% · R 77.4%
- 2008→2024 swing
- -14.9pp toward R · 2008: -40.6pp · 2024: -55.5pp
- All cycles
- 2024: R+55.5 2020: R+52.5 2016: R+56.3 2012: R+51.2 2008: R+40.6
Not yet ingested
- Civics
- —
Market trends
- HPI YoY
- ▲ 51.45%
- Current HPI
- 255.6167
- Rent YoY
- —
- Metro
- —
- State GDP YoY
- ▲ 3.95%
- F500 in state
- 110
Industry mix (Fortune 500 HQ in TX)
| Industry | F500 HQs | Revenue |
|---|---|---|
| Energy | 16 | $1,198B |
|
||
| Technology | 5 | $198B |
|
||
| Engineering / Construction | 4 | $72B |
|
||
| Energy Services | 3 | $60B |
|
||
| Utilities | 3 | $41B |
|
||
| Healthcare | 2 | $330B |
|
||
Price history
1 event — show timeline
- 2025-03-03 Listed $64,504 HARMLS
Property tax history
+3.6%/yrLatest (2025): $509 · -35.5% YoY. Source: county tax records.
Cash-flow waterfall
monthlySold comps — $/sqft
last 12 mo · ≤1 miLoading sold comps…