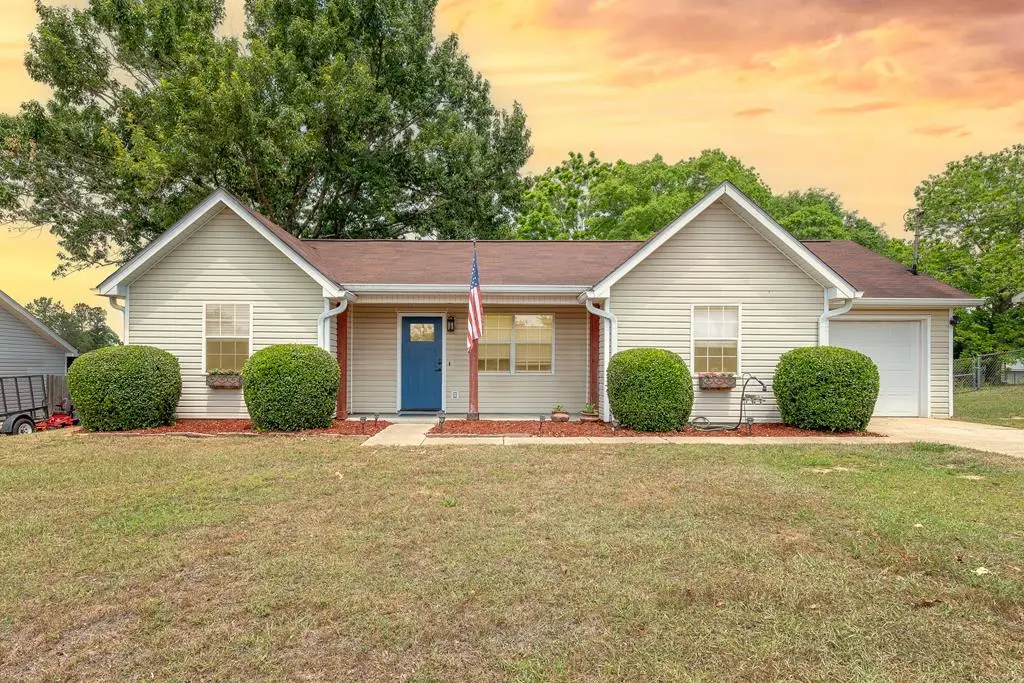
208 Petunia Dr · Taylor, AL
Flood risk 1/10 · Minimal
- FEMA flood zone
- X (unshaded)
- Chance of flooding over 30 yrs
- 0.0%
- Est. flood insurance / yr
- $507 – $1,088
Fire risk 4/10 · Minor
- Est. fire insurance / yr
- $916 – $1,700
Heat risk 8/10 · Major
- Hot days now (above 107°F)
- 7 days/yr
- Hot days in 30 yrs
- 19 days/yr
Wind risk 8/10 · Major
- Chance of severe wind over 30 yrs
- 99.0%
Air-quality risk 3/10 · Minor
- Unhealthy air days now
- 3 days/yr
- Unhealthy air days in 30 yrs
- 5 days/yr
Risk factors via First Street. Map © Google.
Why this score? — see what drove the D- grade
The composite is a weighted blend of 9 inputs, each scored 0–100. Each bar is that input's sub-score; the figure is the points it added to the 100-point composite (weight × sub-score).
- Cash flow +13.0/30.0
- ARV discount +5.6/15.0
- DSCR +3.9/10.0
- Livability +3.2/5.0
- Schools +3.1/10.0
- Rent growth +2.5/5.0
- Condition / age +2.5/5.0
- 1% rule +2.4/10.0
- Appreciation +0.0/10.0
$184,000
🖨 Deal sheet (PDF) 📄 Offer letter ✓ Due diligence
Listing remarks
3 bedroom 2 bath single family home. The backyard is fenced, has a storage shed, and a large wooden deck. The home also has an insulated single car garage with a mini-split heat and AC unit in the garage. Minutes from shopping and dining on the west side of Dothan.
Key facts
- Large wooden deck
- Backyard fenced
- Storage shed
Tags
Property features AI
Exterior
- Parking: 1 total parking space; 1 covered parking space; 1-car garage
- Security: Smoke detector(s)
- Utilities: Public water; Public sewer
- Home design: Single-family residence; One level
- Construction: Vinyl siding
- Exterior features: Deck; Covered porch; On waterfront; Storage structure
Interior
- Kitchen: Dishwasher; Microwave; Range; Refrigerator
- Flooring: Carpet; Laminate
- Bathrooms: 2 full bathrooms
- Interior features: Pantry; Ceiling fan(s); Walk-in closet(s); Eat-in kitchen; Double-pane windows; Smoke detector(s)
- Laundry & utility: Laundry located inside
Neighborhood map
What this means for you Summary
Snapshot
- This is a 3-bed/2.0-bath single-family listed at $184k.
Deal economics
- At list price, monthly cash flow is $-11 ($-134/yr) — negative.
- To cash-flow at today's rent, offer at most $182k (1.1% below list).
- To meet the 1% rule (rent ≥ 1% of price), the offer needs to be $136k (26.2% below list).
- Recommended offer: $136k (26.2% below list) — sets the bar for 1% rule.
Location & tenants
- Location reads 65/100 on livability (#123 in AL) — a middle-class / working-renter tenant base. Strengths: crime A+, cost of living A+, housing A+; Watch: employment D, health & safety D, amenities F.
- Houston County (rural): math 25% / reading 49% proficiency, ranked #38 of 129 in AL (top 30%) — families likely to look elsewhere, expect single-tenant / working-renter base with shorter leases.
- Zoned schools: Rehobeth Elementary School (math 51% / reading 69%, grade B-, #61 of 627 statewide, top 10%, 1,174 students, 58% FRL); Rehobeth Middle School (math 22% / reading 54%, grade F, #69 of 257 statewide, top 27%, 626 students, 58% FRL); Rehobeth High School (math 32% / reading 27%, grade F, #70 of 305 statewide, top 27%, 788 students, 52% FRL) — zoned schools at 56% FRL track the district average.
- Market conditions: 412 active listings in the ZIP; 463 units permitted in Houston County in 2024 (96 in 5+ unit buildings).
Forward outlook
- Local home prices are declining (-3.0%/yr); year-one equity from $1k of loan paydown is wiped out by about $6k of value loss. Plan a longer hold.
- Houston County population projected at +7% by 2050 — modest demand growth; plan on rents tracking national, not racing it.
Negotiation context
- Only 5 days on market — expect competitive offers; lowballing is unlikely to land.
Risks & watch-outs
- Climate carrying-cost: severe wind risk, 99% chance of damaging wind over 30y; extreme-heat days projected 7→19/yr by 2055 (HVAC capex compounding) — expect insurance premiums to compound above CPI over the hold.
Questions for the listing agent
- What do current leases actually rent for vs. the listed asking? Can we see a recent rent roll and the last 12 months of T-12 income?
- Is there a deadline driving the sale (1031 exchange, divorce, estate, relocation)? That informs how much negotiation room exists.
- Schools are F-rated, which usually means shorter tenancies and higher turnover. Who's the typical renter profile here, and what's been the actual vacancy rate?
- The area grade is low — what's the realistic commute time and amenity access for the typical tenant pool here? Any planned neighborhood developments (good or bad) we should know about?
- What's the average days-on-market for RENTAL listings here right now (not sales)? A rising rental-DOM trend means longer vacancies and softer asking-rent achievability than the comps imply.
- What's the recent tenant-quality profile in this submarket — average credit score on applications, eviction rate, late-payment / NSF rate, and stable-employment percentage? A property-management company in the area should have these aggregated.
- How much new for-sale + rental construction is in the pipeline within 1–3 miles? Heavy new supply typically softens prices + rents 12–24 months out; constrained supply supports both.
Investment metrics
- 1% rule
- 0.74% ✗
- Cap rate
- 6.22%
- Cash-on-cash
- -0.26%
- DSCR
- 0.99
- GRM
- 11.3
CMA / ARV
- ARV (median comp)
- $176,654
- List price
- $184,000
- Delta
- 4.16%
- Verdict
- FAIR
- Comps
- 20 within 1.0 mi
Show comp detail 12 sales within ~0.75 mi
| Address | Dist | Beds/Ba | Sqft | Sold | Price | $/sf | Match |
|---|---|---|---|---|---|---|---|
| 216 Petunia Dr | 0.06mi | 3/2.0 | 1,259 (+1%) | 6mo | $159,000 | $126 | 90 |
| 307 Caladium Rd | 0.16mi | 3/2.0 | 1,225 (-1%) | 6mo | $182,000 | $149 | 85 |
| 215 Landview Dr | 0.06mi | 3/2.0 | 1,304 (+5%) | 5mo | $195,000 | $150 | 85 |
| 205 Petunia | 0.04mi | 4/2.0 (+1) | 1,320 (+6%) | 2mo | $190,000 | $144 | 81 |
| 202 Begonia Dr | 0.08mi | 3/2.0 | 1,297 (+4%) | 17mo | $183,000 | $141 | 75 |
| 823 Landview | 0.20mi | 4/2.0 (+1) | 1,350 (+9%) | 2mo | $147,000 | $109 | 69 |
| 101 Caladium Rd | 0.10mi | 2/2.0 (-1) | 1,325 (+7%) | 13mo | $137,500 | $104 | 68 |
| 211 Landview Dr | 0.04mi | 3/2.0 | 1,419 (+14%) | 13mo | $170,000 | $120 | 64 |
| 102 Holiday | 0.75mi | 3/2.0 | 1,304 (+5%) | 1mo | $130,000 | $100 | 56 |
| 5924 Henry Mouring Rd | 0.54mi | 3/1.5 | 1,375 (+11%) | 1mo | $190,000 | $138 | 54 |
| 100 Periwinkle Ct | 0.72mi | 3/2.0 | 1,204 (-3%) | 11mo | $173,500 | $144 | 52 |
| 105 Periwinkle Ct | 0.68mi | 3/2.0 | 1,427 (+15%) | 2mo | $183,800 | $129 | 42 |
Match score weights: distance 35% · size 25% · config 20% · recency 20%. Top-matched comps best support the ARV.
Projected returns pro-forma
-3.0% appreciation · 3.0% rent growth · sell at horizon
- IRR
- -16.8%
- Equity multiple
- 0.41×
- Total profit
- $-30,621
- Equity at exit
- $27,435
- IRR
- -8.8%
- Equity multiple
- 0.46×
- Total profit
- $-27,964
- Equity at exit
- $15,909
Cash invested: $51,520 (down + closing). Projections, not guarantees.
Landlord ↔ Tenant lean methodology
- Overall (STATE)
- 90 Strongly Landlord-Friendly
- State Alabama
- 90 Strongly Landlord-Friendly · R+15
- County
- — inherits STATE
- City
- — inherits STATE
ZIP-level market 36301
- Home prices YoY
- -24.9%
- Active inventory
- 412
- Price-to-rent
- 11.3×
Monthly cashflow live
- Estimated rent
- $1,357 medium interval (Pro) →
- Mortgage (P&I)
- −$965
- Tax from tax record
- −$42 /mo · $503/yr
- Insurance
- −$77
- HOA
- −$0
- Vacancy / Maint / Mgmt
- −$285
- Net cashflow
- $-11
Break-even live
Sensitivity live
| Price | -10% $93 | -5% $41 | +0% $-11 | +5% $-63 | +10% $-115 |
|---|---|---|---|---|---|
| Rent | -10% $-118 | -5% $-65 | +0% $-11 | +5% $42 | +10% $96 |
| Rate | -1.0pp $82 | -0.5pp $36 | base $-11 | +0.5pp $-59 | +1.0pp $-107 |
UW: 25.0% down · 7.5% · 30yr · 1.5% tax · 5.0% vac · 8.0% maint · 8.0% mgmt
Financing live
Cash to close
- Down payment
- $46,000
- Closing costs
- $5,520
- Reserves months
- —
- Total cash needed
- —
Loan-product check · same deal, 3 products live
Conventional
25% down · 7.5% · 30yr
- Down + closing
- —
- Monthly P&I
- —
- Monthly cashflow
- —
- DSCR
- —
- Eligible?
- —
Personal DTI + credit; lowest rate.
DSCR
20% down · 8.5% · 30yr
- Down + closing
- —
- Monthly P&I
- —
- Monthly cashflow
- —
- DSCR
- —
- Eligible?
- —
No personal income docs; deal must DSCR.
Hard money
10% down · 12.0% · 12mo
- Down + closing
- —
- Monthly P&I
- —
- Monthly cashflow
- —
- DSCR
- —
- Eligible?
- —
Short-term bridge; refi at stabilization.
Listing history 2 events
-
2026-05-07status Pending 265-char remark
-
2026-05-01$184,000 Active 265-char remark
ⓘ Source: listings_history table (triggers on properties + properties_extension) + one-shot
backfill from property_details.listing_events for pre-trigger history.
Tax reassessment forecast AL · Resets to sale price
- Current annual tax
- $503 · $42/mo
- Projected year-2 tax
- $754 · $63/mo
- Expected delta
- +$251/yr (+$21/mo · 49.8%)
ⓘ Screening estimate from a state-policy table — verify with the county assessor before closing.
Climate risk First Street
- Flood 1/10 Low FEMA zone X (unshaded) · 0% chance over 30 yrs
- Wildfire 4/10 Moderate
- Heat 8/10 Severe 7 d/yr ≥107°F today · 19 d/yr by 30 yrs out
- Wind 8/10 Severe 99% chance of damaging wind over 30 yrs
- Air quality 3/10 Moderate 3 unhealthy d/yr today · 5 by 30 yrs out
Nearby sold comps map
Loading sold comps map…
Walkable amenities ~0.75 mi
Loading nearby amenities…
Taxation est. · year 1
- Rental income
- $16,290
- − Mortgage interest
- −$10,307
- − Property taxes
- −$503
- − Insurance
- −$920
- − Repairs & maintenance
- −$1,303
- − Management
- −$1,303
- − Depreciation
- −$5,353
- Taxable loss
- −$3,400
- Est. tax savings @ 24.0%
- +$816
- After-tax cash flow
- $682/yr
For passive investors: Depreciation is non-cash, so a rental often shows a tax loss while cash-flowing — sheltering income. Rental losses are passive: they offset passive income freely, and up to $25,000/yr can offset ordinary (W-2) income if you actively participate and your MAGI is under $100k (phasing out to $0 by $150k); unused losses carry forward. On sale, claimed depreciation is recaptured at up to 25%, and gains may owe capital-gains tax (a 1031 exchange can defer both). Figures are a year-1 estimate at your 24.0% rate — not tax advice; consult a CPA.
Schools (NCES district)
- District
- Houston County
- NCES district ID
- 0101770
- Math proficiency
- 25% ▼ -33.00%
- Reading proficiency
- 49% ▼ -1.00%
- Median HH income
- $40,530
- Composite
- 31.01/100
- National rank
- #6092
- State rank
- #38 of 129 in AL
Livability — Taylor
- Score
- 65/100
- State rank
- #123
- US rank
- #12760
Category grades
Schools grade is shown separately in the Schools card above.
Census & demographics
- Census place
- Taylor, AL
- Population (ZIP)
- 38,627
Population outlook (Houston County) Hauer SSP2
- Today (2025)
- 110,280 people
- By 2030
- 112,668 · +2.2%
- By 2040
- 116,149 · +5.3%
- By 2050
- 117,805 · +6.8%
- By 2075
- 118,577 · +7.5%
- By 2100
- 110,940 · +0.6%
Race, ethnicity, and origin ACS 2023
- Neighborhood character
- Diverse neighborhood (Simpson 0.55)
- Race & ethnicity
- White 59% Black 31% Hispanic / Latino 5% Two or more races 5%
- Hispanic origin (detail)
- Mexican 3%
- Common ancestry
- Slovak 1% Italian 1% Lithuanian 1%
- Foreign-born
- 3% · Canada
- Languages at home
- 95% English-only · Spanish 4%
Political lean MEDSL · Houston
- 2024 margin
- Solid R (+47.8) · D 25.7% · R 73.5%
- 2008→2024 swing
- -7.0pp toward R · 2008: -40.8pp · 2024: -47.8pp
- All cycles
- 2024: R+47.8 2020: R+42.7 2016: R+47.6 2012: R+40.3 2008: R+40.8
Not yet ingested
- Civics
- —
Market trends
- HPI YoY
- ▼ -53.46%
- Current HPI
- 161.1212
- Rent YoY
- —
- Metro
- —
- State GDP YoY
- ▲ 2.94%
- F500 in state
- 4
Industry mix (Fortune 500 HQ in AL)
| Industry | F500 HQs | Revenue |
|---|---|---|
| Financial Services | 1 | $8B |
|
||
| Healthcare | 1 | $5B |
|
||
Price history
+2.7% since first listed3 events — show timeline
- 2026-06-16 Sold (MLS) $189,000 SAMLS
- 2026-05-07 Pending — SAMLS
- 2026-05-01 Listed $184,000 SAMLS
Property tax history
+4.2%/yrLatest (2025): $503 · +2.3% YoY. Source: county tax records.
Cash-flow waterfall
monthlySold comps — $/sqft
last 12 mo · ≤1 miLoading sold comps…