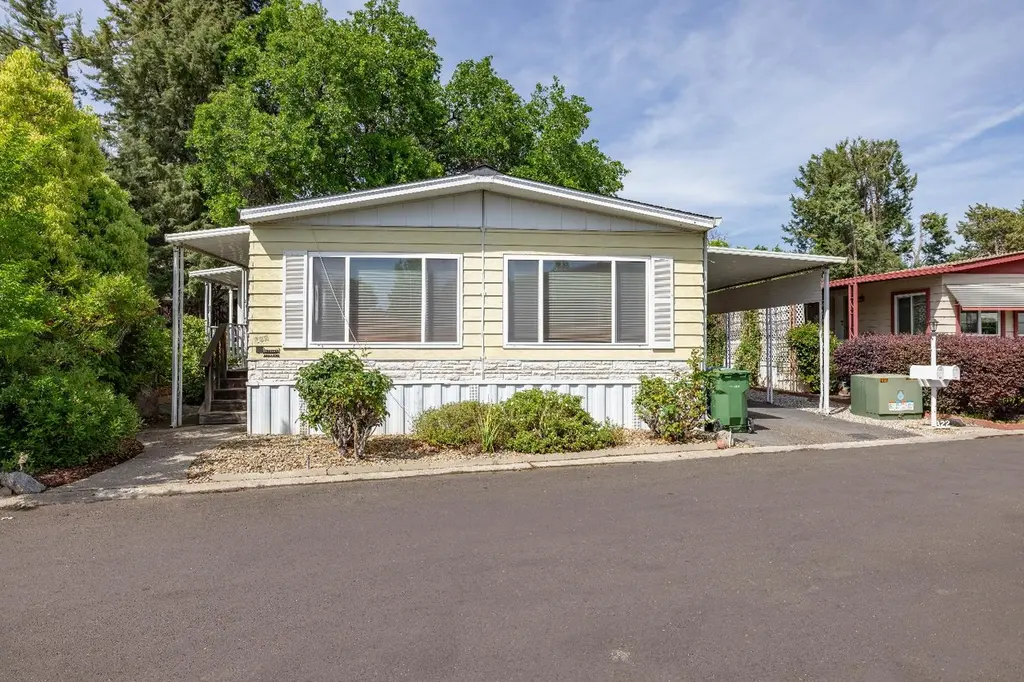
322 Bluebird Ln · Folsom, CA
Flood risk 5/10 · Moderate
- FEMA flood zone
- X (unshaded)
- Chance of flooding over 30 yrs
- 0.24%
- Est. flood insurance / yr
- $507 – $1,088
Fire risk 3/10 · Minor
- Est. fire insurance / yr
- $659 – $1,223
Heat risk 7/10 · Major
- Hot days now (above 103°F)
- 7 days/yr
- Hot days in 30 yrs
- 16 days/yr
Wind risk 1/10 · Minimal
- Chance of severe wind over 30 yrs
- —
Air-quality risk 10/10 · Severe
- Unhealthy air days now
- 30 days/yr
- Unhealthy air days in 30 yrs
- 38 days/yr
Risk factors via First Street. Map © Google.
Why this score? — see what drove the C+ grade
The composite is a weighted blend of 9 inputs, each scored 0–100. Each bar is that input's sub-score; the figure is the points it added to the 100-point composite (weight × sub-score).
- Cash flow +30.0/30.0
- 1% rule +10.0/10.0
- DSCR +10.0/10.0
- Livability +3.6/5.0
- Rent growth +2.9/5.0
- Condition / age +2.5/5.0
- Schools +2.4/10.0
- ARV discount +1.1/15.0
- Appreciation +0.0/10.0
$160,000
🖨 Deal sheet 📄 Offer letter ✓ Due diligence
Listing remarks
THIS ONE WONT LAST LONG!!WHOLE NEW LOOK COMING SOON! VERY OPEN FLOOR PLAN. . NEW ROOF!! NEW HOT WATER HEATER!! NEW CARPET BEING INSTALLED JULY 13!! REMAINING FURNITURE IS BEING REMOVED JUNE 23RD. . LIGHT AND CHEERY INSIDE. .EXTRA SITTING ROOM ON SIDE OF HOME, COULD BE USED AS A BEDROOM OR JUST TO RELAX . .GREAT SURROUNDINGS, BEAUTIFUL TREES. .THE PARK IS CLOSE TO OLD TOWN FOLSOM, AND GREAT SHOPPING. CLOSE TO LAKE FOLSOM. .. GREAT NEIGHBORS WITH LOTS OF ACTIVITIES IN THE PARK!!HOME HAS JUST BEEN PROFESSIONALLY CLEANED. MUST SEE TO APPRECIATE. .. PARK APPLICATION AND PARK RULES ARE ATTACHED TO LISTING. .. .
Key facts
- Open floor plan
- Extra sitting room
- New roof
Tags
Neighborhood map
What this means for you Summary
Snapshot
- This is a 2-bed/1.5-bath manufactured listed at $160k.
Deal economics
- At list price, monthly cash flow is $903 ($11k/yr) — positive.
- The deal already cash-flows at list — no discount required.
- Meets the 1% rule at list price ($3k rent vs $160k).
- Recommended offer: $150k (6.0% below list) — sets the bar for market timing.
- Cap rate 13.1% vs local median 2.5% in Folsom — top-decile yield for the area; either an underpriced asset or a hidden risk that comps aren't pricing in. Stress-test before assuming the spread holds.
Location & tenants
- Location reads 72/100 on livability (#190 in CA) — a middle-class / working-renter tenant base. Strengths: employment A+, housing A+, schools A; Watch: amenities D, commute F, cost of living F.
- Folsom-Cordova Unified (urban): math 25% / reading 25% proficiency, ranked #365 of 517 in CA (top 71%) — low school quality limits family demand, transient renter base, plan for 1-2y turnover.
- Market conditions: Rents rising (+1.7%/yr); 422 active listings in the ZIP; 5 comparable units currently listed for rent nearby; rentals leasing fast (median 8d on market — plan ~1-2 weeks tenant-placement turnaround); 40% of comp listings sitting > 30 days — soft ceiling on asking rent; high-income renter base; 6,825 units permitted in Sacramento County in 2024 (1,752 in 5+ unit buildings).
Forward outlook
- Local home prices are declining (-3.0%/yr); year-one equity from $1k of loan paydown is wiped out by about $5k of value loss. Plan a longer hold.
- Sacramento County population projected at +17% by 2050 — long-run rental-demand tailwind backs the buy-and-hold thesis.
- At projected returns (-3.0% appreciation + 1.7% rent growth), your $45k cash investment doubles in ~6 years — after that, you're playing with house money.
Negotiation context
- It's been on market 81 days — a 6% lower offer ($150k) is reasonable based on typical stale-listing flexibility.
Risks & watch-outs
- Climate carrying-cost: moderate flood risk; extreme-heat days projected 7→16/yr by 2055 (HVAC capex compounding) — expect insurance premiums to compound above CPI over the hold.
Questions for the listing agent
- It's been on market 81 days. Have you received any prior offers? Is the seller open to a 6% concession, seller financing, or rate buy-down credit?
- Built in 1977 — when were the roof, HVAC, electrical panel, plumbing, and water heater last replaced?
- Why hasn't it sold? Are there any deal-killer items the seller is aware of (foundation, flood, title, zoning, code violations)?
- Is there a deadline driving the sale (1031 exchange, divorce, estate, relocation)? That informs how much negotiation room exists.
- Schools are A-rated — typically a magnet for longer-tenancy family renters. What's the average tenant stay here, and is there a school-zone premium baked into asking?
- What's the average days-on-market for RENTAL listings here right now (not sales)? A rising rental-DOM trend means longer vacancies and softer asking-rent achievability than the comps imply.
- What's the recent tenant-quality profile in this submarket — average credit score on applications, eviction rate, late-payment / NSF rate, and stable-employment percentage? A property-management company in the area should have these aggregated.
- How much new for-sale + rental construction is in the pipeline within 1–3 miles? Heavy new supply typically softens prices + rents 12–24 months out; constrained supply supports both.
Investment metrics
- 1% rule
- 1.59% ✓
- Cap rate
- 13.07%
- Cash-on-cash
- 24.20%
- DSCR
- 2.08
- GRM
- 5.2
CMA / ARV
- ARV (median comp)
- $140,017
- List price
- $160,000
- Delta
- 14.27%
- Verdict
- OVERPRICED
- Comps
- 20 within 1.0 mi
Show comp detail 12 sales within ~0.75 mi
| Address | Dist | Beds/Ba | Sqft | Sold | Price | $/sf | Match |
|---|---|---|---|---|---|---|---|
| 347 Danielle Way | 0.19mi | 2/2.0 | 1,248 (0%) | 2mo | $138,000 | $111 | 87 |
| 76 Redwood Ln | 0.11mi | 2/2.0 | 1,200 (-4%) | 2mo | $92,000 | $77 | 85 |
| 245 Lark Ln | 0.03mi | 2/2.0 | 1,200 (-4%) | 8mo | $134,500 | $112 | 83 |
| 46 Cedar Cir | 0.12mi | 2/2.0 | 1,220 (-2%) | 7mo | $70,000 | $57 | 82 |
| 33 Allan Ct | 0.19mi | 2/2.0 | 1,248 (0%) | 9mo | $175,000 | $140 | 82 |
| 246 Danielle Way | 0.12mi | 2/2.0 | 1,162 (-7%) | 1mo | $190,000 | $164 | 80 |
| 244 Raymond Ln | 0.22mi | 2/2.0 | 1,272 (+2%) | 9mo | $130,000 | $102 | 77 |
| 155 Leafwood Way | 0.49mi | 2/2.0 | 1,248 (0%) | 1mo | $185,000 | $148 | 74 |
| 294 Danielle Way | 0.13mi | 2/2.0 | 1,344 (+8%) | 8mo | $200,000 | $149 | 72 |
| 52 Cedar Cir | 0.12mi | 2/2.0 | 1,392 (+12%) | 9mo | $170,000 | $122 | 66 |
| 136 Pinebrook Dr | 0.60mi | 2/2.0 | 1,260 (+1%) | 9mo | $270,000 | $214 | 61 |
| 276 Meadowrock Way | 0.66mi | 2/2.0 | 1,344 (+8%) | 1mo | $180,000 | $134 | 53 |
Match score weights: distance 35% · size 25% · config 20% · recency 20%. Top-matched comps best support the ARV.
Projected returns pro-forma
-3.0% appreciation · 1.72% rent growth · sell at horizon
- IRR
- 16.0%
- Equity multiple
- 1.63×
- Total profit
- $28,408
- Equity at exit
- $23,857
- IRR
- 23.7%
- Equity multiple
- 2.92×
- Total profit
- $86,040
- Equity at exit
- $13,834
Cash invested: $44,800 (down + closing). Projections, not guarantees.
Landlord ↔ Tenant lean methodology
- Overall (STATE)
- 18 Strongly Tenant-Friendly
- State California
- 18 Strongly Tenant-Friendly · D+13
- County
- — inherits STATE
- City
- — inherits STATE
ZIP-level market 95630
- Rents YoY
- 1.7%
- Active inventory
- 422
- Price-to-rent
- 5.2×
Monthly cashflow live
- Estimated rent
- $2,543 high interval (Pro) →
- Mortgage (P&I)
- −$839
- Tax est. 1.5%
- −$200 /mo · $2,400/yr
- Insurance
- −$67
- HOA
- −$0
- Vacancy / Maint / Mgmt
- −$534
- Net cashflow
- $903
Break-even live
UW: 25.0% down · 7.5% · 30yr · 1.5% tax · 5.0% vac · 8.0% maint · 8.0% mgmt
Financing live
Cash to close
- Down payment
- $40,000
- Closing costs
- $4,800
- Reserves months
- —
- Total cash needed
- —
Loan-product check · same deal, 3 products live
Conventional
25% down · 7.5% · 30yr
- Down + closing
- —
- Monthly P&I
- —
- Monthly cashflow
- —
- DSCR
- —
- Eligible?
- —
Personal DTI + credit; lowest rate.
DSCR
20% down · 8.5% · 30yr
- Down + closing
- —
- Monthly P&I
- —
- Monthly cashflow
- —
- DSCR
- —
- Eligible?
- —
No personal income docs; deal must DSCR.
Hard money
10% down · 12.0% · 12mo
- Down + closing
- —
- Monthly P&I
- —
- Monthly cashflow
- —
- DSCR
- —
- Eligible?
- —
Short-term bridge; refi at stabilization.
Rent comps 5 comps
| Address | Beds | Baths | Sqft | Rent | $/sqft | DOM | Units | Dist |
|---|---|---|---|---|---|---|---|---|
| 340 Caples Dr Folsom, CA | 3.0 | 2.5 | 1423 | $2,795 | $1.96 | 7d | 1 | 0.95mi |
| 109 N Grant Ln Folsom, CA | 2.0 | 2.0 | 1413 | $2,595 | $1.84 | 43d | 1 | 1.00mi |
| 288 Marsalla Dr Folsom, CA | 3.0 | 2.0 | 1130 | $2,495 | $2.21 | 43d | 1 | 1.03mi |
| 1600 Canyon Terrace Ln Folsom, CA | 1.0–3.0 | 1.0–2.0 | 955 | $2,348 | $2.46 | 1d | 18 | 1.10mi |
| 1000 Folsom Ranch Dr Folsom, CA | 1.0–2.0 | 1.0–2.0 | 830 | $2,399 | $2.89 | 1d | 18 | 1.26mi |
Listing history 15 events
-
2026-06-18days on market $160,000 Active 81 DOM
-
2026-06-17days on market $160,000 Active 80 DOM
-
2026-06-16days on market $160,000 Active 79 DOM
-
2026-06-15remarks 612-char remark
-
2026-06-15days on market $160,000 Active 78 DOM
-
2026-06-13days on market $160,000 Active 76 DOM
-
2026-06-13days on market $160,000 Active 75 DOM
-
2026-06-09days on market $160,000 Active 72 DOM
-
2026-06-08days on market $160,000 Active 71 DOM
-
2026-06-07days on market $160,000 Active 70 DOM
-
2026-06-05days on market $160,000 Active 67 DOM
-
2026-06-03days on market $160,000 Active 66 DOM
-
2026-06-02days on market $160,000 Active 65 DOM
-
2026-06-01days on market $160,000 Active 64 DOM
-
2026-05-31days on market $160,000 Active 63 DOM
ⓘ Source: listings_history table (triggers on properties + properties_extension) + one-shot
backfill from property_details.listing_events for pre-trigger history.
Climate risk First Street
- Flood 5/10 Major FEMA zone X (unshaded) · 24% chance over 30 yrs
- Wildfire 3/10 Moderate
- Heat 7/10 Severe 7 d/yr ≥103°F today · 16 d/yr by 30 yrs out
- Wind 1/10 Low
- Air quality 10/10 Extreme 30 unhealthy d/yr today · 38 by 30 yrs out
Nearby sold comps map
Loading sold comps map…
Walkable amenities ~0.75 mi
Loading nearby amenities…
Taxation est. · year 1
- Rental income
- $30,517
- − Mortgage interest
- −$8,962
- − Property taxes
- −$2,400
- − Insurance
- −$800
- − Repairs & maintenance
- −$2,441
- − Management
- −$2,441
- − Depreciation
- −$4,655
- Taxable income
- $8,817
- Est. tax owed @ 24.0%
- −$2,116
- After-tax cash flow
- $8,723/yr
For passive investors: Depreciation is non-cash, so a rental often shows a tax loss while cash-flowing — sheltering income. Rental losses are passive: they offset passive income freely, and up to $25,000/yr can offset ordinary (W-2) income if you actively participate and your MAGI is under $100k (phasing out to $0 by $150k); unused losses carry forward. On sale, claimed depreciation is recaptured at up to 25%, and gains may owe capital-gains tax (a 1031 exchange can defer both). Figures are a year-1 estimate at your 24.0% rate — not tax advice; consult a CPA.
Schools (NCES district)
- District
- Folsom-Cordova Unified
- NCES district ID
- 0613890
- Math proficiency
- 25% ▼ -27.00%
- Reading proficiency
- 25% ▼ -38.00%
- Median HH income
- $75,408
- Composite
- 24.49/100
- National rank
- #7656
- State rank
- #365 of 517 in CA
Livability — Folsom
- Score
- 72/100
- State rank
- #190
- US rank
- #6125
Category grades
Schools grade is shown separately in the Schools card above.
Census & demographics
- Census place
- Folsom, CA
- County
- Sacramento County · 1,539,646 people
- City population
- 79,484
- Metro
- Sacramento-Roseville-Folsom, CA
- Population (ZIP)
- 79,484
- Household income
- $139,642
- Rent vs Own
- Severe rent burden
- 1651.0
Population outlook (Sacramento County) Hauer SSP2
- Today (2025)
- 1,660,763 people
- By 2030
- 1,732,990 · +4.3%
- By 2040
- 1,855,755 · +11.7%
- By 2050
- 1,941,335 · +16.9%
- By 2075
- 2,046,162 · +23.2%
- By 2100
- 1,961,444 · +18.1%
Race, ethnicity, and origin ACS 2023
- Neighborhood character
- Diverse neighborhood (Simpson 0.61)
- Race & ethnicity
- White 58% Asian 20% Hispanic / Latino 13% Two or more races 11% Black 3%
- Hispanic origin (detail)
- Mexican 9% Puerto Rican 1%
- Common ancestry
- Italian 4% Slovak 2% Portuguese 2%
- Foreign-born
- 20% · Canada, China, Vietnam
- Languages at home
- 75% English-only · Other Indo-European 7% Spanish 5% Other Asian/Pacific 5%
Political lean MEDSL · Sacramento
- 2024 margin
- D (+19.7) · D 58.1% · R 38.4% · Other 3.5%
- 2008→2024 swing
- +0.7pp no change · 2008: 19.0pp · 2024: 19.7pp
- All cycles
- 2024: D+19.7 2020: D+25.3 2016: D+23.7 2012: D+16.3 2008: D+19.0
Not yet ingested
- Civics
- —
Market trends
- HPI YoY
- ▼ -240.39%
- Current HPI
- 286.0579
- Rent YoY
- ▲ 1.72%
- Metro
- Sacramento-Roseville-Folsom, CA
- State GDP YoY
- ▲ 3.21%
- F500 in state
- 116
Industry mix (Fortune 500 HQ in CA)
| Industry | F500 HQs | Revenue |
|---|---|---|
| Technology | 27 | $1,492B |
|
||
| Financial Services | 3 | $174B |
|
||
| Retail | 3 | $44B |
|
||
| Insurance | 3 | $26B |
|
||
| Media / Entertainment | 2 | $115B |
|
||
| Pharmaceuticals / Biotech | 2 | $62B |
|
||
Cash-flow waterfall
monthlySold comps — $/sqft
last 12 mo · ≤1 miLoading sold comps…