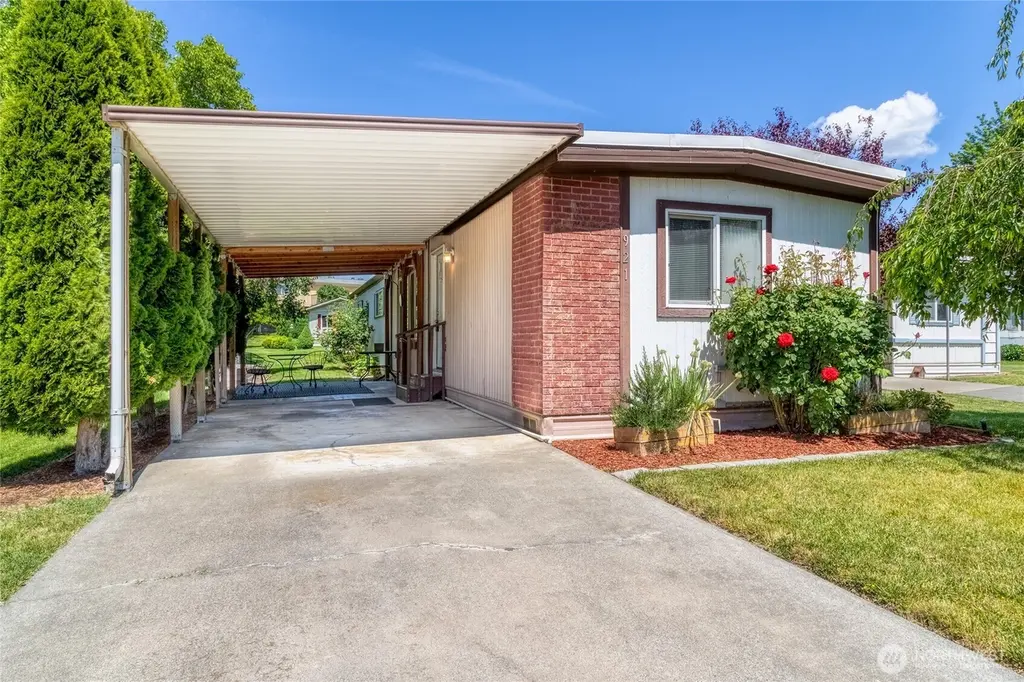
921 SE Scenic View Dr · College Place, WA
Flood risk 7/10 · Major
- FEMA flood zone
- X
- Chance of flooding over 30 yrs
- 0.92%
- Est. flood insurance / yr
- $507 – $1,088
Fire risk 1/10 · Minimal
- Est. fire insurance / yr
- $604 – $1,122
Heat risk 4/10 · Minor
- Hot days now (above 98°F)
- 7 days/yr
- Hot days in 30 yrs
- 15 days/yr
Wind risk 1/10 · Minimal
- Chance of severe wind over 30 yrs
- —
Air-quality risk 8/10 · Major
- Unhealthy air days now
- 10 days/yr
- Unhealthy air days in 30 yrs
- 13 days/yr
Risk factors via First Street. Map © Google.
Why this score? — see what drove the B- grade
The composite is a weighted blend of 9 inputs, each scored 0–100. Each bar is that input's sub-score; the figure is the points it added to the 100-point composite (weight × sub-score).
- Cash flow +30.0/30.0
- DSCR +10.0/10.0
- 1% rule +9.1/10.0
- ARV discount +7.5/15.0
- Schools +4.2/10.0
- Livability +4.1/5.0
- Rent growth +2.5/5.0
- Condition / age +2.5/5.0
- Appreciation +0.0/10.0
$99,900
🖨 Deal sheet 📄 Offer letter ✓ Due diligence
Listing remarks
Peaceful living awaits in this beautifully updated 2 bedroom, 2 bath home, with a creek bordering the backyard. This inviting home offers both comfort and style. As you step inside the home, you will enjoy the vaulted ceilings in the living room and abundant natural light. The bright kitchen includes painted cabinetry and a cozy eat-in dining area perfect for everyday living. The thoughtfully designed floor plan includes two spacious bedrooms and two full bathrooms, including a relaxing primary suite. Step outside to a covered patio overlooking the creek, creating a peaceful setting for morning coffee, entertaining, or simply unwinding. Additional features include a carport, refreshed lands
Key facts
- Covered patio
- Painted cabinetry
- Vaulted ceilings
Tags
Property features AI
Finance
- Other: Mobile home remains; Calculated building area: 938 square feet; Levels: One
- Financial info: Listing terms: Cash; Land lease amount: $505
- HOA & community: Located in Country Estates park; Park amenities include clubhouse, common area, pool; Approximately 140 homes in the park; Senior community
Exterior
- Parking: Carport
- Utilities: Electric energy source; Public water (billed through community); Public sewer (billed through community); Pacific Power; Electric water heater
- Home design: Manufactured single-wide home; One level; Entry level information not specified; Facing direction not specified
- Construction: Metal/Vinyl construction materials; Metal roof (see remarks); Tie down foundation; Manufactured house (Make: KIT, Model: 70/14)
- Exterior features: On waterfront (creek); Metal/vinyl exterior; Curbs and paved access; Patio/porch/deck
Interior
- Kitchen: Dishwasher; Microwave; Stove/Range; Refrigerator; Kitchen with eating space
- Bedrooms: 2 bedrooms
- Flooring: Vinyl; Carpet
- Bathrooms: 2 full bathrooms (2 bathtubs, 2 showers)
- Heating & cooling: Forced air heating; Heat pump (heating and cooling)
- Interior features: Water heater; Ceiling fan(s); Vaulted ceilings; Drapes; Walk-in closet; Patio/porch/deck; Awnings; Bath off primary; Landscaped
- Laundry & utility: Washer; Dryer
Neighborhood map
What this means for you Summary
Snapshot
- This is a 2-bed/2.0-bath manufactured listed at $100k.
Deal economics
- At list price, monthly cash flow is $402 ($5k/yr) — positive.
- The deal already cash-flows at list — no discount required.
- Meets the 1% rule at list price ($1k rent vs $100k).
- Recommended offer: $98k (1.5% below list) — sets the bar for market timing.
- Cap rate 11.9% vs local median 2.5% in College Place — top-decile yield for the area; either an underpriced asset or a hidden risk that comps aren't pricing in. Stress-test before assuming the spread holds.
Location & tenants
- Location reads 82/100 on livability (#71 in WA, #1,277 nationally) — a professional / high-income tenant draw. Strengths: commute A+, housing A+, health & safety A+; Watch: employment D, amenities D-.
- College Place School District (suburban): math 41% / reading 53% proficiency, ranked #170 of 291 in WA (top 58%) — families likely to look elsewhere, expect single-tenant / working-renter base with shorter leases.
- Market conditions: 103 active listings in the ZIP; 14 comparable units currently listed for rent nearby; rentals lingering (median 44d on market — plan ~5-8 weeks vacancy on turnover, expect pricing pressure); 100% of comp listings sitting > 30 days — soft ceiling on asking rent; 206 units permitted in Walla Walla County in 2024 (50 in 5+ unit buildings).
Forward outlook
- Local home prices are declining (-3.0%/yr); year-one equity from $691 of loan paydown is wiped out by about $3k of value loss. Plan a longer hold.
- Walla Walla County population projected at +8% by 2050 — modest demand growth; plan on rents tracking national, not racing it.
- At projected returns (-3.0% appreciation + 3.0% rent growth), your $28k cash investment doubles in ~7 years — after that, you're playing with house money.
Negotiation context
- It's been on market 29 days — a 2% lower offer ($98k) is reasonable based on typical stale-listing flexibility.
- 2 sale attempts since 3y ago with the ask held roughly flat each time — persistent listings suggest the price (not the market) is what's stuck; bring a comps-based counter.
Risks & watch-outs
- Watch-outs: flood insurance adds $66/mo.
- Climate carrying-cost: major flood risk — expect insurance premiums to compound above CPI over the hold.
Questions for the listing agent
- Built in 1978 — when were the roof, HVAC, electrical panel, plumbing, and water heater last replaced?
- What's the actual annual flood-insurance premium (NFIP or private), and is the property in a SFHA with mandatory coverage?
- Is there a deadline driving the sale (1031 exchange, divorce, estate, relocation)? That informs how much negotiation room exists.
- What's the average days-on-market for RENTAL listings here right now (not sales)? A rising rental-DOM trend means longer vacancies and softer asking-rent achievability than the comps imply.
- What's the recent tenant-quality profile in this submarket — average credit score on applications, eviction rate, late-payment / NSF rate, and stable-employment percentage? A property-management company in the area should have these aggregated.
- How much new for-sale + rental construction is in the pipeline within 1–3 miles? Heavy new supply typically softens prices + rents 12–24 months out; constrained supply supports both.
Investment metrics
- 1% rule
- 1.41% ✓
- Cap rate
- 11.92%
- Cash-on-cash
- 20.11%
- DSCR
- 1.89
- GRM
- 5.9
CMA / ARV
- ARV (on-the-fly)
- $60,032
- Comps found
- 4
Show comp detail 4 sales within ~0.75 mi
| Address | Dist | Beds/Ba | Sqft | Sold | Price | $/sf | Match |
|---|---|---|---|---|---|---|---|
| 1420 SE Chickadee Ln | 0.06mi | 3/1.5 (+1) | 952 (+2%) | 0mo | $35,000 | $37 | 87 |
| 859 SE Mockingbird Dr | 0.07mi | 2/1.0 | 960 (+2%) | 6mo | $55,000 | $57 | 84 |
| 1453 SE Bobolink Ln | 0.11mi | 3/2.0 (+1) | 924 (-2%) | 19mo | $59,000 | $64 | 72 |
| 1424 SE Chickadee Ln | 0.07mi | 3/2.0 (+1) | 952 (+2%) | 22mo | $130,000 | $137 | 71 |
Match score weights: distance 35% · size 25% · config 20% · recency 20%. Top-matched comps best support the ARV.
Projected returns pro-forma
-3.0% appreciation · 3.0% rent growth · sell at horizon
- IRR
- 8.6%
- Equity multiple
- 1.34×
- Total profit
- $9,471
- Equity at exit
- $14,895
- IRR
- 17.9%
- Equity multiple
- 2.48×
- Total profit
- $41,378
- Equity at exit
- $8,638
Cash invested: $27,972 (down + closing). Projections, not guarantees.
Landlord ↔ Tenant lean methodology
- Overall (STATE)
- 28 Tenant-Leaning
- State Washington
- 28 Tenant-Leaning · D+8
- County
- — inherits STATE
- City
- — inherits STATE
ZIP-level market 99324
- Home prices YoY
- -17.6%
- Active inventory
- 103
- Price-to-rent
- 5.9×
Monthly cashflow live
- Estimated rent
- $1,407 high interval (Pro) →
- Mortgage (P&I)
- −$524
- Tax from tax record
- −$78 /mo · $930/yr
- Insurance
- −$42
- Flood insurance flood zone
- −$66 /mo · $798/yr
- HOA
- −$0
- Vacancy / Maint / Mgmt
- −$296
- Net cashflow
- $402
Break-even live
UW: 25.0% down · 7.5% · 30yr · 1.5% tax · 5.0% vac · 8.0% maint · 8.0% mgmt
Financing live
Cash to close
- Down payment
- $24,975
- Closing costs
- $2,997
- Reserves months
- —
- Total cash needed
- —
Loan-product check · same deal, 3 products live
Conventional
25% down · 7.5% · 30yr
- Down + closing
- —
- Monthly P&I
- —
- Monthly cashflow
- —
- DSCR
- —
- Eligible?
- —
Personal DTI + credit; lowest rate.
DSCR
20% down · 8.5% · 30yr
- Down + closing
- —
- Monthly P&I
- —
- Monthly cashflow
- —
- DSCR
- —
- Eligible?
- —
No personal income docs; deal must DSCR.
Hard money
10% down · 12.0% · 12mo
- Down + closing
- —
- Monthly P&I
- —
- Monthly cashflow
- —
- DSCR
- —
- Eligible?
- —
Short-term bridge; refi at stabilization.
Rent comps 14 comps
| Address | Beds | Baths | Sqft | Rent | $/sqft | DOM | Units | Dist |
|---|---|---|---|---|---|---|---|---|
| 705 SE Scenic View Dr Unit 2 TOP FLOOR College Place, WA | 2.0 | 1.0 | 800 | $1,450 | $1.81 | 43d | 1 | 0.15mi |
| 1200 SE Broadway Ave Apt H College Place, WA | 1.0 | 1.0 | 534 | $1,095 | $2.05 | 43d | 1 | 0.56mi |
| 925 S College Ave Unit F College Place, WA | 2.0 | 1.0 | 655 | $975 | $1.49 | 43d | 1 | 0.63mi |
| 1005 SW Puff Ln College Place, WA | 2.0 | 1.0 | 890 | $1,100 | $1.24 | 43d | 1 | 0.69mi |
| 108 SE 6th St Apt 11 College Place, WA | 2.0 | 1.0 | 720 | $1,195 | $1.66 | 43d | 1 | 0.69mi |
| 108 SE 6th St #3 College Place, WA | 1.0 | 1.0 | 550 | $1,065 | $1.94 | 43d | 1 | 0.70mi |
| 806 S College Ave College Place, WA | 1.0–2.0 | 1.0–2.0 | 738 | $1,750 | $2.37 | 43d | 3 | 0.71mi |
| 211 SE 3rd St Unit Irisview 327-101 College Place, WA | 2.0 | 1.0 | 800 | $1,295 | $1.62 | 43d | 1 | 0.81mi |
| 43 NE Ash Ave #2 College Place, WA | 1.0 | 1.0 | 819 | $1,185 | $1.45 | 43d | 1 | 1.09mi |
| 255 Elder Pl #3 College Place, WA | 2.0 | 1.0 | 889 | $1,415 | $1.59 | 43d | 1 | 1.11mi |
| 942 NE Spitzenburg St Apt B104 College Place, WA | 2.0 | 1.5 | 975 | $1,530 | $1.57 | 43d | 1 | 1.16mi |
| 220 N College Ave College Place, WA | 2.0 | 1.0 | 850 | $1,150 | $1.35 | 43d | 1 | 1.21mi |
| 623 W Whitman Dr Unit 623 Whitman College Place, WA | 2.0 | 1.5 | 900 | $1,575 | $1.75 | 43d | 1 | 1.34mi |
| 101 Kenwood St #205 Walla Walla, WA | 2.0 | 1.0 | 845 | $1,325 | $1.57 | 43d | 1 | 1.46mi |
Listing history 21 events
-
2026-06-19days on market $99,900 Active 29 DOM
-
2026-06-18days on market $99,900 Active 28 DOM
-
2026-06-17days on market $99,900 Active 27 DOM
-
2026-06-16days on market $99,900 Active 26 DOM
-
2026-06-15days on market $99,900 Active 25 DOM
-
2026-06-14days on market $99,900 Active 23 DOM
-
2026-06-12days on market $99,900 Active 22 DOM
-
2026-06-09days on market $99,900 Active 19 DOM
-
2026-06-08days on market $99,900 Active 18 DOM
-
2026-06-07days on market $99,900 Active 17 DOM
-
2026-06-05days on market $99,900 Active 14 DOM
-
2026-06-03days on market $99,900 Active 13 DOM
-
2026-06-02days on market $99,900 Active 12 DOM
-
2026-06-01days on market $99,900 Active 11 DOM
-
2026-05-31days on market $99,900 Active 10 DOM
-
2026-05-30days on market $99,900 Active 9 DOM
-
2026-05-21$99,900 Active
-
2023-08-28soldstatus $89,500 Closed
-
2023-07-28status Pending
-
2023-06-12$97,000 Active
-
2008-04-04soldstatus $20,000
ⓘ Source: listings_history table (triggers on properties + properties_extension) + one-shot
backfill from property_details.listing_events for pre-trigger history.
Tax reassessment forecast WA · Resets to sale price
- Current annual tax
- $930 · $78/mo
- Projected year-2 tax
- $979 · $82/mo
- Expected delta
- +$49/yr (+$4/mo · 5.2%)
ⓘ Screening estimate from a state-policy table — verify with the county assessor before closing.
Climate risk First Street
- Flood 7/10 Severe FEMA zone X · 92% chance over 30 yrs
- Wildfire 1/10 Low
- Heat 4/10 Moderate 7 d/yr ≥98°F today · 15 d/yr by 30 yrs out
- Wind 1/10 Low
- Air quality 8/10 Severe 10 unhealthy d/yr today · 13 by 30 yrs out
Nearby sold comps map
Loading sold comps map…
Walkable amenities ~0.75 mi
Loading nearby amenities…
Taxation est. · year 1
- Rental income
- $16,889
- − Mortgage interest
- −$5,596
- − Property taxes
- −$930
- − Insurance
- −$1,297
- − Repairs & maintenance
- −$1,351
- − Management
- −$1,351
- − Depreciation
- −$2,906
- Taxable income
- $3,457
- Est. tax owed @ 24.0%
- −$830
- After-tax cash flow
- $3,998/yr
For passive investors: Depreciation is non-cash, so a rental often shows a tax loss while cash-flowing — sheltering income. Rental losses are passive: they offset passive income freely, and up to $25,000/yr can offset ordinary (W-2) income if you actively participate and your MAGI is under $100k (phasing out to $0 by $150k); unused losses carry forward. On sale, claimed depreciation is recaptured at up to 25%, and gains may owe capital-gains tax (a 1031 exchange can defer both). Figures are a year-1 estimate at your 24.0% rate — not tax advice; consult a CPA.
Schools (NCES district)
- District
- College Place School District
- NCES district ID
- 5301470
- Math proficiency
- 41% ▲ 2.00%
- Reading proficiency
- 53% ▬ 0.00%
- Median HH income
- $48,045
- Composite
- 42.23/100
- National rank
- #6997
- State rank
- #170 of 291 in WA
Livability — College Place
- Score
- 82/100
- State rank
- #71
- US rank
- #1277
Category grades
Schools grade is shown separately in the Schools card above.
Census & demographics
- Census place
- College Place, WA
- County
- Walla Walla County · 52,990 people
- City population
- 10,137
- Metro
- Walla Walla, WA
- Population (ZIP)
- 10,137
- Household income
- $62,839
- Rent vs Own
- Severe rent burden
- 400.0
Population outlook (Walla Walla County) Hauer SSP2
- Today (2025)
- 63,088 people
- By 2030
- 64,417 · +2.1%
- By 2040
- 66,563 · +5.5%
- By 2050
- 68,337 · +8.3%
- By 2075
- 73,235 · +16.1%
- By 2100
- 74,878 · +18.7%
Race, ethnicity, and origin ACS 2023
- Neighborhood character
- Predominantly White (72%)
- Race & ethnicity
- White 72% Hispanic / Latino 20% Two or more races 8% Asian 3%
- Hispanic origin (detail)
- Mexican 16%
- Common ancestry
- Italian 6% Lithuanian 4% Portuguese 4%
- Foreign-born
- 9% · Canada, China
- Languages at home
- 84% English-only · Spanish 12% French/Haitian/Cajun 1% Other Asian/Pacific 1%
Political lean MEDSL · Walla Walla
- 2024 margin
- Lean R (+8.1) · D 44.6% · R 52.7% · Other 2.7%
- 2008→2024 swing
- +8.5pp toward D · 2008: -16.6pp · 2024: -8.1pp
- All cycles
- 2024: R+8.1 2020: R+8.7 2016: R+16.4 2012: R+22.3 2008: R+16.6
Not yet ingested
- Civics
- —
Market trends
- HPI YoY
- ▼ -69.73%
- Current HPI
- 326.0923
- Rent YoY
- —
- Metro
- Walla Walla, WA
- State GDP YoY
- ▲ 4.65%
- F500 in state
- 22
Industry mix (Fortune 500 HQ in WA)
| Industry | F500 HQs | Revenue |
|---|---|---|
| Retail | 2 | $269B |
|
||
| Technology / Retail | 1 | $638B |
|
||
| Technology | 1 | $245B |
|
||
| Telecommunications | 1 | $38B |
|
||
| Food / Beverage | 1 | $36B |
|
||
| Automotive / Trucks | 1 | $34B |
|
||
Price history
+399.5% since first listed5 events — show timeline
- 2026-05-21 Listed $99,900 NWMLS as Distributed by MLS Grid
- 2023-08-28 Sold (MLS) $89,500 NWMLS as Distributed by MLS Grid
- 2023-07-28 Pending — NWMLS as Distributed by MLS Grid
- 2023-06-12 Listed $97,000 NWMLS as Distributed by MLS Grid
- 2008-04-04 Sold (Public Records) $20,000 Public Records
Property tax history
+11.8%/yrLatest (2026): $930 · +8.2% YoY. Source: county tax records.
Cash-flow waterfall
monthlySold comps — $/sqft
last 12 mo · ≤1 miLoading sold comps…