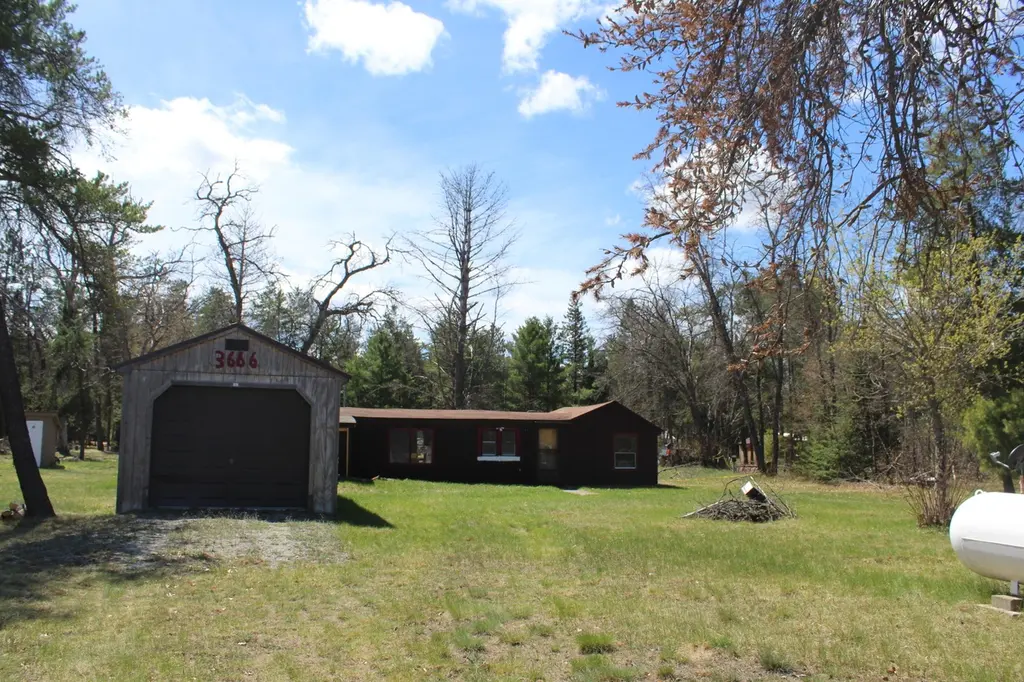
3666 Old State Rd · Mentor, MI
Flood risk 1/10 · Minimal
- FEMA flood zone
- —
- Chance of flooding over 30 yrs
- 0.0%
- Est. flood insurance / yr
- —
Fire risk 4/10 · Minor
- Est. fire insurance / yr
- $784 – $1,456
Heat risk 1/10 · Minimal
- Hot days now (above 95°F)
- 7 days/yr
- Hot days in 30 yrs
- 13 days/yr
Wind risk 1/10 · Minimal
- Chance of severe wind over 30 yrs
- —
Air-quality risk 1/10 · Minimal
- Unhealthy air days now
- 0 days/yr
- Unhealthy air days in 30 yrs
- 0 days/yr
Risk factors via First Street. Map © Google.
Why this score? — see what drove the B grade
The composite is a weighted blend of 9 inputs, each scored 0–100. Each bar is that input's sub-score; the figure is the points it added to the 100-point composite (weight × sub-score).
- Cash flow +30.0/30.0
- ARV discount +15.0/15.0
- DSCR +10.0/10.0
- 1% rule +7.9/10.0
- Schools +2.6/10.0
- Rent growth +2.5/5.0
- Livability +2.5/5.0
- Condition / age +2.5/5.0
- Appreciation +0.0/10.0
$59,900
🖨 Deal sheet 📄 Offer letter ✓ Due diligence
Listing remarks
BORDERS FEDERAL!!!! This would make a great hunting camp or weekend getaway with close proximity to the Ausable River for canoeing, kayaking and fishing and close proximity to the ORV trails This 1 bedroom 1 bath cottage needs a little TLC. & includes 18x26 attached unfinished storage area. seller has made some updates with newer windows. Hard wood floors in the bedroom & Pump on the well installed 2026. Property borders federal land across the road Home to be sold AS IS. All information verified thru buyers agent
Key facts
- Hard wood floors
- Orv trails
- Borders federal land
Tags
Property features AI
Finance
- Other:
- Financial info:
- HOA & community:
Exterior
- Parking:
- Security:
- Utilities: Private well water; Septic tank sewer; Propane for utilities
- Home design: Single-family residential property
- Construction: Slab foundation
- Exterior features: Property includes shed(s); Gravel road access; Approximately 0.25-acre lot (66 x 165)
Interior
- Kitchen:
- Bedrooms:
- Flooring:
- Bathrooms: 1 full bathroom
- Heating & cooling: Space heater; Wood heating
- Interior features: Wood burning stove
- Laundry & utility: No laundry hookups inside
Neighborhood map
What this means for you Summary
Snapshot
- This is a 1-bed/1.0-bath single-family listed at $60k.
Deal economics
- At list price, monthly cash flow is $244 ($3k/yr) — positive.
- The deal already cash-flows at list — no discount required.
- Meets the 1% rule at list price ($775 rent vs $60k).
- Recommended offer: $59k (1.5% below list) — sets the bar for market timing.
Location & tenants
- Location reads: area grade B — affects rentability + tenant quality, not the cash-flow math above.
- Mio-Ausable Schools (rural): math 31% / reading 33% proficiency, ranked #351 of 540 in MI (top 65%) — families likely to look elsewhere, expect single-tenant / working-renter base with shorter leases.
- Market conditions: 45 active listings in the ZIP; 29 units permitted in Oscoda County in 2024 (0 in 5+ unit buildings).
Forward outlook
- Local home prices are declining (-3.0%/yr); year-one equity from $414 of loan paydown is wiped out by about $2k of value loss. Plan a longer hold.
- Oscoda County population projected at -32% by 2050 — secular population decline; favor cash flow + early exit over multi-decade hold.
- At projected returns (-3.0% appreciation + 3.0% rent growth), your $17k cash investment doubles in ~7 years — after that, you're playing with house money.
Negotiation context
- It's been on market 22 days — a 2% lower offer ($59k) is reasonable based on typical stale-listing flexibility.
Questions for the listing agent
- Is there a deadline driving the sale (1031 exchange, divorce, estate, relocation)? That informs how much negotiation room exists.
- What's the average days-on-market for RENTAL listings here right now (not sales)? A rising rental-DOM trend means longer vacancies and softer asking-rent achievability than the comps imply.
- What's the recent tenant-quality profile in this submarket — average credit score on applications, eviction rate, late-payment / NSF rate, and stable-employment percentage? A property-management company in the area should have these aggregated.
- How much new for-sale + rental construction is in the pipeline within 1–3 miles? Heavy new supply typically softens prices + rents 12–24 months out; constrained supply supports both.
Investment metrics
- 1% rule
- 1.29% ✓
- Cap rate
- 11.18%
- Cash-on-cash
- 17.46%
- DSCR
- 1.78
- GRM
- 6.4
CMA / ARV
- ARV (on-the-fly)
- $79,182
- Comps found
- 1
Show comp detail 1 sale within ~0.75 mi
| Address | Dist | Beds/Ba | Sqft | Sold | Price | $/sf | Match |
|---|---|---|---|---|---|---|---|
| 3581 Mielens Dr | 0.24mi | 2/1.0 (+1) | 480 (+1%) | 20mo | $79,900 | $166 | 66 |
Match score weights: distance 35% · size 25% · config 20% · recency 20%. Top-matched comps best support the ARV.
Projected returns pro-forma
-3.0% appreciation · 3.0% rent growth · sell at horizon
- IRR
- 8.8%
- Equity multiple
- 1.35×
- Total profit
- $5,819
- Equity at exit
- $8,931
- IRR
- 18.0%
- Equity multiple
- 2.49×
- Total profit
- $25,012
- Equity at exit
- $5,179
Cash invested: $16,772 (down + closing). Projections, not guarantees.
Landlord ↔ Tenant lean methodology
- Overall (STATE)
- 62 Landlord-Friendly
- State Michigan
- 62 Landlord-Friendly · EVEN
- County
- — inherits STATE
- City
- — inherits STATE
ZIP-level market 48647
- Home prices YoY
- -14.3%
- Active inventory
- 45
- Price-to-rent
- 6.4×
Monthly cashflow live
- Estimated rent
- $775 medium interval (Pro) →
- Mortgage (P&I)
- −$314
- Tax from tax record
- −$29 /mo · $353/yr
- Insurance
- −$25
- HOA
- −$0
- Vacancy / Maint / Mgmt
- −$163
- Net cashflow
- $244
Break-even live
UW: 25.0% down · 7.5% · 30yr · 1.5% tax · 5.0% vac · 8.0% maint · 8.0% mgmt
Financing live
Cash to close
- Down payment
- $14,975
- Closing costs
- $1,797
- Reserves months
- —
- Total cash needed
- —
Loan-product check · same deal, 3 products live
Conventional
25% down · 7.5% · 30yr
- Down + closing
- —
- Monthly P&I
- —
- Monthly cashflow
- —
- DSCR
- —
- Eligible?
- —
Personal DTI + credit; lowest rate.
DSCR
20% down · 8.5% · 30yr
- Down + closing
- —
- Monthly P&I
- —
- Monthly cashflow
- —
- DSCR
- —
- Eligible?
- —
No personal income docs; deal must DSCR.
Hard money
10% down · 12.0% · 12mo
- Down + closing
- —
- Monthly P&I
- —
- Monthly cashflow
- —
- DSCR
- —
- Eligible?
- —
Short-term bridge; refi at stabilization.
Listing history 17 events
-
2026-06-18days on market $59,900 Active 22 DOM
-
2026-06-17days on market $59,900 Active 21 DOM
-
2026-06-16days on market $59,900 Active 20 DOM
-
2026-06-15days on market $59,900 Active 19 DOM
-
2026-06-13days on market $59,900 Active 17 DOM
-
2026-06-12days on market $59,900 Active 16 DOM
-
2026-06-09days on market $59,900 Active 13 DOM
-
2026-06-09remarks 527-char remark
-
2026-06-08days on market $59,900 Active 12 DOM
-
2026-06-07days on market $59,900 Active 11 DOM
-
2026-06-07days on market $59,900 Active 10 DOM
-
2026-06-04days on market $59,900 Active 7 DOM
-
2026-06-02days on market $59,900 Active 6 DOM
-
2026-06-01days on market $59,900 Active 5 DOM
-
2026-05-31days on market $59,900 Active 4 DOM
-
2026-05-31days on market $59,900 Active 3 DOM
-
2026-05-27$59,900 Active
ⓘ Source: listings_history table (triggers on properties + properties_extension) + one-shot
backfill from property_details.listing_events for pre-trigger history.
Tax reassessment forecast MI · Partial reset (capped growth)
- Current annual tax
- $353 · $29/mo
- Projected year-2 tax
- $638 · $53/mo
- Expected delta
- +$285/yr (+$24/mo · 80.7%)
ⓘ Screening estimate from a state-policy table — verify with the county assessor before closing.
Climate risk First Street
- Flood 1/10 Low 0% chance over 30 yrs
- Wildfire 4/10 Moderate
- Heat 1/10 Low 7 d/yr ≥95°F today · 13 d/yr by 30 yrs out
- Wind 1/10 Low
- Air quality 1/10 Low 0 unhealthy d/yr today · 0 by 30 yrs out
Nearby sold comps map
Loading sold comps map…
Walkable amenities ~0.75 mi
Loading nearby amenities…
Taxation est. · year 1
- Rental income
- $9,304
- − Mortgage interest
- −$3,355
- − Property taxes
- −$353
- − Insurance
- −$300
- − Repairs & maintenance
- −$744
- − Management
- −$744
- − Depreciation
- −$1,743
- Taxable income
- $2,065
- Est. tax owed @ 24.0%
- −$496
- After-tax cash flow
- $2,433/yr
For passive investors: Depreciation is non-cash, so a rental often shows a tax loss while cash-flowing — sheltering income. Rental losses are passive: they offset passive income freely, and up to $25,000/yr can offset ordinary (W-2) income if you actively participate and your MAGI is under $100k (phasing out to $0 by $150k); unused losses carry forward. On sale, claimed depreciation is recaptured at up to 25%, and gains may owe capital-gains tax (a 1031 exchange can defer both). Figures are a year-1 estimate at your 24.0% rate — not tax advice; consult a CPA.
Schools (NCES district)
- District
- Mio-Ausable Schools
- NCES district ID
- 2624000
- Math proficiency
- 31% ▼ -3.00%
- Reading proficiency
- 33% ▼ -6.00%
- Median HH income
- $34,216
- Composite
- 26.35/100
- National rank
- #7236
- State rank
- #351 of 540 in MI
Livability — Mentor
No livability data for this city. (Only ~50 U.S. cities are tracked.)
Census & demographics
- Population (ZIP)
- 4,044
Population outlook (Oscoda County) Hauer SSP2
- Today (2025)
- 7,410 people
- By 2030
- 6,884 · -7.1%
- By 2040
- 5,853 · -21.0%
- By 2050
- 5,055 · -31.8%
- By 2075
- 3,832 · -48.3%
- By 2100
- 2,863 · -61.4%
Race, ethnicity, and origin ACS 2023
- Neighborhood character
- Predominantly White (93%)
- Race & ethnicity
- White 93% Two or more races 4% Hispanic / Latino 2%
- Common ancestry
- Romanian 6% Iranian 4% Slovak 3%
- Foreign-born
- 1% · Canada
- Languages at home
- 86% English-only · German/W. Germanic 11% Russian/Polish/Slavic 1% Spanish 1%
Political lean MEDSL · Oscoda
- 2024 margin
- Solid R (+44.3) · D 27.2% · R 71.6% · Other 1.2%
- 2008→2024 swing
- -34.3pp toward R · 2008: -10.0pp · 2024: -44.3pp
- All cycles
- 2024: R+44.3 2020: R+43.6 2016: R+44.3 2012: R+16.2 2008: R+10.0
Not yet ingested
- Civics
- —
Market trends
- HPI YoY
- ▼ -29.34%
- Current HPI
- 176.2398
- Rent YoY
- —
- Metro
- —
- State GDP YoY
- ▲ 1.37%
- F500 in state
- 28
Industry mix (Fortune 500 HQ in MI)
| Industry | F500 HQs | Revenue |
|---|---|---|
| Automotive Parts | 3 | $48B |
|
||
| Automotive | 2 | $372B |
|
||
| Chemicals | 1 | $45B |
|
||
| Automotive Retail | 1 | $29B |
|
||
| Healthcare / Medical Devices | 1 | $23B |
|
||
| Automotive Technology | 1 | $20B |
|
||
Price history
1 event — show timeline
- 2026-05-27 Listed $59,900 WWMLS
Property tax history
+1.7%/yrLatest (2025): $353 · -21.9% YoY. Source: county tax records.
Cash-flow waterfall
monthlySold comps — $/sqft
last 12 mo · ≤1 miLoading sold comps…