 Multi-family
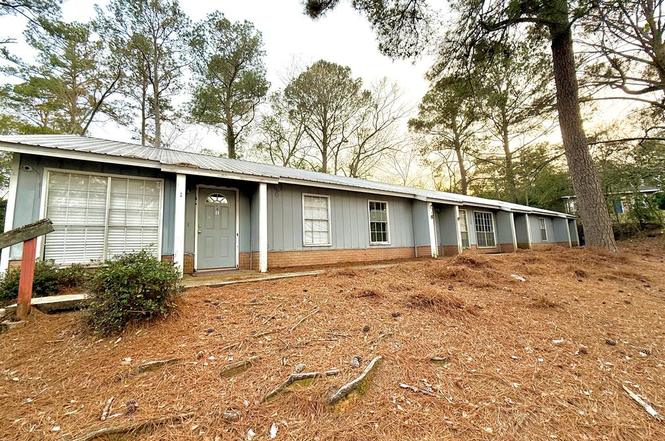
118 Weeks Dr · Enterprise, AL
Flood risk 1/10 · Minimal
- FEMA flood zone
- X (unshaded)
- Chance of flooding over 30 yrs
- 0.0%
- Est. flood insurance / yr
- $507 – $1,088
Fire risk 3/10 · Minor
- Est. fire insurance / yr
- $916 – $1,700
Heat risk 8/10 · Major
- Hot days now (above 106°F)
- 7 days/yr
- Hot days in 30 yrs
- 19 days/yr
Wind risk 8/10 · Major
- Chance of severe wind over 30 yrs
- 99.0%
Air-quality risk 1/10 · Minimal
- Unhealthy air days now
- 0 days/yr
- Unhealthy air days in 30 yrs
- 0 days/yr
Risk factors via First Street. Map © Google.
Why this score? — see what drove the B grade
The composite is a weighted blend of 9 inputs, each scored 0–100. Each bar is that input's sub-score; the figure is the points it added to the 100-point composite (weight × sub-score).
- Cash flow +30.0/30.0
- 1% rule +10.0/10.0
- DSCR +10.0/10.0
- ARV discount +8.9/15.0
- Schools +4.3/10.0
- Rent growth +3.5/5.0
- Livability +3.2/5.0
- Condition / age +2.5/5.0
- Appreciation +0.0/10.0
$199,000
🖨 Deal sheet 📄 Offer letter ✓ Due diligence
Multi-family units
County records classify this as Multi-Family (5+ Unit). Listing-text estimate: 1 unit. estimate disagrees with records
5+ unit building — per-unit beds/baths from public records are typically unavailable; the breakdown below (if shown) is an estimate from the listing text.
Listing remarks MLS
ALL UNITS OCCUPIED- CALL LISTING AGENT FOR APPOINTMENT,
Key facts
- Strong rental demand
- 0.42 acre lot
- Built 1979
Tags
Neighborhood map
What this means for you Summary
Snapshot
- This is a 8-bed/4.0-bath multifamily listed at $199k.
Deal economics
- At list price, monthly cash flow is $3k ($30k/yr) — positive.
- The deal already cash-flows at list — no discount required.
- Meets the 1% rule at list price ($5k rent vs $199k).
- Cap rate 21.5% vs local median 4.2% in Enterprise — top-decile yield for the area; either an underpriced asset or a hidden risk that comps aren't pricing in. Stress-test before assuming the spread holds.
Location & tenants
- Location reads 65/100 on livability (#127 in AL) — a middle-class / working-renter tenant base. Strengths: cost of living A+, housing A+; Watch: health & safety D, crime F, amenities F.
- Enterprise City (town): math 40% / reading 60% proficiency, ranked #12 of 129 in AL (top 9%) — acceptable for families but not a draw, mixed tenant base, ~2y average lease.
- Zoned schools: Hillcrest Elementary School (math 52% / reading 66%, grade B-, #67 of 627 statewide, top 11%, 760 students, 54% FRL); Dauphin Junior High School (math 42% / reading 68%, grade B-, #17 of 257 statewide, top 7%, 500 students, 39% FRL); Enterprise High School (math 34% / reading 37%, grade F, #45 of 305 statewide, top 14%, 2,117 students, 44% FRL).
- Market conditions: Rents rising (+3.9%/yr); 441 active listings in the ZIP; solid renter incomes; 137 units permitted in Coffee County in 2024 (0 in 5+ unit buildings).
- At $4,738/mo this rent would consume 75% of the median local household income ($76k/yr) (locally 1126% of renters already pay >50% of income on rent) — very limited rent-growth headroom before tenants either downsize or default.
Forward outlook
- Local home prices are declining (-3.0%/yr); year-one equity from $1k of loan paydown is wiped out by about $6k of value loss. Plan a longer hold.
- At projected returns (-3.0% appreciation + 3.9% rent growth), your $56k cash investment doubles in ~3 years — after that, you're playing with house money.
Negotiation context
- Only 3 days on market — expect competitive offers; lowballing is unlikely to land.
- 2 sale attempts since 19y ago with the ask held roughly flat each time — persistent listings suggest the price (not the market) is what's stuck; bring a comps-based counter.
- Current owner paid $160k; 24% above their basis — modest negotiation headroom, anchor on the comps not their cost.
Risks & watch-outs
- Climate carrying-cost: severe wind risk, 99% chance of damaging wind over 30y; extreme-heat days projected 7→19/yr by 2055 (HVAC capex compounding) — expect insurance premiums to compound above CPI over the hold.
Questions for the listing agent
- Built in 1979 — when were the roof, HVAC, electrical panel, plumbing, and water heater last replaced?
- Is there a deadline driving the sale (1031 exchange, divorce, estate, relocation)? That informs how much negotiation room exists.
- Crime grade is F in this area — have there been break-ins, vandalism, or insurance claims at this property in the last 3 years? What carrier currently insures it and at what premium?
- What's the average days-on-market for RENTAL listings here right now (not sales)? A rising rental-DOM trend means longer vacancies and softer asking-rent achievability than the comps imply.
- What's the recent tenant-quality profile in this submarket — average credit score on applications, eviction rate, late-payment / NSF rate, and stable-employment percentage? A property-management company in the area should have these aggregated.
- How much new apartment / multifamily construction is in the pipeline within 1–3 miles? Heavy new supply (>2% of stock underway) typically softens rents 12–24 months out; light construction supports rent growth.
Investment metrics
- 1% rule
- 2.38% ✓
- Cap rate
- 21.49%
- Cash-on-cash
- 54.28%
- DSCR
- 3.42
- GRM
- 3.5
CMA / ARV
- ARV (on-the-fly)
- $205,200
- Comps found
- 1
Show comp detail 1 sale within ~0.75 mi
| Address | Dist | Beds/Ba | Sqft | Sold | Price | $/sf | Match |
|---|---|---|---|---|---|---|---|
| 118 Weeks Dr | 0.00mi | 8/4.0 | 3,600 (0%) | 1mo | $205,000 | $57 | 100 |
Match score weights: distance 35% · size 25% · config 20% · recency 20%. Top-matched comps best support the ARV.
Projected returns pro-forma
-3.0% appreciation · 3.92% rent growth · sell at horizon
- IRR
- 53.4%
- Equity multiple
- 3.38×
- Total profit
- $132,675
- Equity at exit
- $29,672
- IRR
- 59.0%
- Equity multiple
- 7.11×
- Total profit
- $340,638
- Equity at exit
- $17,206
Cash invested: $55,720 (down + closing). Projections, not guarantees.
Landlord ↔ Tenant lean methodology
- Overall (STATE)
- 90 Strongly Landlord-Friendly
- State Alabama
- 90 Strongly Landlord-Friendly · R+15
- County
- — inherits STATE
- City
- — inherits STATE
ZIP-level market 36330
- Home prices YoY
- -19.4%
- Rents YoY
- 3.9%
- Active inventory
- 441
- Price-to-rent
- 14.0×
Monthly cashflow live
- Estimated rent
- $4,738 high interval (Pro) →
- Mortgage (P&I)
- −$1,044
- Tax from tax record
- −$96 /mo · $1,155/yr
- Insurance
- −$83
- HOA
- −$0
- Vacancy / Maint / Mgmt
- −$995
- Net cashflow
- $2,520
Break-even live
4-unit breakdown (identical units grouped — click to expand)
| Units | Beds | Baths | Est. rent |
|---|---|---|---|
| 4× units | 2 | 1 | $4,740 |
| #1 | 2 | 1 | $1,185 |
| #2 | 2 | 1 | $1,185 |
| #3 | 2 | 1 | $1,185 |
| #4 | 2 | 1 | $1,185 |
| Total (4 units) | $4,738 | ||
UW: 25.0% down · 7.5% · 30yr · 1.5% tax · 5.0% vac · 8.0% maint · 8.0% mgmt
Financing live
Cash to close
- Down payment
- $49,750
- Closing costs
- $5,970
- Reserves months
- —
- Total cash needed
- —
Loan-product check · same deal, 3 products live
Conventional
25% down · 7.5% · 30yr
- Down + closing
- —
- Monthly P&I
- —
- Monthly cashflow
- —
- DSCR
- —
- Eligible?
- —
Personal DTI + credit; lowest rate.
DSCR
20% down · 8.5% · 30yr
- Down + closing
- —
- Monthly P&I
- —
- Monthly cashflow
- —
- DSCR
- —
- Eligible?
- —
No personal income docs; deal must DSCR.
Hard money
10% down · 12.0% · 12mo
- Down + closing
- —
- Monthly P&I
- —
- Monthly cashflow
- —
- DSCR
- —
- Eligible?
- —
Short-term bridge; refi at stabilization.
Listing history 4 events
-
2026-03-03status Pending
-
2026-02-27$199,000 Active
-
2008-03-06soldstatus $160,000 55-char remark
Show marketing remark (55 chars)
ALL UNITS OCCUPIED- CALL LISTING AGENT FOR APPOINTMENT,
-
2007-09-07$170,000 55-char remark
Show marketing remark (55 chars)
ALL UNITS OCCUPIED- CALL LISTING AGENT FOR APPOINTMENT,
ⓘ Source: listings_history table (triggers on properties + properties_extension) + one-shot
backfill from property_details.listing_events for pre-trigger history.
Tax reassessment forecast AL · Resets to sale price
- Current annual tax
- $1,155 · $96/mo
- Projected year-2 tax
- $1,155 · $96/mo
- Expected delta
- $0/yr ($0/mo · 0.0%)
ⓘ Screening estimate from a state-policy table — verify with the county assessor before closing.
Climate risk First Street
- Flood 1/10 Low FEMA zone X (unshaded) · 0% chance over 30 yrs
- Wildfire 3/10 Moderate
- Heat 8/10 Severe 7 d/yr ≥106°F today · 19 d/yr by 30 yrs out
- Wind 8/10 Severe 99% chance of damaging wind over 30 yrs
- Air quality 1/10 Low 0 unhealthy d/yr today · 0 by 30 yrs out
Nearby sold comps map
Loading sold comps map…
Walkable amenities ~0.75 mi
Loading nearby amenities…
Taxation est. · year 1
- Rental income
- $56,856
- − Mortgage interest
- −$11,147
- − Property taxes
- −$1,155
- − Insurance
- −$995
- − Repairs & maintenance
- −$4,548
- − Management
- −$4,548
- − Depreciation
- −$5,789
- Taxable income
- $28,673
- Est. tax owed @ 24.0%
- −$6,882
- After-tax cash flow
- $23,362/yr
For passive investors: Depreciation is non-cash, so a rental often shows a tax loss while cash-flowing — sheltering income. Rental losses are passive: they offset passive income freely, and up to $25,000/yr can offset ordinary (W-2) income if you actively participate and your MAGI is under $100k (phasing out to $0 by $150k); unused losses carry forward. On sale, claimed depreciation is recaptured at up to 25%, and gains may owe capital-gains tax (a 1031 exchange can defer both). Figures are a year-1 estimate at your 24.0% rate — not tax advice; consult a CPA.
Schools (NCES district)
- District
- Enterprise City
- NCES district ID
- 0101320
- Math proficiency
- 40% ▼ -20.00%
- Reading proficiency
- 60% ▲ 4.00%
- Median HH income
- $51,311
- Composite
- 42.83/100
- National rank
- #3136
- State rank
- #12 of 129 in AL
Livability — Enterprise
- Score
- 65/100
- State rank
- #127
- US rank
- #12953
Category grades
Schools grade is shown separately in the Schools card above.
Census & demographics
- Census place
- Enterprise, AL
- County
- Coffee County · 39,557 people
- City population
- 39,557
- Metro
- Enterprise, AL
- Population (ZIP)
- 39,557
- Household income
- $75,765
- Rent vs Own
- Severe rent burden
- 1126.0
Population outlook (Coffee County) Hauer SSP2
- Today (2025)
- 53,133 people
- By 2030
- 53,832 · +1.3%
- By 2040
- 54,504 · +2.6%
- By 2050
- 54,289 · +2.2%
- By 2075
- 51,175 · -3.7%
- By 2100
- 46,793 · -11.9%
Race, ethnicity, and origin ACS 2023
- Neighborhood character
- Diverse neighborhood (Simpson 0.56)
- Race & ethnicity
- White 63% Black 17% Hispanic / Latino 13% Two or more races 9% Asian 1%
- Hispanic origin (detail)
- Mexican 6% Puerto Rican 3%
- Common ancestry
- Italian 3% Lithuanian 2% Serbian 2%
- Foreign-born
- 6% · Canada, Vietnam, South Korea
- Languages at home
- 89% English-only · Spanish 8% German/W. Germanic 2%
Political lean MEDSL · Coffee
- 2024 margin
- Solid R (+57.9) · D 20.7% · R 78.6%
- 2008→2024 swing
- -9.0pp toward R · 2008: -48.9pp · 2024: -57.9pp
- All cycles
- 2024: R+57.9 2020: R+53.1 2016: R+56.7 2012: R+49.4 2008: R+48.9
Not yet ingested
- Civics
- —
Market trends
- HPI YoY
- ▼ -44.44%
- Current HPI
- 184.0163
- Rent YoY
- ▲ 3.92%
- Metro
- Enterprise, AL
- State GDP YoY
- ▲ 2.94%
- F500 in state
- 4
Industry mix (Fortune 500 HQ in AL)
| Industry | F500 HQs | Revenue |
|---|---|---|
| Financial Services | 1 | $8B |
|
||
| Healthcare | 1 | $5B |
|
||
Price history
+17.1% since first listed4 events — show timeline
- 2026-03-03 Pending — SAMLS
- 2026-02-27 Listed $199,000 SAMLS
- 2008-03-06 Sold (MLS) $160,000 MAAR
- 2007-09-07 Listed $170,000 MAAR
Property tax history
-0.5%/yrLatest (2025): $1,155 · -15.9% YoY. Source: county tax records.
Cash-flow waterfall
monthlySold comps — $/sqft
last 12 mo · ≤1 miLoading sold comps…