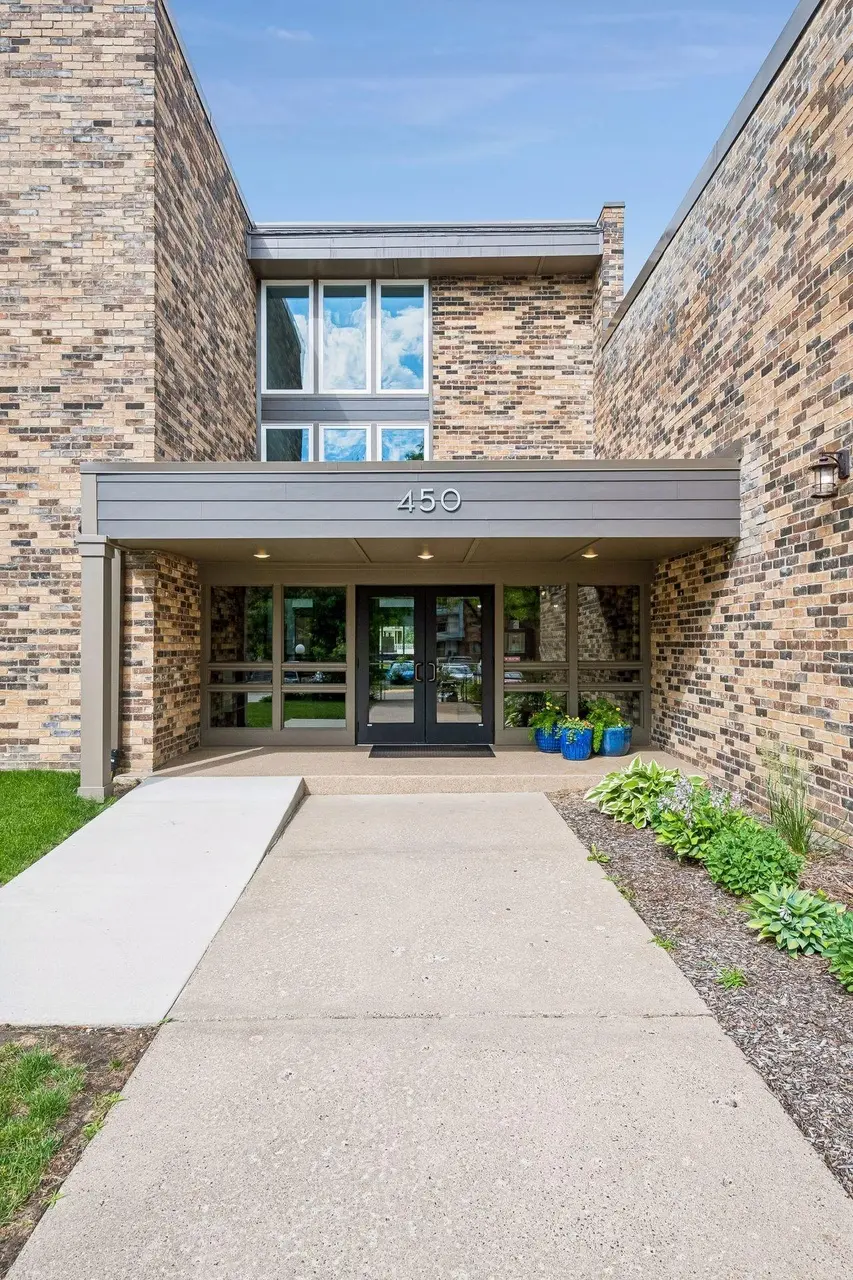
450 Ford Rd #303 · St. Louis Park, MN
Flood risk 8/10 · Major
- FEMA flood zone
- X (unshaded)
- Chance of flooding over 30 yrs
- 0.78%
- Est. flood insurance / yr
- $507 – $1,088
Fire risk 1/10 · Minimal
- Est. fire insurance / yr
- $888 – $1,650
Heat risk 2/10 · Minimal
- Hot days now (above 98°F)
- 7 days/yr
- Hot days in 30 yrs
- 14 days/yr
Wind risk 2/10 · Minimal
- Chance of severe wind over 30 yrs
- —
Air-quality risk 2/10 · Minimal
- Unhealthy air days now
- 2 days/yr
- Unhealthy air days in 30 yrs
- 2 days/yr
Risk factors via First Street. Map © Google.
Why this score? — see what drove the B grade
The composite is a weighted blend of 9 inputs, each scored 0–100. Each bar is that input's sub-score; the figure is the points it added to the 100-point composite (weight × sub-score).
- Cash flow +30.0/30.0
- 1% rule +10.0/10.0
- DSCR +10.0/10.0
- ARV discount +7.5/15.0
- Schools +4.6/10.0
- Rent growth +3.0/5.0
- Livability +2.5/5.0
- Condition / age +2.5/5.0
- Appreciation +0.0/10.0
$61,000
🖨 Deal sheet 📄 Offer letter ✓ Due diligence
Listing remarks MLS
Excellent location on this oversized top floor 1 Bedroom Condo. Very large bedroom & living room with covered deck over looking courtyard. Heated underground garage w/car wash. Additional outdoor parking. Amenities include indoor pool, hot tub, exercise & party room. Close to Ridgedale, West End, Downtown & Bus line.
Key facts
- Hot tub
- Exercise room
- Sauna
Tags
Property features AI
Finance
- Other: Lot approximately 3.609 acres with city street frontage and public road maintenance
- Financial info: Conventional mortgage types accepted
- HOA & community: Association: First Service Residential; Monthly association fee ($578) covering cable TV, controlled access, gas, hazard insurance, heating, internet, lawn care, grounds maintenance, parking, professional management, sewer, shared amenities, snow removal, water; Building amenities include car wash, coin-op leased laundry, elevators, lobby entrance, patio, sauna, trails, amusement/party room, exercise room
Exterior
- Parking: Attached underground heated garage with door opener; 4 garage spaces
- Security: Controlled access
- Utilities: City water connected; City sewer connected; Natural gas; Electric service with circuit breakers, 100 amp; Power provided by Xcel Energy
- Home design: Attached residential unit; One-story layout; Shared indoor heated below-ground pool
- Construction: Block foundation; Flat roof (age 8 years or less)
- Exterior features: Deck; Stone exterior; Balcony; Cable available; Patio (building/common)
Interior
- Kitchen: Dishwasher; Range; Refrigerator; Disposal; Exhaust fan
- Bedrooms: One bedroom (main level, approx. 15 x 14)
- Bathrooms: One full bathroom on the main level
- Heating & cooling: Boiler heating; No central cooling
- Interior features: Dishwasher; Disposal; Exhaust fan; Range; Refrigerator; Informal dining area / living-dining combo; Exercise room (main level); Living room (main level)
Neighborhood map
What this means for you Summary
Snapshot
- This is a 1-bed/1.0-bath condo listed at $61k.
Deal economics
- At list price, monthly cash flow is $207 ($2k/yr) — positive.
- The deal already cash-flows at list — no discount required.
- Meets the 1% rule at list price ($2k rent vs $61k).
- Cap rate 11.7% vs local median 3.1% in St. Louis Park — top-decile yield for the area; either an underpriced asset or a hidden risk that comps aren't pricing in. Stress-test before assuming the spread holds.
Location & tenants
- Location reads: area grade B — affects rentability + tenant quality, not the cash-flow math above.
- Hopkins Public School District (suburban): math 48% / reading 57% proficiency, ranked #75 of 301 in MN (top 25%) — acceptable for families but not a draw, mixed tenant base, ~2y average lease.
- Market conditions: Rents rising (+1.9%/yr); 138 active listings in the ZIP; 19 comparable units currently listed for rent nearby; rentals leasing fast (median 2d on market — plan ~1-2 weeks tenant-placement turnaround); solid renter incomes; 4,651 units permitted in Hennepin County in 2024 (2,443 in 5+ unit buildings).
Forward outlook
- Local home prices are declining (-3.0%/yr); year-one equity from $422 of loan paydown is wiped out by about $2k of value loss. Plan a longer hold.
- Hennepin County population projected at +30% by 2050 — long-run rental-demand tailwind backs the buy-and-hold thesis.
- At projected returns (-3.0% appreciation + 1.9% rent growth), your $17k cash investment doubles in ~10 years — after that, you're playing with house money.
Negotiation context
- Only 10 days on market — expect competitive offers; lowballing is unlikely to land.
- 7 sale attempts since 30y ago with the ask held roughly flat each time — persistent listings suggest the price (not the market) is what's stuck; bring a comps-based counter.
Risks & watch-outs
- Watch-outs: flood insurance adds $66/mo; HOA is 36% of rent.
- Climate carrying-cost: severe flood risk — expect insurance premiums to compound above CPI over the hold.
Questions for the listing agent
- Built in 1972 — when were the roof, HVAC, electrical panel, plumbing, and water heater last replaced?
- What's the actual annual flood-insurance premium (NFIP or private), and is the property in a SFHA with mandatory coverage?
- What does the HOA fee cover, when was the last increase, and are there any pending special assessments or reserve-fund shortfalls?
- Any open or pending special assessments — roof, HVAC, plumbing, elevator, façade? What's the per-unit balance and payoff schedule, and is the seller paying it off at close or rolling it to the buyer?
- Is there a deadline driving the sale (1031 exchange, divorce, estate, relocation)? That informs how much negotiation room exists.
- What's the average days-on-market for RENTAL listings here right now (not sales)? A rising rental-DOM trend means longer vacancies and softer asking-rent achievability than the comps imply.
- What's the recent tenant-quality profile in this submarket — average credit score on applications, eviction rate, late-payment / NSF rate, and stable-employment percentage? A property-management company in the area should have these aggregated.
- How much new apartment / multifamily construction is in the pipeline within 1–3 miles? Heavy new supply (>2% of stock underway) typically softens rents 12–24 months out; light construction supports rent growth.
Investment metrics
- 1% rule
- 2.64% ✓
- Cap rate
- 11.68%
- Cash-on-cash
- 19.23%
- DSCR
- 1.86
- GRM
- 3.2
CMA / ARV
No comps found within radius.
Projected returns pro-forma
-3.0% appreciation · 1.87% rent growth · sell at horizon
- IRR
- 3.0%
- Equity multiple
- 1.11×
- Total profit
- $1,921
- Equity at exit
- $9,095
- IRR
- 10.7%
- Equity multiple
- 1.77×
- Total profit
- $13,105
- Equity at exit
- $5,274
Cash invested: $17,080 (down + closing). Projections, not guarantees.
Landlord ↔ Tenant lean methodology
- Overall (STATE)
- 46 Balanced
- State Minnesota
- 46 Balanced · D+2
- County
- — inherits STATE
- City
- — inherits STATE
ZIP-level market 55426
- Rents YoY
- 1.9%
- Active inventory
- 138
- Price-to-rent
- 3.2×
Monthly cashflow live
- Estimated rent
- $1,612 high interval (Pro) →
- Mortgage (P&I)
- −$320
- Tax est. 1.5%
- −$76 /mo · $915/yr
- Insurance
- −$25
- Flood insurance flood zone
- −$66 /mo · $798/yr
- HOA
- −$578
- Vacancy / Maint / Mgmt
- −$338
- Net cashflow
- $207
Break-even live
UW: 25.0% down · 7.5% · 30yr · 1.5% tax · 5.0% vac · 8.0% maint · 8.0% mgmt
Financing live
Cash to close
- Down payment
- $15,250
- Closing costs
- $1,830
- Reserves months
- —
- Total cash needed
- —
Loan-product check · same deal, 3 products live
Conventional
25% down · 7.5% · 30yr
- Down + closing
- —
- Monthly P&I
- —
- Monthly cashflow
- —
- DSCR
- —
- Eligible?
- —
Personal DTI + credit; lowest rate.
DSCR
20% down · 8.5% · 30yr
- Down + closing
- —
- Monthly P&I
- —
- Monthly cashflow
- —
- DSCR
- —
- Eligible?
- —
No personal income docs; deal must DSCR.
Hard money
10% down · 12.0% · 12mo
- Down + closing
- —
- Monthly P&I
- —
- Monthly cashflow
- —
- DSCR
- —
- Eligible?
- —
Short-term bridge; refi at stabilization.
Rent comps 19 comps
| Address | Beds | Baths | Sqft | Rent | $/sqft | DOM | Units | Dist |
|---|---|---|---|---|---|---|---|---|
| 400 Ford Rd Minneapolis, MN | 1.0–3.0 | 1.0–2.0 | 1025 | $1,395 | $1.36 | 1d | 9 | 0.09mi |
| 275 Shelard Pkwy St Louis Park, MN | 1.0–2.0 | 1.0–2.0 | 900 | $1,410 | $1.57 | 5d | 11 | 0.14mi |
| 9920 Wayzata Blvd Minneapolis, MN | 2.0 | 1.0–2.5 | 942 | $2,470 | $2.62 | 1d | 28 | 0.17mi |
| 301 Shelard Pkwy Minneapolis, MN | 3.0 | 1.0–2.0 | 987 | $1,966 | $1.99 | 1d | 16 | 0.17mi |
| 135 Nathan Ln N Minneapolis, MN | 2.0 | 1.0–2.0 | 800 | $1,568 | $1.96 | 1d | 20 | 0.34mi |
| 200 Nathan Ln N Plymouth, MN | 1.0–2.0 | 1.0–2.0 | 926 | $1,606 | $1.73 | 1d | 5 | 0.36mi |
| 10101 Highway 55 Minneapolis, MN | 1.0–2.0 | 1.0 | 805 | $1,275 | $1.58 | 5d | 6 | 0.49mi |
| 10010 6th Ave N Minneapolis, MN | 1.0–3.0 | 1.0–2.0 | 1100 | $1,716 | $1.56 | 1d | 22 | 0.66mi |
| 9201 Golden Valley Rd Minneapolis, MN | 1.0–2.0 | 1.0–2.0 | 926 | $1,600 | $1.73 | 1d | 19 | 0.74mi |
| 9140 Golden Valley Rd Minneapolis, MN | 1.0–2.0 | 1.0 | 662 | $1,195 | $1.80 | 3d | 5 | 0.83mi |
| 11700 Wayzata Blvd Hopkins, MN | 1.0–3.0 | 1.0–2.0 | 1170 | $1,685 | $1.44 | 1d | 14 | 1.06mi |
| 11816 Wayzata Blvd Hopkins, MN | 1.0–2.0 | 1.0–2.0 | 940 | $1,595 | $1.70 | 1d | 16 | 1.18mi |
| 8350 Golden Valley Rd Golden Valley, MN | 1.0–2.0 | 1.0–2.0 | 995 | $1,760 | $1.77 | 3d | 9 | 1.20mi |
| 640 Wisconsin Ave N Golden Valley, MN | 1.0–3.0 | 1.0–2.0 | 1118 | $1,820 | $1.63 | 1d | 99 | 1.27mi |
| 1020 W Medicine Lake Dr Minneapolis, MN | 1.0–3.0 | 1.0–2.0 | 1272 | $1,899 | $1.49 | 3d | 4 | 1.27mi |
| 1305 Flag Ave N Unit 2 Golden Valley, MN | 1.0 | 1.0 | 800 | $1,650 | $2.06 | 17d | 1 | 1.30mi |
| 1305 Flag Ave N Unit Labs Golden Valley, MN | 1.0 | 1.0 | 850 | $1,500 | $1.76 | 10d | 1 | 1.30mi |
| 10201 Cedar Lake Rd S Unit 201-101 Minnetonka, MN | 2.0 | 1.5 | 1038 | $1,499 | $1.44 | 17d | 1 | 1.47mi |
| 1919 Ymca Ln Hopkins, MN | 1.0–2.0 | 1.0–2.0 | 1023 | $1,530 | $1.50 | 1d | 5 | 1.49mi |
HOA detail condo
- Monthly dues
- $578 · $6,936/yr
- Likely covers
- pool
- Assessments
- None detected in remarks — confirm with the listing agent.
Listing history 8 events
-
2026-06-18days on market $61,000 Active 10 DOM
-
2026-06-17days on market $61,000 Active 9 DOM
-
2026-06-16days on market $61,000 Active 8 DOM
-
2026-06-15days on market $61,000 Active 7 DOM
-
2026-06-13days on market $61,000 Active 5 DOM
-
2026-06-13days on market $61,000 Active 4 DOM
-
2026-06-09remarks 496-char remark
-
2026-06-09$61,000 Active 1 DOM
ⓘ Source: listings_history table (triggers on properties + properties_extension) + one-shot
backfill from property_details.listing_events for pre-trigger history.
Climate risk First Street
- Flood 8/10 Severe FEMA zone X (unshaded) · 78% chance over 30 yrs
- Wildfire 1/10 Low
- Heat 2/10 Low 7 d/yr ≥98°F today · 14 d/yr by 30 yrs out
- Wind 2/10 Low
- Air quality 2/10 Low 2 unhealthy d/yr today · 2 by 30 yrs out
Nearby sold comps map
Loading sold comps map…
Walkable amenities ~0.75 mi
Loading nearby amenities…
Taxation est. · year 1
- Rental income
- $19,340
- − Mortgage interest
- −$3,417
- − Property taxes
- −$915
- − Insurance
- −$1,102
- − Repairs & maintenance
- −$1,547
- − Management
- −$1,547
- − HOA
- −$6,936
- − Depreciation
- −$1,775
- Taxable income
- $2,101
- Est. tax owed @ 24.0%
- −$504
- After-tax cash flow
- $1,982/yr
For passive investors: Depreciation is non-cash, so a rental often shows a tax loss while cash-flowing — sheltering income. Rental losses are passive: they offset passive income freely, and up to $25,000/yr can offset ordinary (W-2) income if you actively participate and your MAGI is under $100k (phasing out to $0 by $150k); unused losses carry forward. On sale, claimed depreciation is recaptured at up to 25%, and gains may owe capital-gains tax (a 1031 exchange can defer both). Figures are a year-1 estimate at your 24.0% rate — not tax advice; consult a CPA.
Schools (NCES district)
- District
- Hopkins Public School District
- NCES district ID
- 2714260
- Math proficiency
- 48% ▼ -6.00%
- Reading proficiency
- 57% ▼ -2.00%
- Median HH income
- $66,915
- Composite
- 46.44/100
- National rank
- #2448
- State rank
- #75 of 301 in MN
Livability — St. Louis Park
No livability data for this city. (Only ~50 U.S. cities are tracked.)
Census & demographics
- Census place
- St. Louis Park, MN
- County
- Hennepin County · 1,150,272 people
- City population
- 60,356
- Metro
- Minneapolis-St. Paul-Bloomington, MN-WI
- Population (ZIP)
- 25,251
- Household income
- $99,347
- Rent vs Own
- Severe rent burden
- 761.0
Population outlook (Hennepin County) Hauer SSP2
- Today (2025)
- 1,405,227 people
- By 2030
- 1,492,650 · +6.2%
- By 2040
- 1,660,157 · +18.1%
- By 2050
- 1,823,498 · +29.8%
- By 2075
- 2,221,283 · +58.1%
- By 2100
- 2,509,976 · +78.6%
Race, ethnicity, and origin ACS 2023
- Neighborhood character
- Predominantly White (76%)
- Race & ethnicity
- White 76% Two or more races 8% Hispanic / Latino 6% Asian 6% Black 4%
- Hispanic origin (detail)
- Mexican 3%
- Common ancestry
- Portuguese 10% Romanian 4% Scottish 3%
- Foreign-born
- 8% · Canada, China
- Languages at home
- 87% English-only · Spanish 4% Other Indo-European 2% Other Asian/Pacific 2%
Political lean MEDSL · Hennepin
- 2024 margin
- Solid D (+42.6) · D 70.2% · R 27.5% · Other 2.3%
- 2008→2024 swing
- +14.0pp toward D · 2008: 28.6pp · 2024: 42.6pp
- All cycles
- 2024: D+42.6 2020: D+43.2 2016: D+35.3 2012: D+27.1 2008: D+28.6
Not yet ingested
- Civics
- —
Market trends
- HPI YoY
- ▼ -353.30%
- Current HPI
- 267.0902
- Rent YoY
- ▲ 1.87%
- Metro
- Minneapolis-St. Paul-Bloomington, MN-WI
- State GDP YoY
- ▲ 2.41%
- F500 in state
- 34
Industry mix (Fortune 500 HQ in MN)
| Industry | F500 HQs | Revenue |
|---|---|---|
| Healthcare | 2 | $407B |
|
||
| Retail | 2 | $150B |
|
||
| Consumer Goods | 2 | $32B |
|
||
| Industrial Machinery | 2 | $6B |
|
||
| Agriculture | 1 | $40B |
|
||
| Healthcare / Medical Devices | 1 | $32B |
|
||
Price history
+103.3% since first listed26 events — show timeline
- 2026-06-08 Listed $61,000 NORTHSTARMLS as Distributed by MLS Grid
- 2016-12-14 Sold (Public Records) $78,088 Public Records
- 2016-10-26 Sold (MLS) $78,000 NORTHSTARMLS as Distributed by MLS Grid
- 2016-09-29 Pending — NORTHSTARMLS as Distributed by MLS Grid
- 2016-09-12 Contingent — NORTHSTARMLS as Distributed by MLS Grid
- 2016-09-09 Price Changed $78,000 NORTHSTARMLS as Distributed by MLS Grid
- 2016-08-12 Listed $82,000 NORTHSTARMLS as Distributed by MLS Grid
- 2014-08-20 Sold (Public Records) $67,000 Public Records
- 2014-07-25 Sold (MLS) $67,000 LSAR
- 2014-07-25 Sold (MLS) $67,000 RASM
- 2014-07-25 Sold (MLS) $67,000 NORTHSTARMLS as Distributed by MLS Grid
- 2014-06-03 Pending — NORTHSTARMLS as Distributed by MLS Grid
- 2014-06-03 Contingent — NORTHSTARMLS as Distributed by MLS Grid
- 2014-06-03 Listing Removed — NORTHSTARMLS as Distributed by MLS Grid
- 2014-06-03 Price Changed $75,000 NORTHSTARMLS as Distributed by MLS Grid
- 2014-06-03 Relisted — NORTHSTARMLS as Distributed by MLS Grid
- 2014-05-01 Price Changed $79,999 NORTHSTARMLS as Distributed by MLS Grid
- 2014-02-19 Listed $82,000 NORTHSTARMLS as Distributed by MLS Grid
- 2014-02-19 Listed $75,000 LSAR
- 2014-02-19 Listed $75,000 RASM
- 1996-09-18 Sold (Public Records) $47,200 Public Records
- 1996-07-25 Sold (Public Records) $32,000 Public Records
- 1996-07-25 Sold (MLS) $47,200 NORTHSTARMLS as Distributed by MLS Grid
- 1996-05-20 Listing Removed — NORTHSTARMLS as Distributed by MLS Grid
- 1996-04-15 Listed $49,900 NORTHSTARMLS as Distributed by MLS Grid
- 1992-05-27 Sold (Public Records) $30,000 Public Records
Property tax history
+17.6%/yrLatest (2025): $6,024 · +4.0% YoY. Source: county tax records.
Cash-flow waterfall
monthlySold comps — $/sqft
last 12 mo · ≤1 miLoading sold comps…