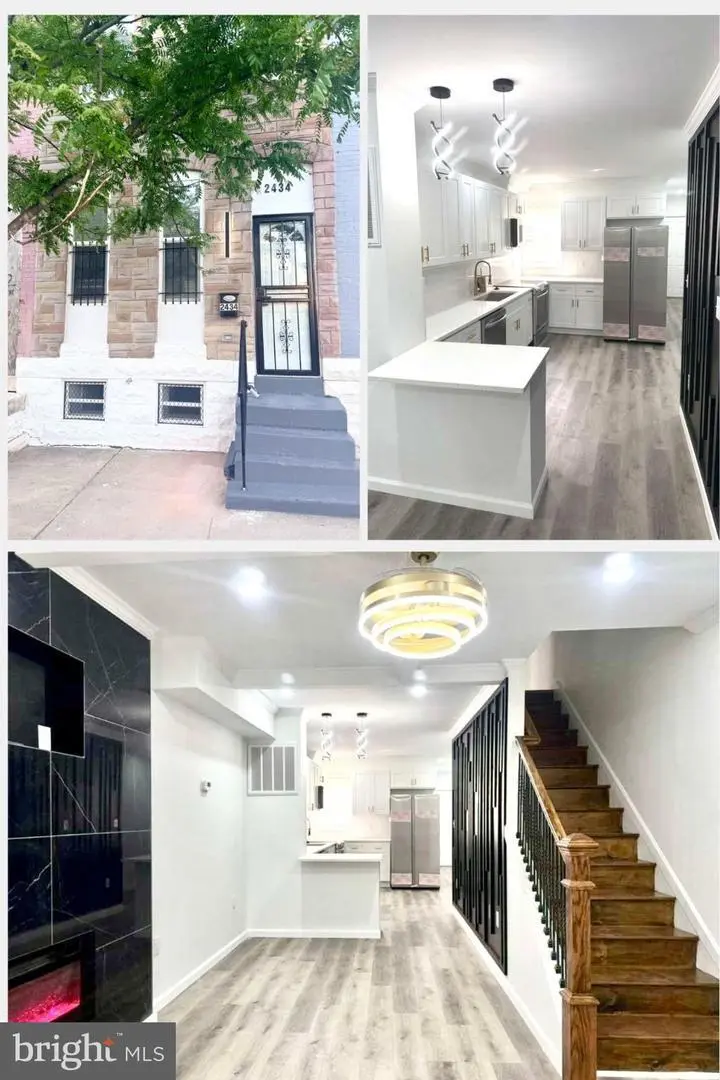
2434 Brentwood · Baltimore, MD
Flood risk 1/10 · Minimal
- FEMA flood zone
- X (unshaded)
- Chance of flooding over 30 yrs
- 0.0%
- Est. flood insurance / yr
- $473 – $860
Fire risk 1/10 · Minimal
- Est. fire insurance / yr
- $755 – $1,403
Heat risk 7/10 · Major
- Hot days now (above 103°F)
- 7 days/yr
- Hot days in 30 yrs
- 15 days/yr
Wind risk 6/10 · Moderate
- Chance of severe wind over 30 yrs
- 27.0%
Air-quality risk 4/10 · Minor
- Unhealthy air days now
- 6 days/yr
- Unhealthy air days in 30 yrs
- 7 days/yr
Risk factors via First Street. Map © Google.
Why this score? — see what drove the D grade
The composite is a weighted blend of 9 inputs, each scored 0–100. Each bar is that input's sub-score; the figure is the points it added to the 100-point composite (weight × sub-score).
- Cash flow +14.6/30.0
- ARV discount +9.3/15.0
- DSCR +4.5/10.0
- 1% rule +4.1/10.0
- Livability +3.8/5.0
- Rent growth +2.9/5.0
- Condition / age +2.5/5.0
- Schools +1.0/10.0
- Appreciation +0.0/10.0
$250,000
🖨 Deal sheet (PDF) 📄 Offer letter ✓ Due diligence
Listing remarks MLS
Needs work - sold as is
Key facts
- Built 1900
- Listed 31 days
Property features AI
Exterior
- Parking: On-street parking; Off-street parking
- Utilities: Public water; Public sewer; Electric heating, cooling, and hot water
- Home design: Interior townhouse / rowhouse; Fee simple ownership; Excellent condition; Major remodel/renovation in 2026 (effective year)
- Construction: Brick and frame construction; CPVC/PVC plumbing rough-in; Tile; Block foundation; Fully finished basement with interior access and outside/rear entrance; Basement includes sump pump
- Exterior features: Deck(s); Exterior lighting and flood lights; Chain link fencing
Interior
- Kitchen: Built-in microwave; Built-in range / electric oven; Dishwasher; Disposal; Refrigerator; Stainless steel appliances; Exhaust fan
- Bedrooms: Three bedrooms on the first upper level
- Flooring: Luxury vinyl plank
- Bathrooms: One full bathroom on the upper level; One half bathroom on the main level
- Heating & cooling: Central heating (electric); Central air conditioning with ceiling fans
- Interior features: Open floor plan with eat-in kitchen and breakfast area; Recessed lighting; Crown moldings; Ceiling fan(s); Tray ceilings; Upgraded countertops; Tub/shower
- Laundry & utility: Washer and electric dryer in unit (main floor laundry); Water heater
Neighborhood map
What this means for you Summary
Snapshot
- This is a 3-bed/1.5-bath townhouse listed at $250k.
Deal economics
- At list price, monthly cash flow is $60 ($719/yr) — positive.
- The deal already cash-flows at list — no discount required.
- To meet the 1% rule (rent ≥ 1% of price), the offer needs to be $226k (9.5% below list).
- Recommended offer: $226k (9.5% below list) — sets the bar for 1% rule.
Location & tenants
- Location reads 76/100 on livability (#90 in MD, #3,396 nationally) — a middle-class / working-renter tenant base. Strengths: amenities A+, commute A+, housing A+; Watch: crime F.
- Baltimore City Public Schools (urban): math 7% / reading 16% proficiency, ranked #24 of 24 in MD (top 100%) — low school quality limits family demand, transient renter base, plan for 1-2y turnover; 79% free/reduced lunch — lower-income household profile, screen leases tightly.
- Zoned schools: Elmer A. Henderson: A Johns Hopkins Partnership (math 2% / reading 16%, grade F, #650 of 860 statewide, top 77%, 642 students, 80% FRL); Baltimore Polytechnic Institute (math 71% / reading 84%, grade A-, #22 of 222 statewide, top 10%, 1,555 students, 43% FRL) — zoned schools average 62% FRL vs 79% district-wide (17 pts lower); this property's tenant base skews higher-income than the district average.
- Zoned-school proficiency averages 43% at this address vs 12% district-wide (+32 pts) — the actual schools serving this property are materially stronger than the Baltimore City Public Schools average implies; a family-tenant draw the district grade alone would hide.
- Market conditions: Rents rising (+1.6%/yr); 330 active listings in the ZIP; 40 comparable units currently listed for rent nearby; rentals at typical pace (median 26d on market — plan ~3-4 weeks tenant-placement turnaround); 1,273 units permitted in Baltimore city in 2024 (1,104 in 5+ unit buildings).
- This rent runs 43% of the median local income ($62k/yr) — at the standard rent-burdened threshold; future hikes will face affordability resistance.
Forward outlook
- Local home prices are declining (-3.0%/yr); year-one equity from $2k of loan paydown is wiped out by about $8k of value loss. Plan a longer hold.
- Baltimore County population projected to shrink 4% by 2050 — rents likely to lag national; underwrite the cash flow, not the appreciation.
Negotiation context
- It's been on market 31 days — a 3% lower offer ($242k) is reasonable based on typical stale-listing flexibility.
- 3 sale attempts since 2y ago with the ask held roughly flat each time — persistent listings suggest the price (not the market) is what's stuck; bring a comps-based counter.
- Current owner paid $60k; list at $250k implies a 317% gain — meaningful room to come down on a strong offer.
Risks & watch-outs
- Watch-outs: built in 1900 — expect roof / HVAC / electrical / plumbing capex.
- Climate carrying-cost: major wind risk, 27% chance of damaging wind over 30y; extreme-heat days projected 7→15/yr by 2055 (HVAC capex compounding) — expect insurance premiums to compound above CPI over the hold.
Questions for the listing agent
- It's been on market 31 days. Have you received any prior offers? Is the seller open to a 9% concession, seller financing, or rate buy-down credit?
- Built in 1900 — when were the roof, HVAC, electrical panel, plumbing, and water heater last replaced?
- Is there a deadline driving the sale (1031 exchange, divorce, estate, relocation)? That informs how much negotiation room exists.
- Schools are D-rated, which usually means shorter tenancies and higher turnover. Who's the typical renter profile here, and what's been the actual vacancy rate?
- Crime grade is F in this area — have there been break-ins, vandalism, or insurance claims at this property in the last 3 years? What carrier currently insures it and at what premium?
- The area grade is low — what's the realistic commute time and amenity access for the typical tenant pool here? Any planned neighborhood developments (good or bad) we should know about?
- What's the average days-on-market for RENTAL listings here right now (not sales)? A rising rental-DOM trend means longer vacancies and softer asking-rent achievability than the comps imply.
- What's the recent tenant-quality profile in this submarket — average credit score on applications, eviction rate, late-payment / NSF rate, and stable-employment percentage? A property-management company in the area should have these aggregated.
- How much new for-sale + rental construction is in the pipeline within 1–3 miles? Heavy new supply typically softens prices + rents 12–24 months out; constrained supply supports both.
Investment metrics
- 1% rule
- 0.91% ✗
- Cap rate
- 6.58%
- Cash-on-cash
- 1.03%
- DSCR
- 1.05
- GRM
- 9.2
CMA / ARV
- ARV (median comp)
- $260,128
- List price
- $250,000
- Delta
- -3.89%
- Verdict
- FAIR
- Comps
- 20 within 1.0 mi
Show comp detail 12 sales within ~0.75 mi
| Address | Dist | Beds/Ba | Sqft | Sold | Price | $/sf | Match |
|---|---|---|---|---|---|---|---|
| 2419 Brentwood Ave | 0.02mi | 3/1.0 | 1,950 (0%) | 1mo | $50,000 | $26 | 96 |
| 308 E Lorraine Ave | 0.25mi | 3/1.5 | 2,046 (+5%) | 0mo | $330,000 | $161 | 80 |
| 2701 Guilford Ave | 0.30mi | 3/1.5 | 1,862 (-4%) | 2mo | $331,000 | $178 | 77 |
| 517 E 21st St | 0.26mi | 4/2.5 (+1) | 2,070 (+6%) | 4mo | $147,000 | $71 | 65 |
| 2828 Maryland Ave | 0.59mi | 3/1.5 | 2,060 (+6%) | 1mo | $425,000 | $206 | 63 |
| 2227 Cecil Ave | 0.39mi | 3/2.0 | 1,764 (-10%) | 2mo | $195,000 | $111 | 62 |
| 407 Pitman Pl | 0.60mi | 3/4.5 | 1,965 (+1%) | 0mo | $260,000 | $132 | 59 |
| 913 Montpelier St | 0.62mi | 3/1.5 | 2,100 (+8%) | 6mo | $215,000 | $102 | 53 |
| 1118 Montpelier St | 0.66mi | 3/3.5 | 2,033 (+4%) | 2mo | $319,900 | $157 | 52 |
| 217 W 27th St W | 0.58mi | 3/1.5 | 1,694 (-13%) | 2mo | $380,000 | $224 | 49 |
| 2535 N Howard St | 0.49mi | 2/3.0 (-1) | 1,680 (-14%) | 2mo | $288,000 | $171 | 42 |
| 2725 Huntingdon Ave | 0.66mi | 3/2.5 | 1,690 (-13%) | 6mo | $350,000 | $207 | 38 |
Match score weights: distance 35% · size 25% · config 20% · recency 20%. Top-matched comps best support the ARV.
Projected returns pro-forma
-3.0% appreciation · 1.63% rent growth · sell at horizon
- IRR
- -16.2%
- Equity multiple
- 0.43×
- Total profit
- $-39,735
- Equity at exit
- $37,276
- IRR
- -10.5%
- Equity multiple
- 0.40×
- Total profit
- $-41,829
- Equity at exit
- $21,615
Cash invested: $70,000 (down + closing). Projections, not guarantees.
Landlord ↔ Tenant lean methodology
- Overall (CITY)
- 12 Strongly Tenant-Friendly
- State Maryland
- 27 Tenant-Leaning · D+14
- County
- — inherits STATE
- City Baltimore
- 12 Strongly Tenant-Friendly · D+58
ZIP-level market 21218
- Rents YoY
- 1.6%
- Active inventory
- 330
- Price-to-rent
- 9.2×
Monthly cashflow live
- Estimated rent
- $2,263 high interval (Pro) →
- Mortgage (P&I)
- −$1,311
- Tax est. 1.5%
- −$312 /mo · $3,750/yr
- Insurance
- −$104
- HOA
- −$0
- Vacancy / Maint / Mgmt
- −$475
- Net cashflow
- $60
Break-even live
Sensitivity live
| Price | -10% $233 | -5% $146 | +0% $60 | +5% $-26 | +10% $-113 |
|---|---|---|---|---|---|
| Rent | -10% $-119 | -5% $-29 | +0% $60 | +5% $149 | +10% $239 |
| Rate | -1.0pp $186 | -0.5pp $124 | base $60 | +0.5pp $-5 | +1.0pp $-71 |
UW: 25.0% down · 7.5% · 30yr · 1.5% tax · 5.0% vac · 8.0% maint · 8.0% mgmt
Financing live
Cash to close
- Down payment
- $62,500
- Closing costs
- $7,500
- Reserves months
- —
- Total cash needed
- —
Loan-product check · same deal, 3 products live
Conventional
25% down · 7.5% · 30yr
- Down + closing
- —
- Monthly P&I
- —
- Monthly cashflow
- —
- DSCR
- —
- Eligible?
- —
Personal DTI + credit; lowest rate.
DSCR
20% down · 8.5% · 30yr
- Down + closing
- —
- Monthly P&I
- —
- Monthly cashflow
- —
- DSCR
- —
- Eligible?
- —
No personal income docs; deal must DSCR.
Hard money
10% down · 12.0% · 12mo
- Down + closing
- —
- Monthly P&I
- —
- Monthly cashflow
- —
- DSCR
- —
- Eligible?
- —
Short-term bridge; refi at stabilization.
Rent comps 40 comps
| Address | Beds | Baths | Sqft | Rent | $/sqft | DOM | Units | Dist |
|---|---|---|---|---|---|---|---|---|
| 324 E 23rd St Baltimore, MD | 3.0 | 1.5 | 2018 | $2,200 | $1.09 | 25d | 1 | 0.11mi |
| 312 E 25th St Baltimore, MD | 4.0 | 3.5 | 1960 | $2,800 | $1.43 | 45d | 1 | 0.11mi |
| 534 E 23rd St Baltimore, MD | 3.0 | 2.5 | 1700 | $2,350 | $1.38 | 45d | 1 | 0.17mi |
| 411 E Lorraine Ave Baltimore, MD | 3.0 | 1.5 | 1344 | $2,200 | $1.64 | 25d | 1 | 0.20mi |
| 2300 N Calvert St Baltimore, MD | 1.0–2.0 | 1.0–2.0 | 1100 | $1,995 | $1.81 | 4d | 2 | 0.21mi |
| 400 E Lorraine Ave Baltimore, MD | 3.0 | 1.0 | 1500 | $1,800 | $1.20 | 22d | 1 | 0.22mi |
| 428 E Lorraine Ave Baltimore, MD | 3.0 | 2.0 | 1344 | $1,875 | $1.40 | 25d | 1 | 0.22mi |
| 428 E Lorraine Ave Unit 1 Baltimore, MD | 3.0 | 1.5 | 1344 | $1,875 | $1.40 | 45d | 1 | 0.22mi |
| 450 E Lorraine Ave Baltimore, MD | 3.0 | 1.0 | 1344 | $1,695 | $1.26 | 45d | 1 | 0.23mi |
| 402 E 28th St Baltimore, MD | 3.0 | 1.0 | 1436 | $2,200 | $1.53 | 45d | 1 | 0.37mi |
| 519 E 28th St Baltimore, MD | 3.0 | 2.0 | 1500 | $2,000 | $1.33 | 6d | 1 | 0.37mi |
| 424 Ilchester Ave Baltimore, MD | 3.0 | 3.0 | 1976 | $1,800 | $0.91 | 16d | 1 | 0.41mi |
| 1827 Guilford Ave Unit G-1813 Baltimore, MD | 3.0 | 3.5 | 1920 | $2,750 | $1.43 | 0d | 1 | 0.44mi |
| 1827 Guilford Ave Unit G-1809 Baltimore, MD | 3.0 | 3.5 | 1920 | $2,750 | $1.43 | 25d | 1 | 0.44mi |
| 1823 Guilford Ave Unit G-1823 Baltimore, MD | 3.0 | 3.5 | 1920 | $2,750 | $1.43 | 45d | 1 | 0.45mi |
| 1813 Guilford Ave Unit G-1813 Baltimore, MD | 3.0 | 3.5 | 1920 | $2,750 | $1.43 | 45d | 1 | 0.46mi |
| 1809 Guilford Ave Unit G-1809 Baltimore, MD | 3.0 | 3.5 | 1920 | $2,750 | $1.43 | 45d | 1 | 0.46mi |
| 1807 Guilford Ave Unit G-1807 Baltimore, MD | 3.0 | 3.5 | 1920 | $2,750 | $1.43 | 45d | 1 | 0.46mi |
| 1801 Guilford Ave Baltimore, MD | 3.0 | 3.5 | 1921 | $2,595 | $1.35 | 25d | 3 | 0.48mi |
| 411 E Lafayette Ave Baltimore, MD | 3.0 | 2.5 | 2450 | $2,900 | $1.18 | 25d | 1 | 0.49mi |
| 1824 Saint Paul St Unit 3 Baltimore, MD | 2.0 | 1.0 | 2397 | $1,275 | $0.53 | 45d | 1 | 0.50mi |
| 2641 N Howard St Baltimore, MD | 4.0 | 3.5 | 1344 | $2,800 | $2.08 | 25d | 1 | 0.52mi |
| 412 E Lanvale St Baltimore, MD | 3.0 | 2.0 | 1600 | $3,100 | $1.94 | 6d | 1 | 0.54mi |
| 325 W Lorraine Ave Baltimore, MD | 3.0 | 1.0 | 1470 | $3,150 | $2.14 | 6d | 1 | 0.56mi |
| 1643 Guilford Ave Baltimore, MD | 3.0 | 3.5 | 2273 | $3,200 | $1.41 | 45d | 1 | 0.57mi |
| 437 Pitman Pl Baltimore, MD | 2.0 | 3.0 | 1520 | $1,650 | $1.09 | 6d | 1 | 0.60mi |
| 456 E Federal St Baltimore, MD | 2.0 | 2.0 | 1450 | $1,850 | $1.28 | 45d | 1 | 0.62mi |
| 458 E Federal St Baltimore, MD | 2.0 | 2.5 | 1300 | $1,850 | $1.42 | 5d | 1 | 0.62mi |
| 415 E Federal St Baltimore, MD | 2.0 | 1.5 | 1450 | $1,800 | $1.24 | 0d | 1 | 0.64mi |
| 936 Montpelier St Baltimore, MD | 2.0 | 1.0 | 1260 | $1,450 | $1.15 | 25d | 1 | 0.66mi |
| 2328 Aiken St Baltimore, MD | 3.0 | 1.0 | 1406 | $1,650 | $1.17 | 0d | 1 | 0.69mi |
| 1333 E North Ave Baltimore, MD | 4.0 | 2.5 | 1860 | $2,200 | $1.18 | 25d | 1 | 0.70mi |
| 3214 Abell Ave Baltimore, MD | 3.0 | 1.5 | 2300 | $2,800 | $1.22 | 25d | 1 | 0.73mi |
| 1243 E Lanvale St Baltimore, MD | 3.0 | 1.5 | 1281 | $1,750 | $1.37 | 18d | 1 | 0.76mi |
| 1243 E Lanvale St Baltimore, MD | 3.0 | 1.5 | 1281 | $1,750 | $1.37 | 4d | 1 | 0.76mi |
| 2624 Garrett Ave Baltimore, MD | 3.0 | 1.0 | 1400 | $1,750 | $1.25 | 0d | 1 | 0.76mi |
| 315 W 30th St Baltimore, MD | 3.0 | 3.0 | 1250 | $2,450 | $1.96 | 18d | 1 | 0.77mi |
| 3201 Saint Paul St Baltimore, MD | 1.0–2.0 | 1.5–2.0 | 1532 | $3,200 | $2.09 | 0d | 2 | 0.78mi |
| 1312 Guilford Ave Baltimore, MD | 1.0–2.0 | 1.0–2.0 | 1040 | $1,850 | $1.78 | 45d | 6 | 0.82mi |
| 348 E University Pkwy Baltimore, MD | 4.0 | 2.0 | 1809 | $2,400 | $1.33 | 45d | 1 | 0.82mi |
Listing history 16 events
-
2026-06-07days on market $250,000 Active 31 DOM
-
2026-06-04days on market $250,000 Active 28 DOM
-
2026-06-03days on market $250,000 Active 27 DOM
-
2026-06-02days on market $250,000 Active 26 DOM
-
2026-06-01days on market $250,000 Active 25 DOM
-
2026-05-31days on market $250,000 Active 24 DOM
-
2026-05-08$250,000 Active 2253-char remark
-
2026-05-07historical $250,000 2253-char remark
-
2026-02-20soldstatus $60,000
-
2026-02-02soldstatus $60,000 Closed 23-char remark
Show marketing remark (23 chars)
Needs work - sold as is
-
2026-01-11status Pending 23-char remark
Show marketing remark (23 chars)
Needs work - sold as is
-
2025-12-12$65,000 Active 23-char remark
Show marketing remark (23 chars)
Needs work - sold as is
-
2025-12-11historical $65,000 23-char remark
Show marketing remark (23 chars)
Needs work - sold as is
-
2024-05-17status Pending
-
2024-05-17historical
-
2024-05-15$214,900 Active
ⓘ Source: listings_history table (triggers on properties + properties_extension) + one-shot
backfill from property_details.listing_events for pre-trigger history.
Climate risk First Street
- Flood 1/10 Low FEMA zone X (unshaded) · 0% chance over 30 yrs
- Wildfire 1/10 Low
- Heat 7/10 Severe 7 d/yr ≥103°F today · 15 d/yr by 30 yrs out
- Wind 6/10 Major 27% chance of damaging wind over 30 yrs
- Air quality 4/10 Moderate 6 unhealthy d/yr today · 7 by 30 yrs out
Nearby sold comps map
Loading sold comps map…
Walkable amenities ~0.75 mi
Loading nearby amenities…
Taxation est. · year 1
- Rental income
- $27,154
- − Mortgage interest
- −$14,004
- − Property taxes
- −$3,750
- − Insurance
- −$1,250
- − Repairs & maintenance
- −$2,172
- − Management
- −$2,172
- − Depreciation
- −$7,273
- Taxable loss
- −$3,467
- Est. tax savings @ 24.0%
- +$832
- After-tax cash flow
- $1,552/yr
For passive investors: Depreciation is non-cash, so a rental often shows a tax loss while cash-flowing — sheltering income. Rental losses are passive: they offset passive income freely, and up to $25,000/yr can offset ordinary (W-2) income if you actively participate and your MAGI is under $100k (phasing out to $0 by $150k); unused losses carry forward. On sale, claimed depreciation is recaptured at up to 25%, and gains may owe capital-gains tax (a 1031 exchange can defer both). Figures are a year-1 estimate at your 24.0% rate — not tax advice; consult a CPA.
Schools (NCES district)
- District
- Baltimore City Public Schools
- NCES district ID
- 2400090
- Math proficiency
- 7% ▼ -9.00%
- Reading proficiency
- 16% ▼ -5.00%
- Median HH income
- $42,108
- Composite
- 10.08/100
- National rank
- #9805
- State rank
- #24 of 24 in MD
Livability — Baltimore
- Score
- 76/100
- State rank
- #90
- US rank
- #3396
Category grades
Schools grade is shown separately in the Schools card above.
Census & demographics
- Census place
- Baltimore, MD
- County
- Baltimore City · 558,601 people
- City population
- 588,727
- Metro
- Baltimore-Columbia-Towson, MD
- Population (ZIP)
- 44,014
- Household income
- $62,488
- Rent vs Own
- Severe rent burden
- 2564.0
Population outlook (Baltimore County) Hauer SSP2
- Today (2025)
- 624,249 people
- By 2030
- 621,541 · -0.4%
- By 2040
- 609,756 · -2.3%
- By 2050
- 597,249 · -4.3%
- By 2075
- 552,236 · -11.5%
- By 2100
- 513,934 · -17.7%
Race, ethnicity, and origin ACS 2023
- Neighborhood character
- Diverse neighborhood (Simpson 0.58)
- Race & ethnicity
- Black 60% White 26% Two or more races 6% Hispanic / Latino 5% Asian 5%
- Hispanic origin (detail)
- Common ancestry
- Romanian 2% Italian 1% Scotch-Irish 1%
- Foreign-born
- 10% · Canada, China, South Korea
- Languages at home
- 87% English-only · Spanish 4% French/Haitian/Cajun 2% Chinese 2%
Political lean MEDSL · Baltimore
- 2024 margin
- Solid D (+73.0) · D 85.2% · R 12.2% · Other 2.6%
- 2008→2024 swing
- -2.5pp toward R · 2008: 75.5pp · 2024: 73.0pp
- All cycles
- 2024: D+73.0 2020: D+76.6 2016: D+74.6 2012: D+76.4 2008: D+75.5
Not yet ingested
- Civics
- —
Market trends
- HPI YoY
- ▼ -463.14%
- Current HPI
- 292.3986
- Rent YoY
- ▲ 1.63%
- Metro
- Baltimore-Columbia-Towson, MD
- State GDP YoY
- ▲ 2.97%
- F500 in state
- 12
Industry mix (Fortune 500 HQ in MD)
| Industry | F500 HQs | Revenue |
|---|---|---|
| Aerospace / Defense | 1 | $71B |
|
||
| Utilities | 1 | $25B |
|
||
| Hotels | 1 | $24B |
|
||
| Consumer Goods | 1 | $7B |
|
||
| Real Estate | 1 | $6B |
|
||
| Chemicals | 1 | $2B |
|
||
Price history
+16.3% since first listed11 events — show timeline
- 2026-06-08 Listing Removed — BRIGHT MLS
- 2026-05-08 Listed $250,000 BRIGHT MLS
- 2026-05-07 Coming Soon — BRIGHT MLS
- 2026-02-20 Sold (Public Records) $60,000 Public Records
- 2026-02-02 Sold (MLS) $60,000 BRIGHT MLS
- 2026-01-11 Pending — BRIGHT MLS
- 2025-12-12 Listed $65,000 BRIGHT MLS
- 2025-12-11 Coming Soon $65,000 BRIGHT MLS
- 2024-05-17 Pending — BRIGHT MLS
- 2024-05-17 Listing Removed — BRIGHT MLS
- 2024-05-15 Listed $214,900 BRIGHT MLS
Property tax history
-6.0%/yrLatest (2025): $352 · +28.6% YoY. Source: county tax records.
Cash-flow waterfall
monthlySold comps — $/sqft
last 12 mo · ≤1 miLoading sold comps…