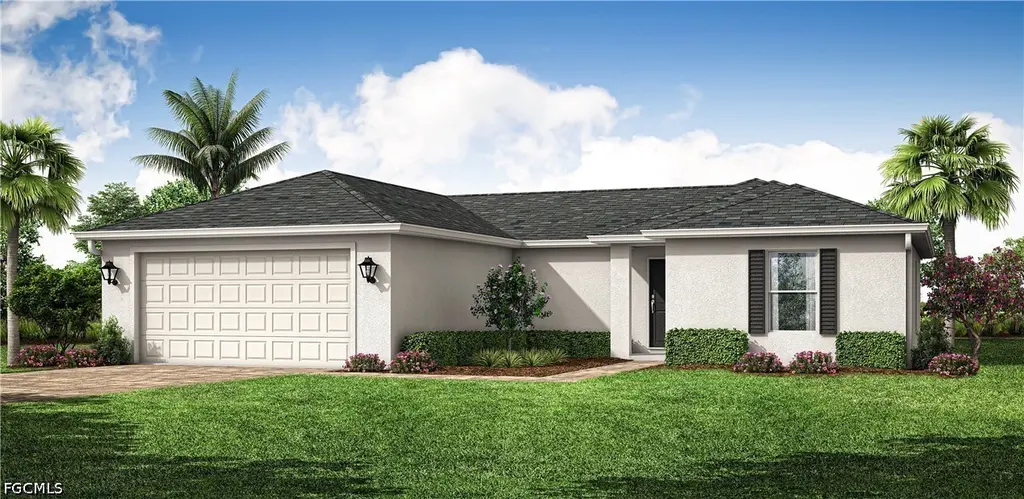
2135 NE 35th St · Cape Coral, FL
Flood risk 4/10 · Minor
- FEMA flood zone
- X (unshaded)
- Chance of flooding over 30 yrs
- 0.22%
- Est. flood insurance / yr
- $507 – $1,088
Fire risk 5/10 · Moderate
- Est. fire insurance / yr
- $947 – $1,759
Heat risk 10/10 · Severe
- Hot days now (above 107°F)
- 7 days/yr
- Hot days in 30 yrs
- 31 days/yr
Wind risk 10/10 · Severe
- Chance of severe wind over 30 yrs
- 99.0%
Air-quality risk 2/10 · Minimal
- Unhealthy air days now
- 1 days/yr
- Unhealthy air days in 30 yrs
- 1 days/yr
Risk factors via First Street. Map © Google.
Why this score? — see what drove the D- grade
The composite is a weighted blend of 9 inputs, each scored 0–100. Each bar is that input's sub-score; the figure is the points it added to the 100-point composite (weight × sub-score).
- Cash flow +13.8/30.0
- ARV discount +7.5/15.0
- DSCR +4.2/10.0
- Schools +4.1/10.0
- Livability +3.9/5.0
- 1% rule +2.6/10.0
- Condition / age +2.5/5.0
- Rent growth +1.1/5.0
- Appreciation +0.0/10.0
$294,990
🖨 Deal sheet (PDF) 📄 Offer letter ✓ Due diligence
Listing remarks
NEW BUILD - Anticipated completion date is JUNE, 2026. WAS $304,990 - NOW $294,990. SPECIAL INCENTIVES: UP to $20K toward closing cost when using a preferred lender. The 1,426 -square-foot (air-conditioned) Windsor plan boasts a well-designed open floor plan that includes four bedrooms, two bathrooms, and a two-car garage. The kitchen boasts upgraded 30” contemporary shaker-style cabinets, a spacious kitchen island with upgraded quartz countertops, Whirlpool dishwasher, microwave, and range, refrigerator, washer & dryer. The Kitchen overlooks a spacious great room that features beautiful tile-plank flooring and vaulted ceilings. The expansive owner’s suite features a priv
Key facts
- Open floor plan
- Quartz countertops
- Vaulted ceilings
Tags
Property features AI
Finance
- Financial info: Pets allowed
- HOA & community: No association fee
Exterior
- Parking: Attached garage; 2 covered garage spaces
- Security: Security/high impact doors
- Utilities: Cable available; Septic tank; Well water
- Home design: Single-story; Under construction; Faces south; Entry level 1; R1-D zoning
- Construction: Block, concrete and stucco construction; Shingle roof; Built on foundation (standard)
- Exterior features: Open porch; Security/high impact doors
Interior
- Kitchen: Pantry
- Bedrooms: Bedrooms on entry level
- Flooring: Carpet; Tile
- Bathrooms: 2 full bathrooms
- Heating & cooling: Central electric heating; Central electric cooling
- Interior features: High ceilings; Pantry; Cable TV ready; Walk-in closet(s); Split bedroom floorplan; Family/Dining room combination; Living/Dining room
- Laundry & utility: Laundry inside
Neighborhood map
What this means for you Summary
Snapshot
- This is a 4-bed/2.0-bath land listed at $295k.
Deal economics
- At list price, monthly cash flow is $26 ($307/yr) — positive.
- The deal already cash-flows at list — no discount required.
- To meet the 1% rule (rent ≥ 1% of price), the offer needs to be $224k (24.1% below list).
- Recommended offer: $224k (24.1% below list) — sets the bar for 1% rule.
- Cap rate 6.4% vs local median 3.1% in Cape Coral — top-decile yield for the area; either an underpriced asset or a hidden risk that comps aren't pricing in. Stress-test before assuming the spread holds.
Location & tenants
- Location reads 77/100 on livability (#208 in FL, #3,098 nationally) — a middle-class / working-renter tenant base. Strengths: housing A+, health & safety A+, amenities B+; Watch: commute F.
- Lee (suburban): math 47% / reading 50% proficiency, ranked #42 of 73 in FL (top 58%) — families likely to look elsewhere, expect single-tenant / working-renter base with shorter leases.
- Zoned schools: Diplomat Elementary School (math 67% / reading 60%, grade B, #564 of 2,144 statewide, top 27%, 1,069 students, 56% FRL); Mariner Middle School (math 50% / reading 47%, grade C-, #274 of 571 statewide, top 50%, 1,001 students, 53% FRL); Ida S. Baker High School (math 44% / reading 47%, grade D-, #223 of 667 statewide, top 34%, 1,933 students, 39% FRL).
- Market conditions: Rents falling (-5.6%/yr); 1604 active listings in the ZIP; 40 comparable units currently listed for rent nearby; rentals at typical pace (median 18d on market — plan ~3-4 weeks tenant-placement turnaround); 15,411 units permitted in Lee County in 2024 (4,686 in 5+ unit buildings).
- This rent runs 37% of the median local income ($73k/yr) — at the standard rent-burdened threshold; future hikes will face affordability resistance.
Forward outlook
- Local home prices are declining (-3.0%/yr); year-one equity from $2k of loan paydown is wiped out by about $9k of value loss. Plan a longer hold.
- Lee County population projected at +44% by 2050 — long-run rental-demand tailwind backs the buy-and-hold thesis.
Negotiation context
- It's been on market 59 days — a 3% lower offer ($286k) is reasonable based on typical stale-listing flexibility.
- Current owner paid $36k; list at $295k implies a 731% gain — meaningful room to come down on a strong offer.
Risks & watch-outs
- Climate carrying-cost: severe wind risk, 99% chance of damaging wind over 30y; moderate wildfire risk; extreme-heat days projected 7→31/yr by 2055 (HVAC capex compounding) — expect insurance premiums to compound above CPI over the hold.
Questions for the listing agent
- It's been on market 59 days. Have you received any prior offers? Is the seller open to a 24% concession, seller financing, or rate buy-down credit?
- Is there a deadline driving the sale (1031 exchange, divorce, estate, relocation)? That informs how much negotiation room exists.
- Schools are B-rated — typically a magnet for longer-tenancy family renters. What's the average tenant stay here, and is there a school-zone premium baked into asking?
- The area grade is low — what's the realistic commute time and amenity access for the typical tenant pool here? Any planned neighborhood developments (good or bad) we should know about?
- What's the average days-on-market for RENTAL listings here right now (not sales)? A rising rental-DOM trend means longer vacancies and softer asking-rent achievability than the comps imply.
- What's the recent tenant-quality profile in this submarket — average credit score on applications, eviction rate, late-payment / NSF rate, and stable-employment percentage? A property-management company in the area should have these aggregated.
- How much new for-sale + rental construction is in the pipeline within 1–3 miles? Heavy new supply typically softens prices + rents 12–24 months out; constrained supply supports both.
Investment metrics
- 1% rule
- 0.76% ✗
- Cap rate
- 6.40%
- Cash-on-cash
- 0.37%
- DSCR
- 1.02
- GRM
- 11.0
CMA / ARV
No comps found within radius.
Projected returns pro-forma
-3.0% appreciation · 0.0% rent growth · sell at horizon
- IRR
- -18.7%
- Equity multiple
- 0.36×
- Total profit
- $-52,878
- Equity at exit
- $43,984
- IRR
- -17.5%
- Equity multiple
- 0.15×
- Total profit
- $-69,895
- Equity at exit
- $25,505
Cash invested: $82,597 (down + closing). Projections, not guarantees.
Landlord ↔ Tenant lean methodology
- Overall (STATE)
- 87 Strongly Landlord-Friendly
- State Florida
- 87 Strongly Landlord-Friendly · R+3
- County
- — inherits STATE
- City
- — inherits STATE
ZIP-level market 33909
- Home prices YoY
- -23.1%
- Rents YoY
- -5.6%
- Active inventory
- 1604
- Price-to-rent
- 11.0×
Monthly cashflow live
- Estimated rent
- $2,238 high interval (Pro) →
- Mortgage (P&I)
- −$1,547
- Tax from tax record
- −$72 /mo · $870/yr
- Insurance
- −$123
- HOA
- −$0
- Vacancy / Maint / Mgmt
- −$470
- Net cashflow
- $26
Break-even live
Sensitivity live
| Price | -10% $193 | -5% $109 | +0% $26 | +5% $-58 | +10% $-141 |
|---|---|---|---|---|---|
| Rent | -10% $-151 | -5% $-63 | +0% $26 | +5% $114 | +10% $202 |
| Rate | -1.0pp $174 | -0.5pp $101 | base $26 | +0.5pp $-51 | +1.0pp $-129 |
UW: 25.0% down · 7.5% · 30yr · 1.5% tax · 5.0% vac · 8.0% maint · 8.0% mgmt
Financing live
Cash to close
- Down payment
- $73,748
- Closing costs
- $8,850
- Reserves months
- —
- Total cash needed
- —
Loan-product check · same deal, 3 products live
Conventional
25% down · 7.5% · 30yr
- Down + closing
- —
- Monthly P&I
- —
- Monthly cashflow
- —
- DSCR
- —
- Eligible?
- —
Personal DTI + credit; lowest rate.
DSCR
20% down · 8.5% · 30yr
- Down + closing
- —
- Monthly P&I
- —
- Monthly cashflow
- —
- DSCR
- —
- Eligible?
- —
No personal income docs; deal must DSCR.
Hard money
10% down · 12.0% · 12mo
- Down + closing
- —
- Monthly P&I
- —
- Monthly cashflow
- —
- DSCR
- —
- Eligible?
- —
Short-term bridge; refi at stabilization.
Rent comps 40 comps
| Address | Beds | Baths | Sqft | Rent | $/sqft | DOM | Units | Dist |
|---|---|---|---|---|---|---|---|---|
| 2217 NE 33rd Ln Cape Coral, FL | 3.0 | 2.0 | 1706 | $2,650 | $1.55 | 25d | 1 | 0.25mi |
| 3527 NE 19th Pl Cape Coral, FL | 3.0 | 2.0 | 1574 | $2,000 | $1.27 | 25d | 1 | 0.34mi |
| 2213 NE 33rd St Cape Coral, FL | 3.0 | 2.0 | 1385 | $1,800 | $1.30 | 25d | 1 | 0.38mi |
| 3603 NE 19th Ave Cape Coral, FL | 3.0 | 2.0 | 1147 | $1,750 | $1.53 | 5d | 1 | 0.39mi |
| 2434 Laurentina Ln Cape Coral, FL | 3.0 | 2.5 | 1744 | $1,975 | $1.13 | 25d | 1 | 0.40mi |
| 3622 NE 19th Ave Cape Coral, FL | 3.0 | 2.0 | 1286 | $2,480 | $1.93 | 25d | 1 | 0.46mi |
| 3512 NE 17th Pl Cape Coral, FL | 4.0 | 3.0 | 1650 | $1,995 | $1.21 | 4d | 1 | 0.56mi |
| 3511 NE 17th Ave Cape Coral, FL | 4.0 | 2.0 | 1717 | $2,350 | $1.37 | 21d | 1 | 0.60mi |
| 3141 Amadora Cir Cape Coral, FL | 3.0 | 2.0 | 1816 | $2,295 | $1.26 | 5d | 1 | 0.68mi |
| 3141 Amadora Cir Cape Coral, FL | 3.0 | 2.0 | 1816 | $2,295 | $1.26 | 15d | 1 | 0.68mi |
| 2117 NE 40th St Cape Coral, FL | 3.0 | 3.0 | 1776 | $2,100 | $1.18 | 17d | 1 | 0.75mi |
| 1532 NE 35th St Cape Coral, FL | 4.0 | 2.0 | 1809 | $1,995 | $1.10 | 25d | 1 | 0.75mi |
| 4020 Garden Blvd Cape Coral, FL | 4.0 | 2.0 | 1650 | $1,845 | $1.12 | 23d | 1 | 0.83mi |
| 13700 Oak St North Fort Myers, FL | 1.0–3.0 | 1.0–2.0 | 1023 | $2,465 | $2.41 | 5d | 32 | 0.91mi |
| 3928 NE 17th Ave Cape Coral, FL | 4.0 | 3.0 | 1683 | $2,100 | $1.25 | 25d | 1 | 0.95mi |
| 3440 Cancun Ct Cape Coral, FL | 3.0 | 2.0 | 1747 | $1,950 | $1.12 | 25d | 1 | 1.00mi |
| 4141 NE 19th Pl Cape Coral, FL | 4.0 | 2.0 | 1734 | $1,995 | $1.15 | 16d | 1 | 1.01mi |
| 3420 Cancun Ct Cape Coral, FL | 3.0 | 2.0 | 1747 | $1,895 | $1.08 | 16d | 1 | 1.01mi |
| 1672 Lake Jessup Cir Cape Coral, FL | 3.0 | 2.5 | 1729 | $2,200 | $1.27 | 12d | 1 | 1.05mi |
| 3940 Villa Del Mar CIR Cape Coral, FL | 1.0–3.0 | 1.0–2.0 | 1051 | $2,739 | $2.60 | 3d | 21 | 1.07mi |
| 1541 Fells Cove Ln Unit 1541 Cape Coral, FL | 3.0 | 2.5 | 1657 | $2,400 | $1.45 | 5d | 1 | 1.10mi |
| 1541 Fells Cove Ln Unit 1541 Cape Coral, FL | 3.0 | 2.5 | 1657 | $2,400 | $1.45 | 15d | 1 | 1.10mi |
| 3717 NE 13th Ave Cape Coral, FL | 3.0 | 2.0 | 1408 | $1,795 | $1.27 | 17d | 1 | 1.14mi |
| 1545 Lake Jessup Cir Cape Coral, FL | 3.0 | 2.5 | 1831 | $2,350 | $1.28 | 25d | 1 | 1.14mi |
| 4215 E Gator Cir Cape Coral, FL | 3.0 | 2.0 | 1385 | $1,725 | $1.25 | 5d | 1 | 1.15mi |
| 3223 NE 14th Ave Cape Coral, FL | 4.0 | 3.0 | 1765 | $2,200 | $1.25 | 25d | 1 | 1.15mi |
| 3944 Pomodoro Cir #202 Cape Coral, FL | 3.0 | 2.0 | 1411 | $2,200 | $1.56 | 25d | 1 | 1.18mi |
| 2729 Foralesca Ct Cape Coral, FL | 4.0 | 2.0 | 1828 | $2,300 | $1.26 | 25d | 1 | 1.20mi |
| 2729 Foralesca Ct Cape Coral, FL | 4.0 | 2.0 | 1828 | $2,300 | $1.26 | 5d | 1 | 1.20mi |
| 3953 Pomodoro Cir Cape Coral, FL | 1.0–3.0 | 1.0–2.0 | 1044 | $1,624 | $1.56 | 16d | 9 | 1.22mi |
| 1424 Weeping Willow Ct Cape Coral, FL | 3.0 | 2.5 | 1679 | $1,999 | $1.19 | 25d | 1 | 1.23mi |
| 4309 NE 20th Ct Cape Coral, FL | 4.0 | 2.0 | 1774 | $2,000 | $1.13 | 23d | 1 | 1.24mi |
| 4125 NE 15th Pl Cape Coral, FL | 3.0 | 2.0 | 1556 | $2,000 | $1.29 | 25d | 1 | 1.24mi |
| 2497 Ciales Ct Cape Coral, FL | 3.0 | 2.0 | 1747 | $1,850 | $1.06 | 17d | 1 | 1.27mi |
| 3732 NE 12th Pl Cape Coral, FL | 3.0 | 2.0 | 1408 | $1,950 | $1.38 | 25d | 1 | 1.29mi |
| 3187 Cozumel Ct Cape Coral, FL | 3.0 | 2.0 | 1747 | $2,000 | $1.14 | 4d | 1 | 1.32mi |
| 3153 Cozumel Ct Cape Coral, FL | 3.0 | 2.0 | 1747 | $2,000 | $1.14 | 16d | 1 | 1.41mi |
| 19152 Meadowbrook Ct North Fort Myers, FL | 3.0 | 2.0 | 1251 | $1,499 | $1.20 | 3d | 1 | 1.43mi |
| 1701 NE 44th Ter Cape Coral, FL | 3.0 | 2.0 | 1147 | $1,800 | $1.57 | 15d | 1 | 1.44mi |
| 1701 NE 44th Ter Cape Coral, FL | 3.0 | 2.0 | 1147 | $1,800 | $1.57 | 17d | 1 | 1.44mi |
Listing history 16 events
-
2026-06-13statusdays on market $294,990 Pending 59 DOM
-
2026-06-10pricedays on market $294,990 Active 58 DOM
-
2026-06-09days on market $295,990 Active 57 DOM
-
2026-06-07days on market $295,990 Active 55 DOM
-
2026-06-03pricedays on market $295,990 Active 51 DOM
-
2026-06-02days on market $297,990 Active 50 DOM
-
2026-06-01days on market $297,990 Active 49 DOM
-
2026-05-31days on market $297,990 Active 48 DOM
-
2026-05-21price $299,990
-
2026-05-13price $301,990
-
2026-04-13$304,990 Active
-
2025-10-28soldstatus $35,500
-
2017-07-11soldstatus $15,400
-
2013-09-16price $35,000
-
2004-08-24soldstatus $35,100
-
2004-07-27soldstatus $35,100
ⓘ Source: listings_history table (triggers on properties + properties_extension) + one-shot
backfill from property_details.listing_events for pre-trigger history.
Tax reassessment forecast FL · Resets to sale price
- Current annual tax
- $870 · $72/mo
- Projected year-2 tax
- $2,448 · $204/mo
- Expected delta
- +$1,579/yr (+$132/mo · 181.6%)
ⓘ Screening estimate from a state-policy table — verify with the county assessor before closing.
Climate risk First Street
- Flood 4/10 Moderate FEMA zone X (unshaded) · 22% chance over 30 yrs
- Wildfire 5/10 Major
- Heat 10/10 Extreme 7 d/yr ≥107°F today · 31 d/yr by 30 yrs out
- Wind 10/10 Extreme 99% chance of damaging wind over 30 yrs
- Air quality 2/10 Low 1 unhealthy d/yr today · 1 by 30 yrs out
Nearby sold comps map
Loading sold comps map…
Walkable amenities ~0.75 mi
Loading nearby amenities…
Taxation est. · year 1
- Rental income
- $26,855
- − Mortgage interest
- −$16,524
- − Property taxes
- −$870
- − Insurance
- −$1,475
- − Repairs & maintenance
- −$2,148
- − Management
- −$2,148
- − Depreciation
- −$8,582
- Taxable loss
- −$4,892
- Est. tax savings @ 24.0%
- +$1,174
- After-tax cash flow
- $1,481/yr
For passive investors: Depreciation is non-cash, so a rental often shows a tax loss while cash-flowing — sheltering income. Rental losses are passive: they offset passive income freely, and up to $25,000/yr can offset ordinary (W-2) income if you actively participate and your MAGI is under $100k (phasing out to $0 by $150k); unused losses carry forward. On sale, claimed depreciation is recaptured at up to 25%, and gains may owe capital-gains tax (a 1031 exchange can defer both). Figures are a year-1 estimate at your 24.0% rate — not tax advice; consult a CPA.
Schools (NCES district)
- District
- Lee
- NCES district ID
- 1201080
- Math proficiency
- 47% ▼ -11.00%
- Reading proficiency
- 50% ▼ -4.00%
- Median HH income
- $49,518
- Composite
- 41.49/100
- National rank
- #3458
- State rank
- #42 of 73 in FL
Livability — Cape Coral
- Score
- 77/100
- State rank
- #208
- US rank
- #3098
Category grades
Schools grade is shown separately in the Schools card above.
Census & demographics
- Census place
- Cape Coral, FL
- County
- Lee County · 788,662 people
- City population
- 217,388
- Metro
- Cape Coral-Fort Myers, FL
- Population (ZIP)
- 40,231
- Household income
- $73,053
- Rent vs Own
- Severe rent burden
- 1657.0
Population outlook (Lee County) Hauer SSP2
- Today (2025)
- 871,946 people
- By 2030
- 955,468 · +9.6%
- By 2040
- 1,113,587 · +27.7%
- By 2050
- 1,256,891 · +44.1%
- By 2075
- 1,560,270 · +78.9%
- By 2100
- 1,726,848 · +98.0%
Race, ethnicity, and origin ACS 2023
- Neighborhood character
- Diverse neighborhood (Simpson 0.55)
- Race & ethnicity
- White 56% Hispanic / Latino 36% Two or more races 24% Black 3% Asian 1%
- Hispanic origin (detail)
- Puerto Rican 7% Cuban 14% Dominican 4%
- Common ancestry
- Romanian 2% Lithuanian 2% Serbian 1%
- Foreign-born
- 20% · Canada, Jamaica
- Languages at home
- 69% English-only · Spanish 27% Other Indo-European 1% German/W. Germanic 1%
Political lean MEDSL · Lee
- 2024 margin
- Strong R (+28.4) · D 35.5% · R 63.9%
- 2008→2024 swing
- -18.0pp toward R · 2008: -10.4pp · 2024: -28.4pp
- All cycles
- 2024: R+28.4 2020: R+19.2 2016: R+20.4 2012: R+16.6 2008: R+10.4
Not yet ingested
- Civics
- —
Market trends
- HPI YoY
- ▼ -94.24%
- Current HPI
- 313.8761
- Rent YoY
- ▼ -5.60%
- Metro
- Cape Coral-Fort Myers, FL
- State GDP YoY
- ▲ 3.28%
- F500 in state
- 36
Industry mix (Fortune 500 HQ in FL)
| Industry | F500 HQs | Revenue |
|---|---|---|
| Industrial Technology | 2 | $29B |
|
||
| Insurance | 2 | $17B |
|
||
| Retail | 1 | $60B |
|
||
| Technology Distribution | 1 | $58B |
|
||
| Homebuilding | 1 | $35B |
|
||
| Technology Manufacturing | 1 | $35B |
|
||
Price history
+754.7% since first listed8 events — show timeline
- 2026-05-21 Price Changed $299,990 FORTMLS
- 2026-05-13 Price Changed $301,990 FORTMLS
- 2026-04-13 Listed $304,990 FORTMLS
- 2025-10-28 Sold (Public Records) $35,500 Public Records
- 2017-07-11 Sold (Public Records) $15,400 Public Records
- 2013-09-16 Price Changed $35,000 FORTMLS
- 2004-08-24 Sold (Public Records) $35,100 Public Records
- 2004-07-27 Sold (MLS) $35,100 FORTMLS
Property tax history
+9.1%/yrLatest (2025): $870 · +12.9% YoY. Source: county tax records.
Cash-flow waterfall
monthlySold comps — $/sqft
last 12 mo · ≤1 miLoading sold comps…