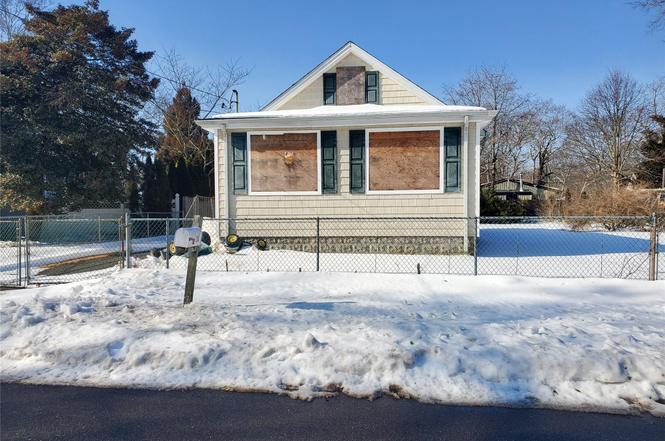
30 Franklin Ave · Mastic, NY
Flood risk 1/10 · Minimal
- FEMA flood zone
- X (unshaded)
- Chance of flooding over 30 yrs
- 0.0%
- Est. flood insurance / yr
- $473 – $860
Fire risk 1/10 · Minimal
- Est. fire insurance / yr
- $691 – $1,283
Heat risk 4/10 · Minor
- Hot days now (above 91°F)
- 7 days/yr
- Hot days in 30 yrs
- 19 days/yr
Wind risk 8/10 · Major
- Chance of severe wind over 30 yrs
- 80.0%
Air-quality risk 4/10 · Minor
- Unhealthy air days now
- 3 days/yr
- Unhealthy air days in 30 yrs
- 5 days/yr
Risk factors via First Street. Map © Google.
Why this score? — see what drove the B grade
The composite is a weighted blend of 9 inputs, each scored 0–100. Each bar is that input's sub-score; the figure is the points it added to the 100-point composite (weight × sub-score).
- Cash flow +30.0/30.0
- 1% rule +10.0/10.0
- DSCR +10.0/10.0
- ARV discount +7.5/15.0
- Schools +4.7/10.0
- Livability +3.2/5.0
- Rent growth +2.5/5.0
- Condition / age +2.5/5.0
- Appreciation +0.0/10.0
$150,000
🖨 Deal sheet (PDF) 📄 Offer letter ✓ Due diligence
Listing remarks
Short sale subject to Lender approval. Buyer must pay additional 5% to Short Sale representative.
Key facts
- 0.23 acre lot
- Built 1927
Neighborhood map
What this means for you Summary
Snapshot
- This is a 2-bed/1.0-bath single-family listed at $150k.
Deal economics
- At list price, monthly cash flow is $1k ($14k/yr) — positive.
- The deal already cash-flows at list — no discount required.
- Meets the 1% rule at list price ($3k rent vs $150k).
- Cap rate 15.9% vs local median 4.7% in Mastic — top-decile yield for the area; either an underpriced asset or a hidden risk that comps aren't pricing in. Stress-test before assuming the spread holds.
Location & tenants
- Location reads 63/100 on livability (#816 in NY) — a middle-class / working-renter tenant base. Strengths: employment A+, housing A+, health & safety B; Watch: crime D, amenities F, commute F.
- William Floyd Union Free School District (suburban): math 48% / reading 57% proficiency, ranked #309 of 590 in NY (top 52%) — acceptable for families but not a draw, mixed tenant base, ~2y average lease.
- Zoned schools: Moriches Elementary School (math 52% / reading 57%, grade C, #908 of 2,108 statewide, top 46%, 822 students, 57% FRL); William Floyd Middle School (math 36% / reading 47%, grade F, #394 of 729 statewide, top 55%, 1,053 students, 54% FRL); William Floyd High School (math 65% / reading 87%, grade A-, #616 of 1,100 statewide, top 57%, 3,013 students, 54% FRL).
- Market conditions: 100 active listings in the ZIP; 4 comparable units currently listed for rent nearby; rentals at typical pace (median 25d on market — plan ~3-4 weeks tenant-placement turnaround); 1,366 units permitted in Suffolk County in 2024 (216 in 5+ unit buildings).
Forward outlook
- Local home prices are declining (-3.0%/yr); year-one equity from $1k of loan paydown is wiped out by about $4k of value loss. Plan a longer hold.
- Suffolk County population projected to shrink 5% by 2050 — rents likely to lag national; underwrite the cash flow, not the appreciation.
- At projected returns (-3.0% appreciation + 3.0% rent growth), your $42k cash investment doubles in ~4 years — after that, you're playing with house money.
Negotiation context
- Only 0 days on market — expect competitive offers; lowballing is unlikely to land.
- 2 sale attempts with the ask held roughly flat each time — persistent listings suggest the price (not the market) is what's stuck; bring a comps-based counter.
Risks & watch-outs
- Watch-outs: property tax is 2.6% of price; built in 1927 — expect roof / HVAC / electrical / plumbing capex.
- Climate carrying-cost: severe wind risk, 80% chance of damaging wind over 30y — expect insurance premiums to compound above CPI over the hold.
Questions for the listing agent
- Built in 1927 — when were the roof, HVAC, electrical panel, plumbing, and water heater last replaced?
- Property tax is high relative to price — has the assessment been appealed recently, and will the sale trigger a re-assessment?
- Is there a deadline driving the sale (1031 exchange, divorce, estate, relocation)? That informs how much negotiation room exists.
- Schools are F-rated, which usually means shorter tenancies and higher turnover. Who's the typical renter profile here, and what's been the actual vacancy rate?
- Crime grade is D in this area — have there been break-ins, vandalism, or insurance claims at this property in the last 3 years? What carrier currently insures it and at what premium?
- What's the average days-on-market for RENTAL listings here right now (not sales)? A rising rental-DOM trend means longer vacancies and softer asking-rent achievability than the comps imply.
- What's the recent tenant-quality profile in this submarket — average credit score on applications, eviction rate, late-payment / NSF rate, and stable-employment percentage? A property-management company in the area should have these aggregated.
- How much new for-sale + rental construction is in the pipeline within 1–3 miles? Heavy new supply typically softens prices + rents 12–24 months out; constrained supply supports both.
Investment metrics
- 1% rule
- 2.00% ✓
- Cap rate
- 15.92%
- Cash-on-cash
- 34.40%
- DSCR
- 2.53
- GRM
- 4.2
CMA / ARV
- ARV (on-the-fly)
- $391,348
- Comps found
- 11
Show comp detail 11 sales within ~0.75 mi
| Address | Dist | Beds/Ba | Sqft | Sold | Price | $/sf | Match |
|---|---|---|---|---|---|---|---|
| 20 Henry St | 0.16mi | 2/1.0 | 850 (-6%) | 8mo | $310,000 | $365 | 75 |
| 47 Stuyvesant Ave | 0.25mi | 3/1.0 (+1) | 900 (-1%) | 18mo | $405,950 | $451 | 66 |
| 38 Midland Ave | 0.32mi | 3/1.0 (+1) | 1,008 (+11%) | 2mo | $405,000 | $402 | 60 |
| 33 Midland Ave | 0.29mi | 2/1.0 | 800 (-12%) | 11mo | $145,000 | $181 | 57 |
| 38 Carlton Ave | 0.49mi | 3/1.0 (+1) | 880 (-3%) | 15mo | $420,000 | $477 | 54 |
| 34 Midland Ave | 0.32mi | 2/1.0 | 772 (-15%) | 8mo | $300,000 | $389 | 53 |
| 79 Stuyvesant Ave | 0.41mi | 3/1.0 (+1) | 1,044 (+15%) | 2mo | $450,000 | $431 | 50 |
| 214 Mastic Blvd | 0.49mi | 2/1.0 | 800 (-12%) | 11mo | $420,000 | $525 | 48 |
| 163 Hampton Ave | 0.58mi | 3/1.0 (+1) | 973 (+7%) | 14mo | $430,000 | $442 | 44 |
| 118 Fulton Ave | 0.71mi | 2/1.0 | 814 (-10%) | 9mo | $305,000 | $375 | 42 |
| 137 Dana Ave | 0.55mi | 3/1.0 (+1) | 1,040 (+14%) | 20mo | $470,000 | $452 | 29 |
Match score weights: distance 35% · size 25% · config 20% · recency 20%. Top-matched comps best support the ARV.
Projected returns pro-forma
-3.0% appreciation · 3.0% rent growth · sell at horizon
- IRR
- 29.9%
- Equity multiple
- 2.25×
- Total profit
- $52,501
- Equity at exit
- $22,365
- IRR
- 37.2%
- Equity multiple
- 4.45×
- Total profit
- $144,968
- Equity at exit
- $12,969
Cash invested: $42,000 (down + closing). Projections, not guarantees.
Landlord ↔ Tenant lean methodology
- Overall (STATE)
- 15 Strongly Tenant-Friendly
- State New York
- 15 Strongly Tenant-Friendly · D+10
- County
- — inherits STATE
- City
- — inherits STATE
ZIP-level market 11950
- Home prices YoY
- -33.2%
- Active inventory
- 100
- Price-to-rent
- 4.2×
Monthly cashflow live
- Estimated rent
- $3,002 medium interval (Pro) →
- Mortgage (P&I)
- −$787
- Tax from tax record
- −$319 /mo · $3,825/yr
- Insurance
- −$62
- HOA
- −$0
- Vacancy / Maint / Mgmt
- −$630
- Net cashflow
- $1,204
Break-even live
Sensitivity live
| Price | -10% $1,289 | -5% $1,246 | +0% $1,204 | +5% $1,162 | +10% $1,119 |
|---|---|---|---|---|---|
| Rent | -10% $967 | -5% $1,085 | +0% $1,204 | +5% $1,323 | +10% $1,441 |
| Rate | -1.0pp $1,280 | -0.5pp $1,242 | base $1,204 | +0.5pp $1,165 | +1.0pp $1,126 |
UW: 25.0% down · 7.5% · 30yr · 1.5% tax · 5.0% vac · 8.0% maint · 8.0% mgmt
Financing live
Cash to close
- Down payment
- $37,500
- Closing costs
- $4,500
- Reserves months
- —
- Total cash needed
- —
Loan-product check · same deal, 3 products live
Conventional
25% down · 7.5% · 30yr
- Down + closing
- —
- Monthly P&I
- —
- Monthly cashflow
- —
- DSCR
- —
- Eligible?
- —
Personal DTI + credit; lowest rate.
DSCR
20% down · 8.5% · 30yr
- Down + closing
- —
- Monthly P&I
- —
- Monthly cashflow
- —
- DSCR
- —
- Eligible?
- —
No personal income docs; deal must DSCR.
Hard money
10% down · 12.0% · 12mo
- Down + closing
- —
- Monthly P&I
- —
- Monthly cashflow
- —
- DSCR
- —
- Eligible?
- —
Short-term bridge; refi at stabilization.
Rent comps 4 comps
| Address | Beds | Baths | Sqft | Rent | $/sqft | DOM | Units | Dist |
|---|---|---|---|---|---|---|---|---|
| 1550 Montauk Hwy Unit 1B Mastic, NY | 2.0 | 1.0 | 650 | $2,400 | $3.69 | 25d | 1 | 0.24mi |
| 61 Montgomery Ave Mastic, NY | 3.0 | 2.0 | 1025 | $3,400 | $3.32 | 20d | 1 | 0.27mi |
| 1b Meadowoods Ln Moriches, NY | 1.0–2.0 | 1.0–2.0 | 896 | $3,105 | $3.47 | 0d | 58 | 1.19mi |
| 48 Eleanor Ave Mastic, NY | 3.0 | 1.0 | 975 | $3,500 | $3.59 | 25d | 1 | 1.28mi |
Listing history 7 events
-
2026-03-12historical
-
2026-03-09$150,000
-
2026-02-11status Pending
-
2026-02-11historical
-
2026-02-10$150,000 Active
-
2005-01-19soldstatus $189,000
-
2004-11-09soldstatus $80,000
ⓘ Source: listings_history table (triggers on properties + properties_extension) + one-shot
backfill from property_details.listing_events for pre-trigger history.
Tax reassessment forecast NY · Partial reset (capped growth)
- Current annual tax
- $3,825 · $319/mo
- Projected year-2 tax
- $3,825 · $319/mo
- Expected delta
- $0/yr ($0/mo · 0.0%)
ⓘ Screening estimate from a state-policy table — verify with the county assessor before closing.
Climate risk First Street
- Flood 1/10 Low FEMA zone X (unshaded) · 0% chance over 30 yrs
- Wildfire 1/10 Low
- Heat 4/10 Moderate 7 d/yr ≥91°F today · 19 d/yr by 30 yrs out
- Wind 8/10 Severe 80% chance of damaging wind over 30 yrs
- Air quality 4/10 Moderate 3 unhealthy d/yr today · 5 by 30 yrs out
Nearby sold comps map
Loading sold comps map…
Walkable amenities ~0.75 mi
Loading nearby amenities…
Taxation est. · year 1
- Rental income
- $36,028
- − Mortgage interest
- −$8,402
- − Property taxes
- −$3,825
- − Insurance
- −$750
- − Repairs & maintenance
- −$2,882
- − Management
- −$2,882
- − Depreciation
- −$4,364
- Taxable income
- $12,922
- Est. tax owed @ 24.0%
- −$3,101
- After-tax cash flow
- $11,346/yr
For passive investors: Depreciation is non-cash, so a rental often shows a tax loss while cash-flowing — sheltering income. Rental losses are passive: they offset passive income freely, and up to $25,000/yr can offset ordinary (W-2) income if you actively participate and your MAGI is under $100k (phasing out to $0 by $150k); unused losses carry forward. On sale, claimed depreciation is recaptured at up to 25%, and gains may owe capital-gains tax (a 1031 exchange can defer both). Figures are a year-1 estimate at your 24.0% rate — not tax advice; consult a CPA.
Schools (NCES district)
- District
- William Floyd Union Free School District
- NCES district ID
- 3618690
- Math proficiency
- 48% ▲ 3.00%
- Reading proficiency
- 57% ▲ 11.00%
- Median HH income
- $70,564
- Composite
- 46.79/100
- National rank
- #2383
- State rank
- #309 of 590 in NY
Livability — Mastic
- Score
- 63/100
- State rank
- #816
- US rank
- #15786
Category grades
Schools grade is shown separately in the Schools card above.
Census & demographics
- Census place
- Mastic, NY
- City population
- 16,944
- Population (ZIP)
- 16,944
Population outlook (Suffolk County) Hauer SSP2
- Today (2025)
- 1,505,262 people
- By 2030
- 1,498,318 · -0.5%
- By 2040
- 1,471,101 · -2.3%
- By 2050
- 1,424,848 · -5.3%
- By 2075
- 1,337,157 · -11.2%
- By 2100
- 1,217,720 · -19.1%
Race, ethnicity, and origin ACS 2023
- Neighborhood character
- Diverse neighborhood (Simpson 0.59)
- Race & ethnicity
- White 55% Hispanic / Latino 30% Two or more races 15% Black 7% Native American 2% Asian 1%
- Hispanic origin (detail)
- Mexican 6% Puerto Rican 8%
- Common ancestry
- Romanian 3% Scotch-Irish 1%
- Foreign-born
- 18% · Canada, Jamaica
- Languages at home
- 72% English-only · Spanish 20% Other Indo-European 3% Russian/Polish/Slavic 2%
Political lean MEDSL · Suffolk
- 2024 margin
- Lean R (+10.0) · D 45.0% · R 55.0%
- 2008→2024 swing
- -16.0pp toward R · 2008: 6.0pp · 2024: -10.0pp
- All cycles
- 2024: R+10.0 2020: R+0.0 2016: R+8.2 2012: D+2.9 2008: D+6.0
Not yet ingested
- Civics
- —
Market trends
- HPI YoY
- ▼ -228.55%
- Current HPI
- 460.0878
- Rent YoY
- —
- Metro
- —
- State GDP YoY
- ▲ 2.60%
- F500 in state
- 92
Industry mix (Fortune 500 HQ in NY)
| Industry | F500 HQs | Revenue |
|---|---|---|
| Financial Services | 10 | $950B |
|
||
| Consumer Goods | 9 | $162B |
|
||
| Insurance | 4 | $225B |
|
||
| Telecommunications | 2 | $144B |
|
||
| Pharmaceuticals | 2 | $112B |
|
||
| Media / Entertainment | 2 | $69B |
|
||
Price history
+87.5% since first listed7 events — show timeline
- 2026-03-12 Listing Removed — OneKey® MLS as Distributed by MLS Grid
- 2026-03-09 Listed $150,000 OneKey® MLS as Distributed by MLS Grid
- 2026-02-11 Pending — OneKey® MLS as Distributed by MLS Grid
- 2026-02-11 Listing Removed — OneKey® MLS as Distributed by MLS Grid
- 2026-02-10 Listed $150,000 OneKey® MLS as Distributed by MLS Grid
- 2005-01-19 Sold (Public Records) $189,000 Public Records
- 2004-11-09 Sold (Public Records) $80,000 Public Records
Property tax history
+4.9%/yrLatest (2025): $3,825 · +0.0% YoY. Source: county tax records.
Cash-flow waterfall
monthlySold comps — $/sqft
last 12 mo · ≤1 miLoading sold comps…