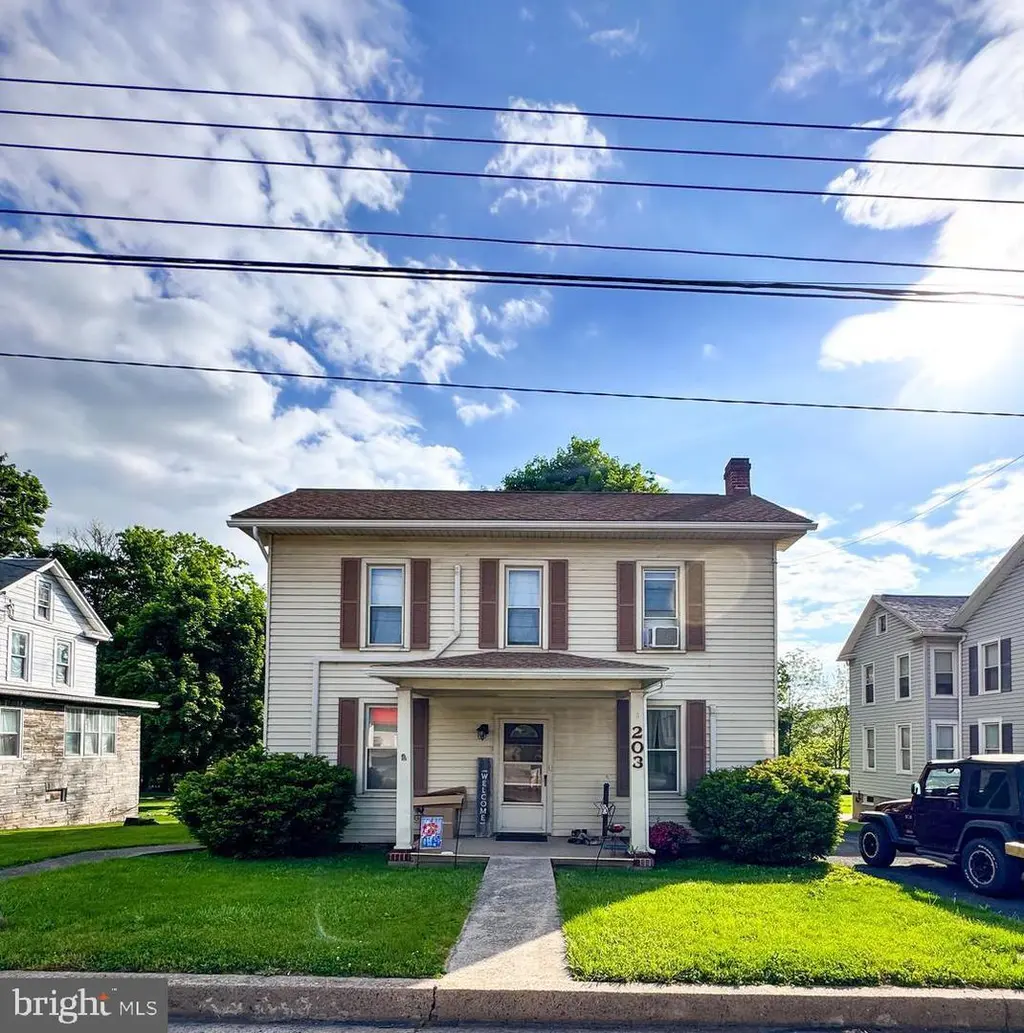
203 S Main St · Yeagertown, PA
Flood risk 1/10 · Minimal
- FEMA flood zone
- X (unshaded)
- Chance of flooding over 30 yrs
- 0.0%
- Est. flood insurance / yr
- $473 – $860
Fire risk 2/10 · Minimal
- Est. fire insurance / yr
- $511 – $949
Heat risk 4/10 · Minor
- Hot days now (above 98°F)
- 7 days/yr
- Hot days in 30 yrs
- 17 days/yr
Wind risk 2/10 · Minimal
- Chance of severe wind over 30 yrs
- 0.0%
Air-quality risk 2/10 · Minimal
- Unhealthy air days now
- 0 days/yr
- Unhealthy air days in 30 yrs
- 1 days/yr
Risk factors via First Street. Map © Google.
Why this score? — see what drove the C+ grade
The composite is a weighted blend of 9 inputs, each scored 0–100. Each bar is that input's sub-score; the figure is the points it added to the 100-point composite (weight × sub-score).
- Cash flow +22.9/30.0
- ARV discount +7.5/15.0
- DSCR +7.4/10.0
- Appreciation +7.0/10.0
- 1% rule +5.5/10.0
- Schools +3.2/10.0
- Livability +3.2/5.0
- Rent growth +2.5/5.0
- Condition / age +2.5/5.0
$190,900
🖨 Deal sheet (PDF) 📄 Offer letter ✓ Due diligence
Listing remarks
Charming 3 bedroom, 2 bath home conveniently located in Yeagertown offering a functional layout, valuable off-street parking and a beautiful creek view from the back yard. This property provides comfortable living space with plenty of potential for a buyer looking to make it their own or simply move right in and enjoy. Enjoy the convenience of being close to local amenities, schools, and shopping while still maintaining a neighborhood feel. Whether you’re searching for a primary residence, investment opportunity, this home offers a solid opportunity in a convenient location.
Key facts
- Creek view
- Convenient location
- Local amenities
Tags
Property features AI
Exterior
- Parking: On-street parking available; Off-street parking available
- Utilities: Public water; Public sewer; Electric service available; Oil used for heating and hot water
- Home design: Detached structure; Above-grade finished area reported by assessor
- Construction: Vinyl and aluminum siding; Stone foundation; Above-grade and below-grade structures
- Exterior features: Has water view
Interior
- Bedrooms: Three bedrooms on the first upper level; One bedroom on the main level
- Bathrooms: Two full bathrooms total (one on main level, one on first upper level)
- Heating & cooling: Hot water and wall unit heating; Heating fuel: oil and electric; Ductless/mini-split cooling (electric); Hot water supplied by oil
- Interior features: Finished living area reported by assessor; Basement is poured concrete and unfinished
Neighborhood map
What this means for you Summary
Snapshot
- This is a 4-bed/1.0-bath other listed at $191k.
Deal economics
- At list price, monthly cash flow is $336 ($4k/yr) — positive.
- The deal already cash-flows at list — no discount required.
- Meets the 1% rule at list price ($2k rent vs $191k).
- Recommended offer: $188k (1.5% below list) — sets the bar for market timing.
Location & tenants
- Location reads 63/100 on livability (#1,254 in PA) — a middle-class / working-renter tenant base. Strengths: crime A+, cost of living A+, housing A+; Watch: employment C-, schools F, amenities F.
- Mifflin County SD (town): math 28% / reading 49% proficiency, ranked #380 of 539 in PA (top 70%) — families likely to look elsewhere, expect single-tenant / working-renter base with shorter leases.
- Market conditions: 13 active listings in the ZIP; 1 comparable units currently listed for rent nearby; 58 units permitted in Mifflin County in 2024 (0 in 5+ unit buildings).
Forward outlook
- In year one you build about $9k of equity ($1k loan paydown + $8k appreciation (4.1% local appreciation)).
- Mifflin County population projected at -18% by 2050 — secular population decline; favor cash flow + early exit over multi-decade hold.
- At projected returns (4.1% appreciation + 3.0% rent growth), your $53k cash investment doubles in ~4 years — after that, you're playing with house money.
- By year 4, paydown + projected appreciation supports a ~$31k cash-out refi (75% LTV) — recoverable capital for the next deal without selling this one.
Negotiation context
- It's been on market 30 days — a 2% lower offer ($188k) is reasonable based on typical stale-listing flexibility.
Risks & watch-outs
- Watch-outs: built in 1950 — expect roof / HVAC / electrical / plumbing capex.
Questions for the listing agent
- Built in 1950 — when were the roof, HVAC, electrical panel, plumbing, and water heater last replaced?
- Is there a deadline driving the sale (1031 exchange, divorce, estate, relocation)? That informs how much negotiation room exists.
- Schools are F-rated, which usually means shorter tenancies and higher turnover. Who's the typical renter profile here, and what's been the actual vacancy rate?
- What's the average days-on-market for RENTAL listings here right now (not sales)? A rising rental-DOM trend means longer vacancies and softer asking-rent achievability than the comps imply.
- What's the recent tenant-quality profile in this submarket — average credit score on applications, eviction rate, late-payment / NSF rate, and stable-employment percentage? A property-management company in the area should have these aggregated.
- How much new for-sale + rental construction is in the pipeline within 1–3 miles? Heavy new supply typically softens prices + rents 12–24 months out; constrained supply supports both.
Investment metrics
- 1% rule
- 1.05% ✓
- Cap rate
- 8.40%
- Cash-on-cash
- 7.53%
- DSCR
- 1.34
- GRM
- 8.0
CMA / ARV
No comps found within radius.
Projected returns pro-forma
4.08% appreciation · 3.0% rent growth · sell at horizon
- IRR
- 17.2%
- Equity multiple
- 2.04×
- Total profit
- $55,460
- Equity at exit
- $97,654
- IRR
- 17.9%
- Equity multiple
- 3.89×
- Total profit
- $154,389
- Equity at exit
- $160,415
Cash invested: $53,452 (down + closing). Projections, not guarantees.
Landlord ↔ Tenant lean methodology
- Overall (STATE)
- 62 Landlord-Friendly
- State Pennsylvania
- 62 Landlord-Friendly · EVEN
- County
- — inherits STATE
- City
- — inherits STATE
ZIP-level market 17099
- Home prices YoY
- 1.7%
- Active inventory
- 13
- Price-to-rent
- 8.0×
Monthly cashflow live
- Estimated rent
- $2,000 medium interval (Pro) →
- Mortgage (P&I)
- −$1,001
- Tax from tax record
- −$164 /mo · $1,966/yr
- Insurance
- −$80
- HOA
- −$0
- Vacancy / Maint / Mgmt
- −$420
- Net cashflow
- $336
Break-even live
Sensitivity live
| Price | -10% $444 | -5% $390 | +0% $336 | +5% $282 | +10% $227 |
|---|---|---|---|---|---|
| Rent | -10% $178 | -5% $257 | +0% $336 | +5% $415 | +10% $494 |
| Rate | -1.0pp $432 | -0.5pp $384 | base $336 | +0.5pp $286 | +1.0pp $236 |
UW: 25.0% down · 7.5% · 30yr · 1.5% tax · 5.0% vac · 8.0% maint · 8.0% mgmt
Financing live
Cash to close
- Down payment
- $47,725
- Closing costs
- $5,727
- Reserves months
- —
- Total cash needed
- —
Loan-product check · same deal, 3 products live
Conventional
25% down · 7.5% · 30yr
- Down + closing
- —
- Monthly P&I
- —
- Monthly cashflow
- —
- DSCR
- —
- Eligible?
- —
Personal DTI + credit; lowest rate.
DSCR
20% down · 8.5% · 30yr
- Down + closing
- —
- Monthly P&I
- —
- Monthly cashflow
- —
- DSCR
- —
- Eligible?
- —
No personal income docs; deal must DSCR.
Hard money
10% down · 12.0% · 12mo
- Down + closing
- —
- Monthly P&I
- —
- Monthly cashflow
- —
- DSCR
- —
- Eligible?
- —
Short-term bridge; refi at stabilization.
Rent comps 1 comps
| Address | Beds | Baths | Sqft | Rent | $/sqft | DOM | Units | Dist |
|---|---|---|---|---|---|---|---|---|
| 203 4th Ave Burnham, PA | 3.0 | 2.0 | 1960 | $2,000 | $1.02 | 45d | 1 | 0.48mi |
Listing history 17 events
-
2026-06-21days on market $190,900 Active 30 DOM
-
2026-06-21pricedays on market $190,900 Active 29 DOM
-
2026-06-18days on market $197,900 Active 27 DOM
-
2026-06-17days on market $197,900 Active 26 DOM
-
2026-06-16days on market $197,900 Active 25 DOM
-
2026-06-15days on market $197,900 Active 24 DOM
-
2026-06-13days on market $197,900 Active 22 DOM
-
2026-06-12days on market $197,900 Active 21 DOM
-
2026-06-09days on market $197,900 Active 18 DOM
-
2026-06-08days on market $197,900 Active 17 DOM
-
2026-06-08days on market $197,900 Active 16 DOM
-
2026-06-07days on market $197,900 Active 15 DOM
-
2026-06-04days on market $197,900 Active 12 DOM
-
2026-06-02days on market $197,900 Active 11 DOM
-
2026-06-01days on market $197,900 Active 10 DOM
-
2026-05-31days on market $197,900 Active 9 DOM
-
2026-05-22$197,900 Active
ⓘ Source: listings_history table (triggers on properties + properties_extension) + one-shot
backfill from property_details.listing_events for pre-trigger history.
Tax reassessment forecast PA · Partial reset (capped growth)
- Current annual tax
- $1,966 · $164/mo
- Projected year-2 tax
- $2,491 · $208/mo
- Expected delta
- +$525/yr (+$44/mo · 26.7%)
ⓘ Screening estimate from a state-policy table — verify with the county assessor before closing.
Climate risk First Street
- Flood 1/10 Low FEMA zone X (unshaded) · 0% chance over 30 yrs
- Wildfire 2/10 Low
- Heat 4/10 Moderate 7 d/yr ≥98°F today · 17 d/yr by 30 yrs out
- Wind 2/10 Low 0% chance of damaging wind over 30 yrs
- Air quality 2/10 Low 0 unhealthy d/yr today · 1 by 30 yrs out
Nearby sold comps map
Loading sold comps map…
Walkable amenities ~0.75 mi
Loading nearby amenities…
Taxation est. · year 1
- Rental income
- $24,000
- − Mortgage interest
- −$10,693
- − Property taxes
- −$1,966
- − Insurance
- −$954
- − Repairs & maintenance
- −$1,920
- − Management
- −$1,920
- − Depreciation
- −$5,553
- Taxable income
- $993
- Est. tax owed @ 24.0%
- −$238
- After-tax cash flow
- $3,788/yr
For passive investors: Depreciation is non-cash, so a rental often shows a tax loss while cash-flowing — sheltering income. Rental losses are passive: they offset passive income freely, and up to $25,000/yr can offset ordinary (W-2) income if you actively participate and your MAGI is under $100k (phasing out to $0 by $150k); unused losses carry forward. On sale, claimed depreciation is recaptured at up to 25%, and gains may owe capital-gains tax (a 1031 exchange can defer both). Figures are a year-1 estimate at your 24.0% rate — not tax advice; consult a CPA.
Schools (NCES district)
- District
- Mifflin County SD
- NCES district ID
- 4215290
- Math proficiency
- 28% ▼ -7.00%
- Reading proficiency
- 49% ▼ -9.00%
- Median HH income
- $40,718
- Composite
- 32.28/100
- National rank
- #5755
- State rank
- #380 of 539 in PA
Livability — Yeagertown
- Score
- 63/100
- State rank
- #1254
- US rank
- #15064
Category grades
Schools grade is shown separately in the Schools card above.
Census & demographics
- Census place
- Yeagertown, PA
- Population (ZIP)
- 1,122
Population outlook (Mifflin County) Hauer SSP2
- Today (2025)
- 44,611 people
- By 2030
- 43,212 · -3.1%
- By 2040
- 40,197 · -9.9%
- By 2050
- 36,813 · -17.5%
- By 2075
- 28,833 · -35.4%
- By 2100
- 20,296 · -54.5%
Race, ethnicity, and origin ACS 2023
- Neighborhood character
- Predominantly White (100%)
- Race & ethnicity
- White 100%
- Common ancestry
- Portuguese 5% Romanian 2% Iranian 2%
Political lean MEDSL · Mifflin
- 2024 margin
- Solid R (+56.4) · D 21.4% · R 77.9%
- 2008→2024 swing
- -22.8pp toward R · 2008: -33.7pp · 2024: -56.4pp
- All cycles
- 2024: R+56.4 2020: R+56.1 2016: R+57.5 2012: R+46.8 2008: R+33.7
Not yet ingested
- Civics
- —
Market trends
- HPI YoY
- ▲ 4.08%
- Current HPI
- 240.0488
- Rent YoY
- —
- Metro
- —
- State GDP YoY
- ▲ 1.68%
- F500 in state
- 34
Industry mix (Fortune 500 HQ in PA)
| Industry | F500 HQs | Revenue |
|---|---|---|
| Healthcare | 2 | $309B |
|
||
| Insurance | 2 | $27B |
|
||
| Telecommunications / Media | 1 | $124B |
|
||
| Industrial Distribution | 1 | $22B |
|
||
| Financial Services | 1 | $20B |
|
||
| Chemicals / Materials | 1 | $18B |
|
||
Price history
1 event — show timeline
- 2026-05-22 Listed $197,900 BRIGHT MLS
Property tax history
+0.6%/yrLatest (2026): $1,966 · +0.8% YoY. Source: county tax records.
Cash-flow waterfall
monthlySold comps — $/sqft
last 12 mo · ≤1 miLoading sold comps…