 Fourplex
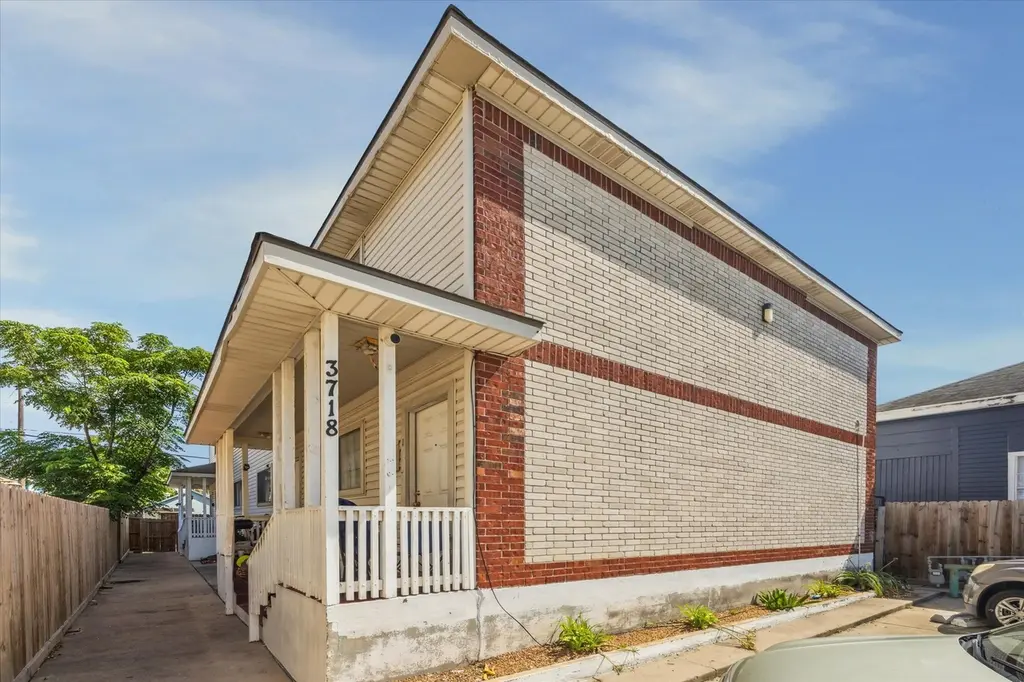
3718 Sealy St · Galveston, TX
Flood risk 10/10 · Severe
- FEMA flood zone
- AE
- Chance of flooding over 30 yrs
- 0.99%
- Est. flood insurance / yr
- $1,737 – $8,500
Fire risk 1/10 · Minimal
- Est. fire insurance / yr
- $1,222 – $2,270
Heat risk 10/10 · Severe
- Hot days now (above 107°F)
- 7 days/yr
- Hot days in 30 yrs
- 27 days/yr
Wind risk 10/10 · Severe
- Chance of severe wind over 30 yrs
- 99.0%
Air-quality risk 2/10 · Minimal
- Unhealthy air days now
- 1 days/yr
- Unhealthy air days in 30 yrs
- 2 days/yr
Risk factors via First Street. Map © Google.
Why this score? — see what drove the D+ grade
The composite is a weighted blend of 9 inputs, each scored 0–100. Each bar is that input's sub-score; the figure is the points it added to the 100-point composite (weight × sub-score).
- Cash flow +17.1/30.0
- ARV discount +7.5/15.0
- DSCR +5.3/10.0
- 1% rule +4.0/10.0
- Livability +3.8/5.0
- Schools +3.0/10.0
- Condition / age +2.5/5.0
- Rent growth +2.2/5.0
- Appreciation +0.0/10.0
$650,000
🖨 Deal sheet (PDF) 📄 Offer letter ✓ Due diligence
Multi-family units
County records classify this as Multi-Family (2-4 Unit). Listing-text estimate: 4 units. confirmed
Listing remarks
Investor’s Dream in Galveston — Rare Opportunity: 4 Units w/ Off-Street Parking + W/ D Conn This fully occupied 4-plex, built in 2001, offers reliable income with all units Section 8 approved. Located one block from Broadway St. & a scoot to the Seawall, tenants enjoy walkable transit, off-street parking, & easy access to local amenities. Each 2-bed, 1-bath unit has tile floors, in-unit laundry hookups, & separate meters, keeping costs low. The property provides essential affordable housing for Galveston’s backbone workforce: cruise line employees, hospitality staff, medical center workers & students, & retail/service personnel. With steady deman
Key facts
- 4 units
- W d conn
- Tile floors
Tags
Property features AI
Finance
- Other: Seller disclosure available
Exterior
- Parking: Paved parking
- Utilities: Has heating and cooling; Electric heating and cooling
- Home design: Residential income property; Built in 2001
- Construction: Brick, vinyl siding, and wood siding exterior; Composition roof
- Exterior features: Private entrance; Subdivision lot
Interior
- Kitchen: Dishwasher; Garbage disposal; Refrigerator
- Bedrooms: Multifamily property with a total of 4 units
- Flooring: Tile
- Bathrooms: 1 full bathroom (per unit count not specified)
- Heating & cooling: Central heating (electric); Central air (electric)
- Interior features: Window treatments; Ceiling fans; Insulated doors
- Laundry & utility: Washer hookup; Dryer hookup
Neighborhood map
What this means for you Summary
Snapshot
- This is a 4 × 2-bed/1.0-bath units multifamily listed at $650k.
Deal economics
- At list price, monthly cash flow is $27 ($322/yr) — positive. Per door: $7/mo.
- The deal already cash-flows at list — no discount required.
- To meet the 1% rule (rent ≥ 1% of price), the offer needs to be $582k (10.4% below list).
- Recommended offer: $582k (10.4% below list) — sets the bar for 1% rule.
- Cap rate 7.1% vs local median 0.1% in Galveston — top-decile yield for the area; either an underpriced asset or a hidden risk that comps aren't pricing in. Stress-test before assuming the spread holds.
Location & tenants
- Location reads 76/100 on livability (#108 in TX, #3,559 nationally) — a middle-class / working-renter tenant base. Strengths: commute A+, cost of living A+, housing A+; Watch: amenities D+, employment D, crime F.
- Galveston ISD (town): math 33% / reading 39% proficiency, ranked #514 of 826 in TX (top 62%) — families likely to look elsewhere, expect single-tenant / working-renter base with shorter leases; 68% free/reduced lunch — lower-income household profile, screen leases tightly.
- Market conditions: Rents soft (-1.1%/yr); 627 active listings in the ZIP; 3,258 units permitted in Galveston County in 2024 (0 in 5+ unit buildings).
- At $5,823/mo this rent would consume 155% of the median local household income ($45k/yr) (locally 2193% of renters already pay >50% of income on rent) — very limited rent-growth headroom before tenants either downsize or default.
Forward outlook
- Local home prices are declining (-3.0%/yr); year-one equity from $4k of loan paydown is wiped out by about $20k of value loss. Plan a longer hold.
- Galveston County population projected at +43% by 2050 — long-run rental-demand tailwind backs the buy-and-hold thesis.
Negotiation context
- It's been on market 18 days — a 2% lower offer ($640k) is reasonable based on typical stale-listing flexibility.
- 8 sale attempts since 22y ago with the ask held roughly flat each time — persistent listings suggest the price (not the market) is what's stuck; bring a comps-based counter.
Risks & watch-outs
- Watch-outs: flood insurance adds $427/mo.
- Climate carrying-cost: in FEMA flood zone AE (mandatory federal flood insurance); severe wind risk, 99% chance of damaging wind over 30y; extreme-heat days projected 7→27/yr by 2055 (HVAC capex compounding) — expect insurance premiums to compound above CPI over the hold.
Questions for the listing agent
- Can we see the unit-by-unit rent roll, current vacancy, and any below-market leases? What's the average tenancy length?
- What capital expenditures (roof, boiler, parking lot, exteriors) have been made in the last 5 years, and what's planned in the next 2?
- What's the actual annual flood-insurance premium (NFIP or private), and is the property in a SFHA with mandatory coverage?
- Is there a deadline driving the sale (1031 exchange, divorce, estate, relocation)? That informs how much negotiation room exists.
- Crime grade is F in this area — have there been break-ins, vandalism, or insurance claims at this property in the last 3 years? What carrier currently insures it and at what premium?
- The area grade is low — what's the realistic commute time and amenity access for the typical tenant pool here? Any planned neighborhood developments (good or bad) we should know about?
- What's the average days-on-market for RENTAL listings here right now (not sales)? A rising rental-DOM trend means longer vacancies and softer asking-rent achievability than the comps imply.
- What's the recent tenant-quality profile in this submarket — average credit score on applications, eviction rate, late-payment / NSF rate, and stable-employment percentage? A property-management company in the area should have these aggregated.
- How much new apartment / multifamily construction is in the pipeline within 1–3 miles? Heavy new supply (>2% of stock underway) typically softens rents 12–24 months out; light construction supports rent growth.
Investment metrics
- 1% rule
- 0.90% ✗
- Cap rate
- 7.13%
- Cash-on-cash
- 2.99%
- DSCR
- 1.13
- GRM
- 9.3
CMA / ARV
No comps found within radius.
Projected returns pro-forma
-3.0% appreciation · 0.0% rent growth · sell at horizon
- IRR
- -19.5%
- Equity multiple
- 0.34×
- Total profit
- $-120,546
- Equity at exit
- $96,917
- IRR
- -20.4%
- Equity multiple
- 0.08×
- Total profit
- $-168,158
- Equity at exit
- $56,200
Cash invested: $182,000 (down + closing). Projections, not guarantees.
Landlord ↔ Tenant lean methodology
- Overall (STATE)
- 87 Strongly Landlord-Friendly
- State Texas
- 87 Strongly Landlord-Friendly · R+5
- County
- — inherits STATE
- City
- — inherits STATE
ZIP-level market 77550
- Home prices YoY
- -32.9%
- Rents YoY
- -1.1%
- Active inventory
- 627
- Price-to-rent
- 37.2×
Monthly cashflow live
- Estimated rent
- $5,823 high interval (Pro) →
- Mortgage (P&I)
- −$3,409
- Tax from tax record
- −$467 /mo · $5,607/yr
- Insurance
- −$271
- Flood insurance flood zone
- −$427 /mo · $5,118/yr
- HOA
- −$0
- Vacancy / Maint / Mgmt
- −$1,223
- Net cashflow
- $27
Break-even live
Sensitivity live
| Price | -10% $395 | -5% $211 | +0% $27 | +5% $-157 | +10% $-341 |
|---|---|---|---|---|---|
| Rent | -10% $-433 | -5% $-203 | +0% $27 | +5% $257 | +10% $487 |
| Rate | -1.0pp $354 | -0.5pp $192 | base $27 | +0.5pp $-142 | +1.0pp $-313 |
4-unit breakdown (identical units grouped — click to expand)
| Units | Beds | Baths | Est. rent |
|---|---|---|---|
| 4× units | 2 | 1 | $5,824 |
| #1 | 2 | 1 | $1,456 |
| #2 | 2 | 1 | $1,456 |
| #3 | 2 | 1 | $1,456 |
| #4 | 2 | 1 | $1,456 |
| Total (4 units) | $5,823 | ||
UW: 25.0% down · 7.5% · 30yr · 1.5% tax · 5.0% vac · 8.0% maint · 8.0% mgmt
Financing live
Cash to close
- Down payment
- $162,500
- Closing costs
- $19,500
- Reserves months
- —
- Total cash needed
- —
Loan-product check · same deal, 3 products live
Conventional
25% down · 7.5% · 30yr
- Down + closing
- —
- Monthly P&I
- —
- Monthly cashflow
- —
- DSCR
- —
- Eligible?
- —
Personal DTI + credit; lowest rate.
DSCR
20% down · 8.5% · 30yr
- Down + closing
- —
- Monthly P&I
- —
- Monthly cashflow
- —
- DSCR
- —
- Eligible?
- —
No personal income docs; deal must DSCR.
Hard money
10% down · 12.0% · 12mo
- Down + closing
- —
- Monthly P&I
- —
- Monthly cashflow
- —
- DSCR
- —
- Eligible?
- —
Short-term bridge; refi at stabilization.
Listing history 11 events
-
2026-06-21days on market $650,000 Active 18 DOM
-
2026-06-18days on market $650,000 Active 15 DOM
-
2026-06-17days on market $650,000 Active 14 DOM
-
2026-06-16days on market $650,000 Active 13 DOM
-
2026-06-15days on market $650,000 Active 12 DOM
-
2026-06-13days on market $650,000 Active 10 DOM
-
2026-06-09days on market $650,000 Active 6 DOM
-
2026-06-08days on market $650,000 Active 5 DOM
-
2026-06-07days on market $650,000 Active 4 DOM
-
2026-06-04remarks 661-char remark
-
2026-06-04$650,000 Active 1 DOM
ⓘ Source: listings_history table (triggers on properties + properties_extension) + one-shot
backfill from property_details.listing_events for pre-trigger history.
Tax reassessment forecast TX · Resets to sale price
- Current annual tax
- $5,607 · $467/mo
- Projected year-2 tax
- $11,895 · $991/mo
- Expected delta
- +$6,288/yr (+$524/mo · 112.1%)
ⓘ Screening estimate from a state-policy table — verify with the county assessor before closing.
Climate risk First Street
- Flood 10/10 Extreme FEMA zone AE · 99% chance over 30 yrs
- Wildfire 1/10 Low
- Heat 10/10 Extreme 7 d/yr ≥107°F today · 27 d/yr by 30 yrs out
- Wind 10/10 Extreme 99% chance of damaging wind over 30 yrs
- Air quality 2/10 Low 1 unhealthy d/yr today · 2 by 30 yrs out
Nearby sold comps map
Loading sold comps map…
Walkable amenities ~0.75 mi
Loading nearby amenities…
Taxation est. · year 1
- Rental income
- $69,876
- − Mortgage interest
- −$36,410
- − Property taxes
- −$5,607
- − Insurance
- −$8,368
- − Repairs & maintenance
- −$5,590
- − Management
- −$5,590
- − Depreciation
- −$18,909
- Taxable loss
- −$10,599
- Est. tax savings @ 24.0%
- +$2,544
- After-tax cash flow
- $2,866/yr
For passive investors: Depreciation is non-cash, so a rental often shows a tax loss while cash-flowing — sheltering income. Rental losses are passive: they offset passive income freely, and up to $25,000/yr can offset ordinary (W-2) income if you actively participate and your MAGI is under $100k (phasing out to $0 by $150k); unused losses carry forward. On sale, claimed depreciation is recaptured at up to 25%, and gains may owe capital-gains tax (a 1031 exchange can defer both). Figures are a year-1 estimate at your 24.0% rate — not tax advice; consult a CPA.
Schools (NCES district)
- District
- Galveston ISD
- NCES district ID
- 4820280
- Math proficiency
- 33% ▼ -14.00%
- Reading proficiency
- 39% ▼ -4.00%
- Median HH income
- $40,162
- Composite
- 30.22/100
- National rank
- #6299
- State rank
- #514 of 826 in TX
Livability — Galveston
- Score
- 76/100
- State rank
- #108
- US rank
- #3559
Category grades
Schools grade is shown separately in the Schools card above.
Census & demographics
- Census place
- Galveston, TX
- County
- Galveston County · 357,330 people
- City population
- 55,599
- Metro
- Houston-The Woodlands-Sugar Land, TX
- Population (ZIP)
- 23,489
- Household income
- $45,047
- Rent vs Own
- Severe rent burden
- 2193.0
Population outlook (Galveston County) Hauer SSP2
- Today (2025)
- 390,640 people
- By 2030
- 425,226 · +8.9%
- By 2040
- 493,765 · +26.4%
- By 2050
- 559,698 · +43.3%
- By 2075
- 719,260 · +84.1%
- By 2100
- 819,628 · +109.8%
Race, ethnicity, and origin ACS 2023
- Neighborhood character
- Diverse neighborhood (Simpson 0.66)
- Race & ethnicity
- White 46% Hispanic / Latino 30% Two or more races 19% Black 19% Asian 3%
- Hispanic origin (detail)
- Mexican 21% Puerto Rican 1%
- Common ancestry
- Lithuanian 2% Italian 2% Romanian 1%
- Foreign-born
- 11% · Canada, Jamaica
- Languages at home
- 75% English-only · Spanish 18% Other Asian/Pacific 2% Russian/Polish/Slavic 1%
Political lean MEDSL · Galveston
- 2024 margin
- Strong R (+27.4) · D 35.7% · R 63.1% · Other 1.2%
- 2008→2024 swing
- -7.9pp toward R · 2008: -19.5pp · 2024: -27.4pp
- All cycles
- 2024: R+27.4 2020: R+22.6 2016: R+22.6 2012: R+26.9 2008: R+19.5
Not yet ingested
- Civics
- —
Market trends
- HPI YoY
- ▼ -158.96%
- Current HPI
- 324.2159
- Rent YoY
- ▼ -1.12%
- Metro
- Houston-The Woodlands-Sugar Land, TX
- State GDP YoY
- ▲ 3.95%
- F500 in state
- 110
Industry mix (Fortune 500 HQ in TX)
| Industry | F500 HQs | Revenue |
|---|---|---|
| Energy | 16 | $1,198B |
|
||
| Technology | 5 | $198B |
|
||
| Engineering / Construction | 4 | $72B |
|
||
| Energy Services | 3 | $60B |
|
||
| Utilities | 3 | $41B |
|
||
| Healthcare | 2 | $330B |
|
||
Price history
+195.5% since first listed20 events — show timeline
- 2026-06-03 Listed $650,000 HARMLS
- 2026-03-14 Listed for Rent — HARMLS
- 2026-02-02 Rental Removed — HARMLS
- 2025-07-08 Listed for Rent — HARMLS
- 2025-07-07 Listing Removed — HARMLS
- 2025-06-10 Listed $654,000 HARMLS
- 2012-08-30 Sold (Public Records) — Public Records
- 2012-08-30 Sold (MLS) — HARMLS
- 2012-04-26 Listing Removed — HARMLS
- 2012-04-14 Listed $135,000 HARMLS
- 2011-10-28 Listing Removed — HARMLS
- 2011-03-28 Listed $135,000 HARMLS
- 2006-05-01 Sold (Public Records) — Public Records
- 2005-07-20 Sold (Public Records) — Public Records
- 2005-03-23 Listing Removed — HARMLS
- 2005-01-21 Listed $215,000 HARMLS
- 2005-01-19 Listing Removed — HARMLS
- 2004-10-05 Listed $220,000 HARMLS
- 2004-07-22 Sold (Public Records) — Public Records
- 1999-11-29 Sold (Public Records) — Public Records
Property tax history
+2.6%/yrLatest (2025): $5,607 · +19.2% YoY. Source: county tax records.
Cash-flow waterfall
monthlySold comps — $/sqft
last 12 mo · ≤1 miLoading sold comps…