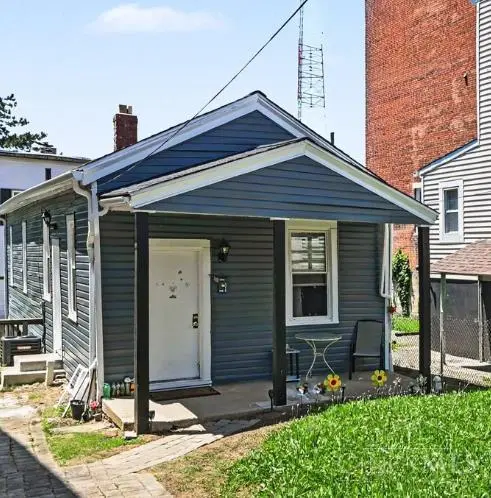
2331 May St · Cincinnati, OH
Flood risk 1/10 · Minimal
- FEMA flood zone
- X (unshaded)
- Chance of flooding over 30 yrs
- 0.0%
- Est. flood insurance / yr
- $473 – $860
Fire risk 1/10 · Minimal
- Est. fire insurance / yr
- $713 – $1,323
Heat risk 4/10 · Minor
- Hot days now (above 103°F)
- 7 days/yr
- Hot days in 30 yrs
- 18 days/yr
Wind risk 2/10 · Minimal
- Chance of severe wind over 30 yrs
- 1.0%
Air-quality risk 3/10 · Minor
- Unhealthy air days now
- 2 days/yr
- Unhealthy air days in 30 yrs
- 3 days/yr
Risk factors via First Street. Map © Google.
Why this score? — see what drove the C grade
The composite is a weighted blend of 9 inputs, each scored 0–100. Each bar is that input's sub-score; the figure is the points it added to the 100-point composite (weight × sub-score).
- Cash flow +21.0/30.0
- ARV discount +15.0/15.0
- DSCR +6.7/10.0
- 1% rule +5.2/10.0
- Livability +4.0/5.0
- Rent growth +3.1/5.0
- Schools +2.5/10.0
- Condition / age +2.5/5.0
- Appreciation +0.0/10.0
$135,000
🖨 Deal sheet (PDF) 📄 Offer letter ✓ Due diligence
Listing remarks MLS
Welcome to 2331 May St! This 2 bed, 1 bath home is a good investment opportunity. Located in the heart of Walnut Hills and minutes away from the University of Cincinnati, Xavier University, OTR, and downtown.
Key facts
- Xavier university
- Dining
- Major employers
Tags
Property features AI
Finance
- Other: Lease not considered
- HOA & community: No HOA
Exterior
- Parking: On-street parking
- Utilities: Public water; Public sewer; Natural gas
- Home design: Ranch-style single family home; One story; Poured foundation
- Construction: Aluminum siding; Shingle roof
- Exterior features: Vinyl windows; Residential zoning
Interior
- Kitchen: Kitchen with vinyl flooring (20 x 18)
- Bedrooms: Two bedrooms total; Primary bedroom on level 1 (12 x 15); Second bedroom on level 1 (10 x 10)
- Flooring: Wall-to-wall carpet in living room; Vinyl flooring in kitchen
- Bathrooms: One full bathroom on level 1
- Heating & cooling: Forced air heating (gas); Central air conditioning; Gas water heating
- Interior features: Four total rooms; Partial unfinished basement
Neighborhood map
What this means for you Summary
Snapshot
- This is a 2-bed/1.0-bath single-family listed at $135k.
Deal economics
- At list price, monthly cash flow is $190 ($2k/yr) — positive.
- The deal already cash-flows at list — no discount required.
- Meets the 1% rule at list price ($1k rent vs $135k).
- Cap rate 8.0% vs local median 3.9% in Cincinnati — top-decile yield for the area; either an underpriced asset or a hidden risk that comps aren't pricing in. Stress-test before assuming the spread holds.
Location & tenants
- Location reads 80/100 on livability (#130 in OH, #1,856 nationally) — a professional / high-income tenant draw. Strengths: amenities A+, commute A+, cost of living A+; Watch: employment D, crime F.
- Cincinnati Public Schools (urban): math 25% / reading 36% proficiency, ranked #581 of 656 in OH (top 89%) — families likely to look elsewhere, expect single-tenant / working-renter base with shorter leases; 70% free/reduced lunch — lower-income household profile, screen leases tightly.
- Market conditions: Rents rising (+2.3%/yr); 67 active listings in the ZIP; 40 comparable units currently listed for rent nearby; rentals at typical pace (median 24d on market — plan ~3-4 weeks tenant-placement turnaround); 801 units permitted in Hamilton County in 2024 (190 in 5+ unit buildings).
Forward outlook
- Local home prices are declining (-3.0%/yr); year-one equity from $933 of loan paydown is wiped out by about $4k of value loss. Plan a longer hold.
Negotiation context
- Only 6 days on market — expect competitive offers; lowballing is unlikely to land.
- 4 sale attempts since 28y ago with the ask held roughly flat each time — persistent listings suggest the price (not the market) is what's stuck; bring a comps-based counter.
- Current owner paid $104k; 30% above their basis — modest negotiation headroom, anchor on the comps not their cost.
Risks & watch-outs
- Watch-outs: built in 1895 — expect roof / HVAC / electrical / plumbing capex.
Questions for the listing agent
- Built in 1895 — when were the roof, HVAC, electrical panel, plumbing, and water heater last replaced?
- Is there a deadline driving the sale (1031 exchange, divorce, estate, relocation)? That informs how much negotiation room exists.
- Schools are B-rated — typically a magnet for longer-tenancy family renters. What's the average tenant stay here, and is there a school-zone premium baked into asking?
- Crime grade is F in this area — have there been break-ins, vandalism, or insurance claims at this property in the last 3 years? What carrier currently insures it and at what premium?
- What's the average days-on-market for RENTAL listings here right now (not sales)? A rising rental-DOM trend means longer vacancies and softer asking-rent achievability than the comps imply.
- What's the recent tenant-quality profile in this submarket — average credit score on applications, eviction rate, late-payment / NSF rate, and stable-employment percentage? A property-management company in the area should have these aggregated.
- How much new for-sale + rental construction is in the pipeline within 1–3 miles? Heavy new supply typically softens prices + rents 12–24 months out; constrained supply supports both.
Investment metrics
- 1% rule
- 1.02% ✓
- Cap rate
- 7.98%
- Cash-on-cash
- 6.02%
- DSCR
- 1.27
- GRM
- 8.2
CMA / ARV
- ARV (on-the-fly)
- $207,360
- Comps found
- 2
Show comp detail 2 sales within ~0.75 mi
| Address | Dist | Beds/Ba | Sqft | Sold | Price | $/sf | Match |
|---|---|---|---|---|---|---|---|
| 2331 May St | 0.00mi | 2/1.0 | 960 (0%) | 11mo | $104,000 | $108 | 91 |
| 1130 Yale Ave | 0.70mi | 2/2.5 | 1,041 (+8%) | 23mo | $225,000 | $216 | 28 |
Match score weights: distance 35% · size 25% · config 20% · recency 20%. Top-matched comps best support the ARV.
Projected returns pro-forma
-3.0% appreciation · 2.33% rent growth · sell at horizon
- IRR
- -7.7%
- Equity multiple
- 0.72×
- Total profit
- $-10,728
- Equity at exit
- $20,129
- IRR
- 1.0%
- Equity multiple
- 1.07×
- Total profit
- $2,467
- Equity at exit
- $11,672
Cash invested: $37,800 (down + closing). Projections, not guarantees.
Landlord ↔ Tenant lean methodology
- Overall (STATE)
- 73 Landlord-Friendly
- State Ohio
- 73 Landlord-Friendly · R+6
- County
- — inherits STATE
- City
- — inherits STATE
ZIP-level market 45206
- Rents YoY
- 2.3%
- Active inventory
- 67
- Price-to-rent
- 8.2×
Monthly cashflow live
- Estimated rent
- $1,376 high interval (Pro) →
- Mortgage (P&I)
- −$708
- Tax from tax record
- −$133 /mo · $1,601/yr
- Insurance
- −$56
- HOA
- −$0
- Vacancy / Maint / Mgmt
- −$289
- Net cashflow
- $190
Break-even live
Sensitivity live
| Price | -10% $266 | -5% $228 | +0% $190 | +5% $151 | +10% $113 |
|---|---|---|---|---|---|
| Rent | -10% $81 | -5% $135 | +0% $190 | +5% $244 | +10% $298 |
| Rate | -1.0pp $258 | -0.5pp $224 | base $190 | +0.5pp $155 | +1.0pp $119 |
UW: 25.0% down · 7.5% · 30yr · 1.5% tax · 5.0% vac · 8.0% maint · 8.0% mgmt
Financing live
Cash to close
- Down payment
- $33,750
- Closing costs
- $4,050
- Reserves months
- —
- Total cash needed
- —
Loan-product check · same deal, 3 products live
Conventional
25% down · 7.5% · 30yr
- Down + closing
- —
- Monthly P&I
- —
- Monthly cashflow
- —
- DSCR
- —
- Eligible?
- —
Personal DTI + credit; lowest rate.
DSCR
20% down · 8.5% · 30yr
- Down + closing
- —
- Monthly P&I
- —
- Monthly cashflow
- —
- DSCR
- —
- Eligible?
- —
No personal income docs; deal must DSCR.
Hard money
10% down · 12.0% · 12mo
- Down + closing
- —
- Monthly P&I
- —
- Monthly cashflow
- —
- DSCR
- —
- Eligible?
- —
Short-term bridge; refi at stabilization.
Rent comps 40 comps
| Address | Beds | Baths | Sqft | Rent | $/sqft | DOM | Units | Dist |
|---|---|---|---|---|---|---|---|---|
| 2315 Saint James Ave Unit 2B Cincinnati, OH | 1.0 | 1.0 | 800 | $895 | $1.12 | 15d | 1 | 0.29mi |
| 2315 Saint James Ave Unit 17B Cincinnati, OH | 1.0 | 1.0 | 750 | $795 | $1.06 | 15d | 1 | 0.29mi |
| 2315 Saint James Ave Unit 3B Cincinnati, OH | 1.0 | 1.0 | 800 | $895 | $1.12 | 5d | 1 | 0.29mi |
| 937 Windsor St Unit 407 Cincinnati, OH | 1.0 | 1.0 | 780 | $1,479 | $1.90 | 24d | 1 | 0.32mi |
| 937 Windsor St Unit 202 Cincinnati, OH | 1.0 | 1.0 | 819 | $1,464 | $1.79 | 24d | 1 | 0.32mi |
| 937 Windsor St Unit 102 Cincinnati, OH | 1.0 | 1.0 | 819 | $1,454 | $1.78 | 24d | 1 | 0.32mi |
| 2249 McGregor Pl Cincinnati, OH | 3.0 | 1.0 | 960 | $1,200 | $1.25 | 24d | 1 | 0.34mi |
| 960 Francisco St Unit 104 Cincinnati, OH | 1.0 | 1.0 | 534 | $1,149 | $2.15 | 24d | 1 | 0.34mi |
| 960 Francisco St Unit 107 Cincinnati, OH | 2.0 | 2.0 | 912 | $1,649 | $1.81 | 24d | 1 | 0.34mi |
| 2612 Stanton Ave Unit 2 Cincinnati, OH | 2.0 | 1.0 | 1020 | $1,250 | $1.23 | 24d | 1 | 0.36mi |
| 2612 Stanton Ave Unit 1 Cincinnati, OH | 3.0 | 1.0 | 1080 | $1,599 | $1.48 | 24d | 1 | 0.36mi |
| 2612 Stanton Ave Unit 3 Cincinnati, OH | 2.0 | 1.0 | 1000 | $1,199 | $1.20 | 21d | 1 | 0.36mi |
| 900 E McMillan St Cincinnati, OH | 1.0 | 1.0 | 592 | $1,275 | $2.15 | 2d | 2 | 0.37mi |
| 2216 Burnet Ave Unit 2 Cincinnati, OH | 1.0 | 1.0 | 750 | $825 | $1.10 | 22d | 1 | 0.38mi |
| 975 E McMillan St Cincinnati, OH | 2.0 | 1.0 | 978 | $1,695 | $1.73 | 21d | 1 | 0.44mi |
| 975 E McMillan St Unit 201 Cincinnati, OH | 2.0 | 1.0 | 978 | $1,695 | $1.73 | 21d | 1 | 0.44mi |
| 2334 Kemper Ln Unit 2334-02 Cincinnati, OH | 1.0 | 1.0 | 750 | $950 | $1.27 | 24d | 1 | 0.44mi |
| 2334 Kemper Ln Unit 2334-13 Cincinnati, OH | 1.0 | 1.0 | 750 | $895 | $1.19 | 14d | 1 | 0.44mi |
| 954 E McMillan St Cincinnati, OH | 1.0 | 1.0 | 592 | $1,400 | $2.36 | 2d | 1 | 0.44mi |
| 523 Oak St Cincinnati, OH | 1.0–2.0 | 1.0 | 650 | $999 | $1.54 | 24d | 4 | 0.46mi |
| 2532 Highland Ave Apt 20 Cincinnati, OH | 1.0 | 1.0 | 700 | $949 | $1.36 | 24d | 1 | 0.46mi |
| 2118 Saint James Ave Cincinnati, OH | 2.0 | 1.0 | 1005 | $1,650 | $1.64 | 24d | 1 | 0.47mi |
| 2112 Kemper Ln Apt 3 Cincinnati, OH | 1.0 | 1.0 | 800 | $1,260 | $1.57 | 2d | 1 | 0.52mi |
| 2378 Park Ave Cincinnati, OH | 1.0 | 1.0 | 710 | $1,060 | $1.49 | 5d | 1 | 0.54mi |
| 255 McGregor Ave Cincinnati, OH | 1.0–2.0 | 1.0 | 700 | $1,095 | $1.56 | 5d | 4 | 0.54mi |
| 242 Mccormick Pl Unit 1056125P Cincinnati, OH | 1.0 | 1.0 | 592 | $1,850 | $3.12 | 3d | 1 | 0.55mi |
| 240 Mcgregor Ave Unit 2 Cincinnati, OH | 2.0 | 2.0 | 1100 | $2,495 | $2.27 | 24d | 1 | 0.56mi |
| 2215 Victory Pkwy Cincinnati, OH | 1.0 | 1.0 | 750 | $1,100 | $1.47 | 24d | 1 | 0.59mi |
| 2330 Victory Pkwy Cincinnati, OH | 1.0–2.0 | 1.0–2.0 | 693 | $1,999 | $2.88 | 3d | 6 | 0.63mi |
| 2340 Victory Pkwy Cincinnati, OH | 1.0 | 1.0 | 490 | $999 | $2.04 | 24d | 4 | 0.63mi |
| 1228 E McMillan St Cincinnati, OH | 1.0–2.0 | 1.0–2.0 | 1340 | $2,327 | $1.74 | 2d | 14 | 0.69mi |
| 2622 Victory Pkwy Unit 102 Cincinnati, OH | 1.0 | 1.0 | 540 | $1,133 | $2.10 | 24d | 1 | 0.70mi |
| 2624 Victory Pkwy Unit 206 Cincinnati, OH | 2.0 | 1.0 | 975 | $1,499 | $1.54 | 11d | 1 | 0.70mi |
| 2624 Victory Pkwy Unit 107 Cincinnati, OH | 1.0 | 1.0 | 540 | $1,133 | $2.10 | 24d | 1 | 0.70mi |
| 246 E University Ave Unit 246-2 Cincinnati, OH | 2.0 | 1.0 | 750 | $1,699 | $2.27 | 5d | 1 | 0.72mi |
| 225 E University Ave Cincinnati, OH | 3.0 | 2.0 | 1000 | $3,000 | $3.00 | 24d | 1 | 0.74mi |
| 830 Beecher St Unit 852-49 Cincinnati, OH | 2.0 | 1.0 | 689 | $925 | $1.34 | 5d | 1 | 0.75mi |
| 830 Beecher St Unit 852-52 Cincinnati, OH | 1.0 | 1.0 | 580 | $755 | $1.30 | 24d | 1 | 0.75mi |
| 207 E University Ave Cincinnati, OH | 2.0 | 1.0 | 905 | $1,600 | $1.77 | 24d | 1 | 0.78mi |
| 2906 Alms Pl Cincinnati, OH | 2.0 | 1.0 | 800 | $1,100 | $1.38 | 17d | 1 | 0.82mi |
Listing history 6 events
-
2026-06-18days on market $135,000 Active 6 DOM
-
2026-06-17days on market $135,000 Active 5 DOM
-
2026-06-16days on market $135,000 Active 4 DOM
-
2026-06-15days on market $135,000 Active 3 DOM
-
2026-06-13remarks 402-char remark
-
2026-06-13$135,000 Active 1 DOM
ⓘ Source: listings_history table (triggers on properties + properties_extension) + one-shot
backfill from property_details.listing_events for pre-trigger history.
Tax reassessment forecast OH · Partial reset (capped growth)
- Current annual tax
- $1,601 · $133/mo
- Projected year-2 tax
- $1,854 · $154/mo
- Expected delta
- +$252/yr (+$21/mo · 15.8%)
ⓘ Screening estimate from a state-policy table — verify with the county assessor before closing.
Climate risk First Street
- Flood 1/10 Low FEMA zone X (unshaded) · 0% chance over 30 yrs
- Wildfire 1/10 Low
- Heat 4/10 Moderate 7 d/yr ≥103°F today · 18 d/yr by 30 yrs out
- Wind 2/10 Low 100% chance of damaging wind over 30 yrs
- Air quality 3/10 Moderate 2 unhealthy d/yr today · 3 by 30 yrs out
Nearby sold comps map
Loading sold comps map…
Walkable amenities ~0.75 mi
Loading nearby amenities…
Taxation est. · year 1
- Rental income
- $16,514
- − Mortgage interest
- −$7,562
- − Property taxes
- −$1,601
- − Insurance
- −$675
- − Repairs & maintenance
- −$1,321
- − Management
- −$1,321
- − Depreciation
- −$3,927
- Taxable income
- $106
- Est. tax owed @ 24.0%
- −$25
- After-tax cash flow
- $2,249/yr
For passive investors: Depreciation is non-cash, so a rental often shows a tax loss while cash-flowing — sheltering income. Rental losses are passive: they offset passive income freely, and up to $25,000/yr can offset ordinary (W-2) income if you actively participate and your MAGI is under $100k (phasing out to $0 by $150k); unused losses carry forward. On sale, claimed depreciation is recaptured at up to 25%, and gains may owe capital-gains tax (a 1031 exchange can defer both). Figures are a year-1 estimate at your 24.0% rate — not tax advice; consult a CPA.
Schools (NCES district)
- District
- Cincinnati Public Schools
- NCES district ID
- 3904375
- Math proficiency
- 25% ▼ -19.00%
- Reading proficiency
- 36% ▼ -14.00%
- Median HH income
- $35,743
- Composite
- 25.21/100
- National rank
- #7508
- State rank
- #581 of 656 in OH
Livability — Cincinnati
- Score
- 80/100
- State rank
- #130
- US rank
- #1856
Category grades
Schools grade is shown separately in the Schools card above.
Census & demographics
- Census place
- Cincinnati, OH
- County
- Hamilton County · 701,295 people
- City population
- 505,555
- Metro
- Cincinnati, OH-KY-IN
- Population (ZIP)
- 10,299
- Household income
- $62,648
- Rent vs Own
- Severe rent burden
- 618.0
Population outlook (Hamilton County) Hauer SSP2
- Today (2025)
- 826,054 people
- By 2030
- 830,947 · +0.6%
- By 2040
- 832,319 · +0.8%
- By 2050
- 822,428 · -0.4%
- By 2075
- 788,688 · -4.5%
- By 2100
- 710,674 · -14.0%
Race, ethnicity, and origin ACS 2023
- Neighborhood character
- Diverse neighborhood (Simpson 0.61)
- Race & ethnicity
- White 50% Black 37% Two or more races 8% Hispanic / Latino 4% Asian 3%
- Common ancestry
- Slovak 2% Romanian 2% Iranian 1%
- Foreign-born
- 4% · Vietnam, Canada
- Languages at home
- 94% English-only · Spanish 2% Vietnamese 2% Other Indo-European 1%
Political lean MEDSL · Hamilton
- 2024 margin
- D (+14.9) · D 57.0% · R 42.1%
- 2008→2024 swing
- +7.9pp toward D · 2008: 7.0pp · 2024: 14.9pp
- All cycles
- 2024: D+14.9 2020: D+15.9 2016: D+9.5 2012: D+4.9 2008: D+7.0
Not yet ingested
- Civics
- —
Market trends
- HPI YoY
- ▼ -200.07%
- Current HPI
- 227.6837
- Rent YoY
- ▲ 2.33%
- Metro
- Cincinnati, OH-KY-IN
- State GDP YoY
- ▲ 1.98%
- F500 in state
- 48
Industry mix (Fortune 500 HQ in OH)
| Industry | F500 HQs | Revenue |
|---|---|---|
| Insurance | 3 | $145B |
|
||
| Industrial Machinery | 3 | $49B |
|
||
| Financial Services | 3 | $24B |
|
||
| Consumer Goods | 2 | $93B |
|
||
| Aerospace / Defense | 2 | $47B |
|
||
| Utilities | 2 | $33B |
|
||
Price history
+1025.0% since first listed8 events — show timeline
- 2026-06-12 Listed $135,000 Cincy MLS
- 2025-07-24 Sold (MLS) $104,000 Cincy MLS
- 2025-06-20 Contingent — Cincy MLS
- 2025-05-23 Listed $108,999 Cincy MLS
- 2008-05-01 Listing Removed — Cincy MLS
- 2007-10-13 Listed $72,000 Cincy MLS
- 1999-01-25 Listing Removed — Cincy MLS
- 1998-10-05 Listed $12,000 Cincy MLS
Property tax history
+23.3%/yrLatest (2025): $1,601 · +0.1% YoY. Source: county tax records.
Cash-flow waterfall
monthlySold comps — $/sqft
last 12 mo · ≤1 miLoading sold comps…