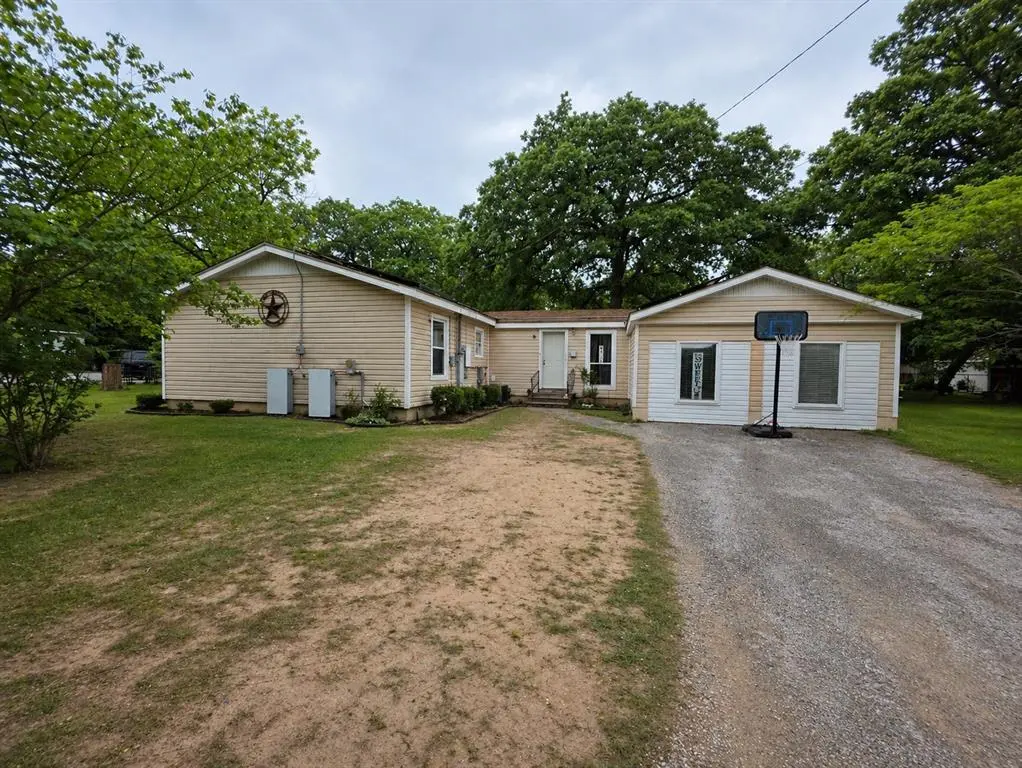
500 Pine Oak Dr · Athens, TX
Flood risk 1/10 · Minimal
- FEMA flood zone
- X (unshaded)
- Chance of flooding over 30 yrs
- 0.0%
- Est. flood insurance / yr
- $507 – $1,088
Fire risk 4/10 · Minor
- Est. fire insurance / yr
- $1,222 – $2,270
Heat risk 7/10 · Major
- Hot days now (above 110°F)
- 7 days/yr
- Hot days in 30 yrs
- 26 days/yr
Wind risk 6/10 · Moderate
- Chance of severe wind over 30 yrs
- 64.0%
Air-quality risk 2/10 · Minimal
- Unhealthy air days now
- 0 days/yr
- Unhealthy air days in 30 yrs
- 1 days/yr
Risk factors via First Street. Map © Google.
Why this score? — see what drove the B grade
The composite is a weighted blend of 9 inputs, each scored 0–100. Each bar is that input's sub-score; the figure is the points it added to the 100-point composite (weight × sub-score).
- Cash flow +29.3/30.0
- ARV discount +15.0/15.0
- DSCR +10.0/10.0
- 1% rule +7.6/10.0
- Livability +3.6/5.0
- Schools +2.9/10.0
- Rent growth +2.5/5.0
- Condition / age +2.5/5.0
- Appreciation +0.0/10.0
$128,000
🖨 Deal sheet 📄 Offer letter ✓ Due diligence
Listing remarks
Spacious 5-bedroom, 2-bath home situated on a desirable corner lot in Athens! This property features an oversized den, perfect for entertaining, a second living area, or creating your ideal gathering space. The flexible layout offers plenty of room for growing needs, home offices, or guest accommodations. Enjoy added value with solar panels for improved energy efficiency and long-term savings. Conveniently located with easy access to local amenities, shopping, and dining. Don’t miss the opportunity to make this versatile property your own—schedule your showing today!
Key facts
- 0.3 acre lot
- Built 1955
- Listed 45 days
Property features AI
Finance
- Financial info: Accepts Cash, Conventional, FHA, and VA financing
- HOA & community: No association
Exterior
- Parking: Driveway parking
- Utilities: City water; Electricity connected; Cable available; Not in a municipal utility district
- Home design: Single family residence; One level
- Construction: Built in 1955; Brick and siding exterior; Pillar/post/pier foundation; Composition shingle roof
- Exterior features: Corner lot; Chain link and privacy fencing; Shed(s) on the property
Interior
- Kitchen: Electric cooktop; Electric oven
- Bedrooms: Primary bedroom on level 1 (14 x 15); Bedroom on level 1 (12 x 13); Bedroom on level 1 (12 x 11); Den on level 1 (20 x 20)
- Flooring: Hardwood flooring
- Bathrooms: Primary bathroom on level 1 (8 x 8); Additional bathroom on level 1 (8 x 8); Total of 2 bathrooms
- Heating & cooling: Active solar heating; Ceiling fan(s); Wall/window unit(s); Window unit(s)
- Interior features: Cable TV available; Window coverings
- Laundry & utility: Washer hookup
Neighborhood map
What this means for you Summary
Snapshot
- This is a 3-bed/2.0-bath single-family listed at $128k.
Deal economics
- At list price, monthly cash flow is $450 ($5k/yr) — positive.
- The deal already cash-flows at list — no discount required.
- Meets the 1% rule at list price ($2k rent vs $128k).
- Recommended offer: $124k (3.0% below list) — sets the bar for market timing.
- Cap rate 10.5% vs local median 2.5% in Athens — top-decile yield for the area; either an underpriced asset or a hidden risk that comps aren't pricing in. Stress-test before assuming the spread holds.
Location & tenants
- Location reads 72/100 on livability (#241 in TX) — a middle-class / working-renter tenant base. Strengths: cost of living A+, health & safety A+, housing A; Watch: crime D+, amenities F, commute F.
- Athens ISD (town): math 34% / reading 34% proficiency, ranked #548 of 826 in TX (top 66%) — families likely to look elsewhere, expect single-tenant / working-renter base with shorter leases; 62% free/reduced lunch — lower-income household profile, screen leases tightly.
- Zoned schools: Bel Air El (math 34% / reading 35%, grade F, #1,995 of 4,322 statewide, top 50%, 453 students, 83% FRL) — zoned schools average 83% FRL vs 62% district-wide (21 pts higher); higher-poverty schools than district average — tighter screening recommended.
- Market conditions: 188 active listings in the ZIP; 5 comparable units currently listed for rent nearby; rentals lingering (median 44d on market — plan ~5-8 weeks vacancy on turnover, expect pricing pressure); 80% of comp listings sitting > 30 days — soft ceiling on asking rent; 263 units permitted in Henderson County in 2024 (0 in 5+ unit buildings).
Forward outlook
- Local home prices are declining (-3.0%/yr); year-one equity from $885 of loan paydown is wiped out by about $4k of value loss. Plan a longer hold.
- At projected returns (-3.0% appreciation + 3.0% rent growth), your $36k cash investment doubles in ~8 years — after that, you're playing with house money.
Negotiation context
- It's been on market 46 days — a 3% lower offer ($124k) is reasonable based on typical stale-listing flexibility.
Risks & watch-outs
- Watch-outs: built in 1955 — expect roof / HVAC / electrical / plumbing capex.
- Climate carrying-cost: major wind risk, 64% chance of damaging wind over 30y; extreme-heat days projected 7→26/yr by 2055 (HVAC capex compounding) — expect insurance premiums to compound above CPI over the hold.
Questions for the listing agent
- It's been on market 46 days. Have you received any prior offers? Is the seller open to a 3% concession, seller financing, or rate buy-down credit?
- Built in 1955 — when were the roof, HVAC, electrical panel, plumbing, and water heater last replaced?
- Is there a deadline driving the sale (1031 exchange, divorce, estate, relocation)? That informs how much negotiation room exists.
- Schools are D-rated, which usually means shorter tenancies and higher turnover. Who's the typical renter profile here, and what's been the actual vacancy rate?
- Crime grade is D in this area — have there been break-ins, vandalism, or insurance claims at this property in the last 3 years? What carrier currently insures it and at what premium?
- What's the average days-on-market for RENTAL listings here right now (not sales)? A rising rental-DOM trend means longer vacancies and softer asking-rent achievability than the comps imply.
- What's the recent tenant-quality profile in this submarket — average credit score on applications, eviction rate, late-payment / NSF rate, and stable-employment percentage? A property-management company in the area should have these aggregated.
- How much new for-sale + rental construction is in the pipeline within 1–3 miles? Heavy new supply typically softens prices + rents 12–24 months out; constrained supply supports both.
Investment metrics
- 1% rule
- 1.26% ✓
- Cap rate
- 10.51%
- Cash-on-cash
- 15.06%
- DSCR
- 1.67
- GRM
- 6.6
CMA / ARV
- ARV (median comp)
- $168,797
- List price
- $128,000
- Delta
- -24.17%
- Verdict
- UNDERPRICED
- Comps
- 7 within 2.0 mi
Show comp detail 12 sales within ~0.75 mi
| Address | Dist | Beds/Ba | Sqft | Sold | Price | $/sf | Match |
|---|---|---|---|---|---|---|---|
| 709 Southoak Dr | 0.36mi | 3/2.0 | 1,196 (-0%) | 5mo | $135,000 | $113 | 79 |
| 784 Southwood Dr | 0.45mi | 3/2.0 | 1,236 (+3%) | 0mo | $245,000 | $198 | 74 |
| 713 Ruth St | 0.32mi | 3/1.5 | 1,212 (+1%) | 16mo | $165,000 | $136 | 68 |
| 118 W Cayuga Dr | 0.51mi | 3/2.0 | 1,208 (+1%) | 10mo | $200,000 | $166 | 66 |
| 1104 Meadow Dr | 0.42mi | 2/2.0 (-1) | 1,084 (-10%) | 1mo | $174,000 | $161 | 59 |
| 716 Southwood Dr | 0.34mi | 3/2.0 | 1,294 (+8%) | 15mo | $199,000 | $154 | 59 |
| 757 Southwood Dr | 0.47mi | 2/2.0 (-1) | 1,180 (-2%) | 22mo | $195,000 | $165 | 52 |
| 770 Southwood | 0.50mi | 3/2.0 | 1,370 (+14%) | 3mo | $244,000 | $178 | 50 |
| 774 Southwood Dr | 0.50mi | 3/2.0 | 1,277 (+6%) | 21mo | $199,000 | $156 | 49 |
| 737 Southwood Dr | 0.45mi | 2/2.0 (-1) | 1,285 (+7%) | 19mo | $209,500 | $163 | 47 |
| 121 W Clinton Ave | 0.54mi | 3/2.0 | 1,370 (+14%) | 16mo | $105,000 | $77 | 38 |
| 901 Mill Run Rd | 0.68mi | 3/1.5 | 1,072 (-11%) | 20mo | $169,000 | $158 | 32 |
Match score weights: distance 35% · size 25% · config 20% · recency 20%. Top-matched comps best support the ARV.
Projected returns pro-forma
-3.0% appreciation · 3.0% rent growth · sell at horizon
- IRR
- 5.7%
- Equity multiple
- 1.22×
- Total profit
- $7,897
- Equity at exit
- $19,085
- IRR
- 15.1%
- Equity multiple
- 2.22×
- Total profit
- $43,722
- Equity at exit
- $11,067
Cash invested: $35,840 (down + closing). Projections, not guarantees.
Landlord ↔ Tenant lean methodology
- Overall (STATE)
- 87 Strongly Landlord-Friendly
- State Texas
- 87 Strongly Landlord-Friendly · R+5
- County
- — inherits STATE
- City
- — inherits STATE
ZIP-level market 75751
- Home prices YoY
- -33.1%
- Active inventory
- 188
- Price-to-rent
- 6.6×
Monthly cashflow live
- Estimated rent
- $1,615 high interval (Pro) →
- Mortgage (P&I)
- −$671
- Tax from tax record
- −$102 /mo · $1,219/yr
- Insurance
- −$53
- HOA
- −$0
- Vacancy / Maint / Mgmt
- −$339
- Net cashflow
- $450
Break-even live
UW: 25.0% down · 7.5% · 30yr · 1.5% tax · 5.0% vac · 8.0% maint · 8.0% mgmt
Financing live
Cash to close
- Down payment
- $32,000
- Closing costs
- $3,840
- Reserves months
- —
- Total cash needed
- —
Loan-product check · same deal, 3 products live
Conventional
25% down · 7.5% · 30yr
- Down + closing
- —
- Monthly P&I
- —
- Monthly cashflow
- —
- DSCR
- —
- Eligible?
- —
Personal DTI + credit; lowest rate.
DSCR
20% down · 8.5% · 30yr
- Down + closing
- —
- Monthly P&I
- —
- Monthly cashflow
- —
- DSCR
- —
- Eligible?
- —
No personal income docs; deal must DSCR.
Hard money
10% down · 12.0% · 12mo
- Down + closing
- —
- Monthly P&I
- —
- Monthly cashflow
- —
- DSCR
- —
- Eligible?
- —
Short-term bridge; refi at stabilization.
Rent comps 5 comps
| Address | Beds | Baths | Sqft | Rent | $/sqft | DOM | Units | Dist |
|---|---|---|---|---|---|---|---|---|
| 1004 W Cayuga Dr Athens, TX | 4.0 | 2.0 | 1495 | $1,500 | $1.00 | 43d | 1 | 0.24mi |
| 1100 Meadow Dr Athens, TX | 3.0 | 2.0 | 1396 | $1,900 | $1.36 | 43d | 1 | 0.37mi |
| 910 Maryland Dr Athens, TX | 3.0 | 2.5 | 1144 | $1,750 | $1.53 | 43d | 1 | 0.73mi |
| 207 W College St Unit 102 Athens, TX | 2.0 | 1.0 | 900 | $865 | $0.96 | 43d | 1 | 1.38mi |
| 401 S Carroll St Athens, TX | 2.0 | 1.0 | 780 | $1,020 | $1.31 | 21d | 12 | 1.44mi |
Listing history 21 events
-
2026-06-19days on market $128,000 Active 46 DOM
-
2026-06-18days on market $128,000 Active 45 DOM
-
2026-06-17days on market $128,000 Active 44 DOM
-
2026-06-16days on market $128,000 Active 43 DOM
-
2026-06-15days on market $128,000 Active 42 DOM
-
2026-06-14days on market $128,000 Active 40 DOM
-
2026-06-12days on market $128,000 Active 39 DOM
-
2026-06-09days on market $128,000 Active 36 DOM
-
2026-06-08days on market $128,000 Active 35 DOM
-
2026-06-07days on market $128,000 Active 34 DOM
-
2026-06-05pricedays on market $128,000 Active 31 DOM
-
2026-06-03days on market $130,000 Active 30 DOM
-
2026-06-02days on market $130,000 Active 29 DOM
-
2026-06-01days on market $130,000 Active 28 DOM
-
2026-05-31days on market $130,000 Active 27 DOM
-
2026-05-30days on market $130,000 Active 26 DOM
-
2026-05-04$135,000 Active 585-char remark
-
2006-01-10soldstatus
-
2006-01-10soldstatus
-
2005-11-01soldstatus
-
1987-03-10soldstatus
ⓘ Source: listings_history table (triggers on properties + properties_extension) + one-shot
backfill from property_details.listing_events for pre-trigger history.
Tax reassessment forecast TX · Resets to sale price
- Current annual tax
- $1,219 · $102/mo
- Projected year-2 tax
- $2,342 · $195/mo
- Expected delta
- +$1,123/yr (+$94/mo · 92.2%)
ⓘ Screening estimate from a state-policy table — verify with the county assessor before closing.
Climate risk First Street
- Flood 1/10 Low FEMA zone X (unshaded) · 0% chance over 30 yrs
- Wildfire 4/10 Moderate
- Heat 7/10 Severe 7 d/yr ≥110°F today · 26 d/yr by 30 yrs out
- Wind 6/10 Major 64% chance of damaging wind over 30 yrs
- Air quality 2/10 Low 0 unhealthy d/yr today · 1 by 30 yrs out
Nearby sold comps map
Loading sold comps map…
Walkable amenities ~0.75 mi
Loading nearby amenities…
Taxation est. · year 1
- Rental income
- $19,382
- − Mortgage interest
- −$7,170
- − Property taxes
- −$1,219
- − Insurance
- −$640
- − Repairs & maintenance
- −$1,551
- − Management
- −$1,551
- − Depreciation
- −$3,724
- Taxable income
- $3,528
- Est. tax owed @ 24.0%
- −$847
- After-tax cash flow
- $4,551/yr
For passive investors: Depreciation is non-cash, so a rental often shows a tax loss while cash-flowing — sheltering income. Rental losses are passive: they offset passive income freely, and up to $25,000/yr can offset ordinary (W-2) income if you actively participate and your MAGI is under $100k (phasing out to $0 by $150k); unused losses carry forward. On sale, claimed depreciation is recaptured at up to 25%, and gains may owe capital-gains tax (a 1031 exchange can defer both). Figures are a year-1 estimate at your 24.0% rate — not tax advice; consult a CPA.
Schools (NCES district)
- District
- Athens ISD
- NCES district ID
- 4808870
- Math proficiency
- 34% ▼ -9.00%
- Reading proficiency
- 34% ▼ -4.00%
- Median HH income
- $41,617
- Composite
- 28.73/100
- National rank
- #6680
- State rank
- #548 of 826 in TX
Livability — Athens
- Score
- 72/100
- State rank
- #241
- US rank
- #5796
Category grades
Schools grade is shown separately in the Schools card above.
Census & demographics
- Census place
- Athens, TX
- County
- Henderson County · 34,977 people
- City population
- 18,644
- Metro
- Athens, TX
- Population (ZIP)
- 18,644
- Household income
- $70,620
- Rent vs Own
- Severe rent burden
- 535.0
Population outlook (Henderson County) Hauer SSP2
- Today (2025)
- 80,471 people
- By 2030
- 80,608 · +0.2%
- By 2040
- 80,087 · -0.5%
- By 2050
- 78,208 · -2.8%
- By 2075
- 72,423 · -10.0%
- By 2100
- 61,012 · -24.2%
Race, ethnicity, and origin ACS 2023
- Neighborhood character
- Diverse neighborhood (Simpson 0.56)
- Race & ethnicity
- White 60% Hispanic / Latino 24% Two or more races 18% Black 10% Asian 2%
- Hispanic origin (detail)
- Mexican 22%
- Common ancestry
- Slovak 2% Romanian 1% Italian 1%
- Foreign-born
- 8% · Canada
- Languages at home
- 79% English-only · Spanish 19% Other Asian/Pacific 1%
Political lean MEDSL · Henderson
- 2024 margin
- Solid R (+63.5) · D 18.0% · R 81.4%
- 2008→2024 swing
- -18.8pp toward R · 2008: -44.6pp · 2024: -63.5pp
- All cycles
- 2024: R+63.5 2020: R+60.2 2016: R+60.0 2012: R+54.8 2008: R+44.6
Not yet ingested
- Civics
- —
Market trends
- HPI YoY
- ▼ -95.19%
- Current HPI
- 192.3973
- Rent YoY
- —
- Metro
- Athens, TX
- State GDP YoY
- ▲ 3.95%
- F500 in state
- 110
Industry mix (Fortune 500 HQ in TX)
| Industry | F500 HQs | Revenue |
|---|---|---|
| Energy | 16 | $1,198B |
|
||
| Technology | 5 | $198B |
|
||
| Engineering / Construction | 4 | $72B |
|
||
| Energy Services | 3 | $60B |
|
||
| Utilities | 3 | $41B |
|
||
| Healthcare | 2 | $330B |
|
||
Price history
-5.2% since first listed7 events — show timeline
- 2026-06-03 Price Changed $128,000 NTREIS
- 2026-05-21 Price Changed $130,000 NTREIS
- 2026-05-04 Listed $135,000 NTREIS
- 2006-01-10 Sold (Public Records) — Public Records
- 2006-01-10 Sold (Public Records) — Public Records
- 2005-11-01 Sold (Public Records) — Public Records
- 1987-03-10 Sold (Public Records) — Public Records
Property tax history
+3.9%/yrLatest (2025): $1,219 · +0.2% YoY. Source: county tax records.
Cash-flow waterfall
monthlySold comps — $/sqft
last 12 mo · ≤1 miLoading sold comps…