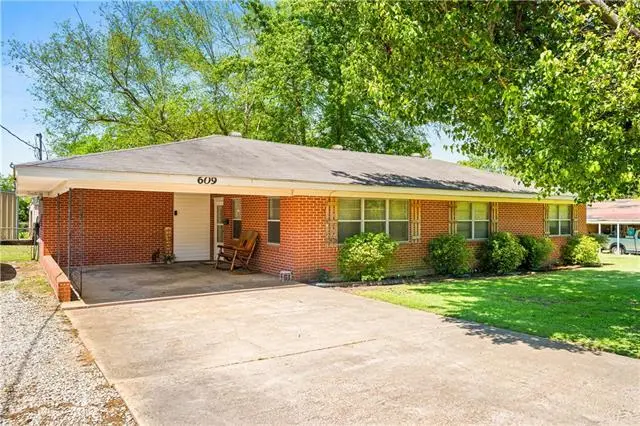
609 N Lee St · Marksville, LA
Flood risk 1/10 · Minimal
- FEMA flood zone
- X
- Chance of flooding over 30 yrs
- 0.0%
- Est. flood insurance / yr
- $507 – $1,088
Fire risk 2/10 · Minimal
- Est. fire insurance / yr
- $1,269 – $2,357
Heat risk 8/10 · Major
- Hot days now (above 110°F)
- 7 days/yr
- Hot days in 30 yrs
- 19 days/yr
Wind risk 8/10 · Major
- Chance of severe wind over 30 yrs
- 99.0%
Air-quality risk 1/10 · Minimal
- Unhealthy air days now
- 0 days/yr
- Unhealthy air days in 30 yrs
- 0 days/yr
Risk factors via First Street. Map © Google.
Why this score? — see what drove the D+ grade
The composite is a weighted blend of 9 inputs, each scored 0–100. Each bar is that input's sub-score; the figure is the points it added to the 100-point composite (weight × sub-score).
- ARV discount +15.0/15.0
- Cash flow +14.9/30.0
- DSCR +4.5/10.0
- 1% rule +3.0/10.0
- Livability +2.6/5.0
- Rent growth +2.5/5.0
- Condition / age +2.5/5.0
- Schools +2.1/10.0
- Appreciation +0.0/10.0
$143,500
🖨 Deal sheet 📄 Offer letter ✓ Due diligence
Listing remarks
Right in the heart of Marksville, LA, this charming 3-bedroom, 1-bath brick home welcomes its new owners. Once inside you will find beautiful vinyl plank flooring throughout, complemented by modern fixtures and a fresh, contemporary design that creates a bright and inviting atmosphere. The functional layout provides comfortable living space with natural lighting and a cozy atmosphere. Step outside to enjoy the spacious yard, complete with a convenient storage shed AND an additional outside building equipped with electricity that can be used for a workshop, office, hobby space, or extra storage. Whether you're a first-time homebuyer or downsizing, this property combines comfort, charm, and p
Key facts
- Natural lighting
- Storage shed
- Functional layout
Tags
Property features AI
Finance
- Other: Property is located between Peterman and Tarleton (directions)
Exterior
- Parking: Carport
- Utilities: Electric service: Entergy
- Home design: Single family residence
- Exterior features: Composition roof; Workshop on property
Interior
- Kitchen: Kitchen (details not specified)
- Bedrooms: Bedroom 1; Bedroom 2; Bedroom 3; Bedroom 4
- Bathrooms: 1 full bathroom
- Heating & cooling: Central heating; Central air conditioning
- Interior features: Living room; Dining room
- Laundry & utility: Laundry room
Neighborhood map
What this means for you Summary
Snapshot
- This is a 3-bed/1.0-bath single-family listed at $144k.
Deal economics
- At list price, monthly cash flow is $41 ($490/yr) — positive.
- The deal already cash-flows at list — no discount required.
- To meet the 1% rule (rent ≥ 1% of price), the offer needs to be $115k (19.8% below list).
- Recommended offer: $115k (19.8% below list) — sets the bar for 1% rule.
Location & tenants
- Location reads 52/100 on livability (#415 in LA) — a working-class tenant base; expect higher turnover. Strengths: cost of living A+; Watch: health & safety C-, schools D, crime F.
- Avoyelles Parish (rural): math 22% / reading 30% proficiency, ranked #56 of 98 in LA (top 57%) — low school quality limits family demand, transient renter base, plan for 1-2y turnover; 75% free/reduced lunch — lower-income household profile, screen leases tightly.
- Market conditions: 75 active listings in the ZIP; 15 units permitted in Avoyelles Parish in 2024 (0 in 5+ unit buildings).
Forward outlook
- Local home prices are declining (-3.0%/yr); year-one equity from $992 of loan paydown is wiped out by about $4k of value loss. Plan a longer hold.
- Avoyelles County population projected at -18% by 2050 — secular population decline; favor cash flow + early exit over multi-decade hold.
Negotiation context
- It's been on market 57 days — a 3% lower offer ($139k) is reasonable based on typical stale-listing flexibility.
- 5 sale attempts since 15y ago with the ask held roughly flat each time — persistent listings suggest the price (not the market) is what's stuck; bring a comps-based counter.
- Current owner paid $118k; 22% above their basis — modest negotiation headroom, anchor on the comps not their cost.
Risks & watch-outs
- Climate carrying-cost: severe wind risk, 99% chance of damaging wind over 30y; extreme-heat days projected 7→19/yr by 2055 (HVAC capex compounding) — expect insurance premiums to compound above CPI over the hold.
Questions for the listing agent
- It's been on market 57 days. Have you received any prior offers? Is the seller open to a 20% concession, seller financing, or rate buy-down credit?
- Is there a deadline driving the sale (1031 exchange, divorce, estate, relocation)? That informs how much negotiation room exists.
- Schools are D-rated, which usually means shorter tenancies and higher turnover. Who's the typical renter profile here, and what's been the actual vacancy rate?
- Crime grade is F in this area — have there been break-ins, vandalism, or insurance claims at this property in the last 3 years? What carrier currently insures it and at what premium?
- The area grade is low — what's the realistic commute time and amenity access for the typical tenant pool here? Any planned neighborhood developments (good or bad) we should know about?
- What's the average days-on-market for RENTAL listings here right now (not sales)? A rising rental-DOM trend means longer vacancies and softer asking-rent achievability than the comps imply.
- What's the recent tenant-quality profile in this submarket — average credit score on applications, eviction rate, late-payment / NSF rate, and stable-employment percentage? A property-management company in the area should have these aggregated.
- How much new for-sale + rental construction is in the pipeline within 1–3 miles? Heavy new supply typically softens prices + rents 12–24 months out; constrained supply supports both.
Investment metrics
- 1% rule
- 0.80% ✗
- Cap rate
- 6.63%
- Cash-on-cash
- 1.22%
- DSCR
- 1.05
- GRM
- 10.4
CMA / ARV
- ARV (on-the-fly)
- $176,000
- Comps found
- 2
Show comp detail 2 sales within ~0.75 mi
| Address | Dist | Beds/Ba | Sqft | Sold | Price | $/sf | Match |
|---|---|---|---|---|---|---|---|
| 124 Market St | 0.19mi | 3/1.5 | 1,498 (+6%) | 0mo | $145,000 | $97 | 78 |
| 633 Oak Ridge Dr | 0.17mi | 3/2.0 | 1,594 (+13%) | 1mo | $200,000 | $125 | 65 |
Match score weights: distance 35% · size 25% · config 20% · recency 20%. Top-matched comps best support the ARV.
Projected returns pro-forma
-3.0% appreciation · 3.0% rent growth · sell at horizon
- IRR
- -14.4%
- Equity multiple
- 0.48×
- Total profit
- $-20,713
- Equity at exit
- $21,396
- IRR
- -5.7%
- Equity multiple
- 0.63×
- Total profit
- $-14,927
- Equity at exit
- $12,407
Cash invested: $40,180 (down + closing). Projections, not guarantees.
Landlord ↔ Tenant lean methodology
- Overall (STATE)
- 90 Strongly Landlord-Friendly
- State Louisiana
- 90 Strongly Landlord-Friendly · R+12
- County
- — inherits STATE
- City
- — inherits STATE
ZIP-level market 71351
- Active inventory
- 75
- Price-to-rent
- 10.4×
Monthly cashflow live
- Estimated rent
- $1,152 medium interval (Pro) →
- Mortgage (P&I)
- −$753
- Tax from tax record
- −$57 /mo · $679/yr
- Insurance
- −$60
- HOA
- −$0
- Vacancy / Maint / Mgmt
- −$242
- Net cashflow
- $41
Break-even live
UW: 25.0% down · 7.5% · 30yr · 1.5% tax · 5.0% vac · 8.0% maint · 8.0% mgmt
Financing live
Cash to close
- Down payment
- $35,875
- Closing costs
- $4,305
- Reserves months
- —
- Total cash needed
- —
Loan-product check · same deal, 3 products live
Conventional
25% down · 7.5% · 30yr
- Down + closing
- —
- Monthly P&I
- —
- Monthly cashflow
- —
- DSCR
- —
- Eligible?
- —
Personal DTI + credit; lowest rate.
DSCR
20% down · 8.5% · 30yr
- Down + closing
- —
- Monthly P&I
- —
- Monthly cashflow
- —
- DSCR
- —
- Eligible?
- —
No personal income docs; deal must DSCR.
Hard money
10% down · 12.0% · 12mo
- Down + closing
- —
- Monthly P&I
- —
- Monthly cashflow
- —
- DSCR
- —
- Eligible?
- —
Short-term bridge; refi at stabilization.
Listing history 25 events
-
2026-06-19days on market $143,500 Active 57 DOM
-
2026-06-18days on market $143,500 Active 56 DOM
-
2026-06-17days on market $143,500 Active 55 DOM
-
2026-06-16days on market $143,500 Active 54 DOM
-
2026-06-15days on market $143,500 Active 53 DOM
-
2026-06-14days on market $143,500 Active 51 DOM
-
2026-06-13days on market $143,500 Active 50 DOM
-
2026-06-10days on market $143,500 Active 48 DOM
-
2026-06-09days on market $143,500 Active 47 DOM
-
2026-06-08days on market $143,500 Active 46 DOM
-
2026-06-07days on market $143,500 Active 45 DOM
-
2026-06-03days on market $143,500 Active 41 DOM
-
2026-06-02days on market $143,500 Active 40 DOM
-
2026-06-01days on market $143,500 Active 39 DOM
-
2026-05-31days on market $143,500 Active 38 DOM
-
2026-05-30days on market $143,500 Active 37 DOM
-
2026-05-08status Active
-
2026-04-26status Pending
-
2026-04-10$143,500 Active
-
2014-10-30soldstatus $118,000
-
2014-08-08$120,000
-
2014-03-27$135,000
-
2012-03-08soldstatus $105,000
-
2011-01-14$115,000
-
2004-12-22soldstatus $77,500
ⓘ Source: listings_history table (triggers on properties + properties_extension) + one-shot
backfill from property_details.listing_events for pre-trigger history.
Tax reassessment forecast LA · Resets to sale price
- Current annual tax
- $679 · $57/mo
- Projected year-2 tax
- $789 · $66/mo
- Expected delta
- +$110/yr (+$9/mo · 16.2%)
ⓘ Screening estimate from a state-policy table — verify with the county assessor before closing.
Climate risk First Street
- Flood 1/10 Low FEMA zone X · 0% chance over 30 yrs
- Wildfire 2/10 Low
- Heat 8/10 Severe 7 d/yr ≥110°F today · 19 d/yr by 30 yrs out
- Wind 8/10 Severe 99% chance of damaging wind over 30 yrs
- Air quality 1/10 Low 0 unhealthy d/yr today · 0 by 30 yrs out
Nearby sold comps map
Loading sold comps map…
Walkable amenities ~0.75 mi
Loading nearby amenities…
Taxation est. · year 1
- Rental income
- $13,818
- − Mortgage interest
- −$8,038
- − Property taxes
- −$679
- − Insurance
- −$718
- − Repairs & maintenance
- −$1,105
- − Management
- −$1,105
- − Depreciation
- −$4,175
- Taxable loss
- −$2,002
- Est. tax savings @ 24.0%
- +$480
- After-tax cash flow
- $970/yr
For passive investors: Depreciation is non-cash, so a rental often shows a tax loss while cash-flowing — sheltering income. Rental losses are passive: they offset passive income freely, and up to $25,000/yr can offset ordinary (W-2) income if you actively participate and your MAGI is under $100k (phasing out to $0 by $150k); unused losses carry forward. On sale, claimed depreciation is recaptured at up to 25%, and gains may owe capital-gains tax (a 1031 exchange can defer both). Figures are a year-1 estimate at your 24.0% rate — not tax advice; consult a CPA.
Schools (NCES district)
- District
- Avoyelles Parish
- NCES district ID
- 2200150
- Math proficiency
- 22% ▼ -32.00%
- Reading proficiency
- 30% ▼ -29.00%
- Median HH income
- $33,891
- Composite
- 21.32/100
- National rank
- #8378
- State rank
- #56 of 98 in LA
Livability — Marksville
- Score
- 52/100
- State rank
- #415
- US rank
- #25114
Category grades
Schools grade is shown separately in the Schools card above.
Census & demographics
- Census place
- Marksville, LA
- Population (ZIP)
- 11,494
Population outlook (Avoyelles County) Hauer SSP2
- Today (2025)
- 39,084 people
- By 2030
- 37,784 · -3.3%
- By 2040
- 35,049 · -10.3%
- By 2050
- 32,225 · -17.5%
- By 2075
- 25,695 · -34.3%
- By 2100
- 18,985 · -51.4%
Race, ethnicity, and origin ACS 2023
- Neighborhood character
- Majority White (62%)
- Race & ethnicity
- White 62% Black 25% Two or more races 8% Hispanic / Latino 2% Native American 2% Asian 1%
- Common ancestry
- Lithuanian 22% Iranian 1%
- Foreign-born
- 2% · Canada, China, Vietnam
- Languages at home
- 91% English-only · French/Haitian/Cajun 7% Spanish 1% Chinese 1%
Political lean MEDSL · Avoyelles
- 2024 margin
- Solid R (+43.1) · D 27.8% · R 71.0% · Other 1.2%
- 2008→2024 swing
- -20.1pp toward R · 2008: -23.1pp · 2024: -43.1pp
- All cycles
- 2024: R+43.1 2020: R+40.8 2016: R+37.0 2012: R+27.0 2008: R+23.1
Not yet ingested
- Civics
- —
Market trends
- HPI YoY
- ▼ -66.16%
- Current HPI
- 95.5318
- Rent YoY
- —
- Metro
- —
- State GDP YoY
- ▲ 3.29%
- F500 in state
- 10
Industry mix (Fortune 500 HQ in LA)
| Industry | F500 HQs | Revenue |
|---|---|---|
| Telecommunications | 2 | $23B |
|
||
| Utilities | 1 | $12B |
|
||
| Wholesale / Distribution | 1 | $5B |
|
||
| Advertising | 1 | $2B |
|
||
Price history
+85.2% since first listed9 events — show timeline
- 2026-05-08 Relisted — AcadianaMLS
- 2026-04-26 Pending — AcadianaMLS
- 2026-04-10 Listed $143,500 AcadianaMLS
- 2014-10-30 Sold (Public Records) $118,000 Public Records
- 2014-08-08 Listed $120,000 AcadianaMLS
- 2014-03-27 Listed $135,000 AcadianaMLS
- 2012-03-08 Sold (Public Records) $105,000 Public Records
- 2011-01-14 Listed $115,000 AcadianaMLS
- 2004-12-22 Sold (Public Records) $77,500 Public Records
Property tax history
+1.2%/yrLatest (2025): $679 · +0.0% YoY. Source: county tax records.
Cash-flow waterfall
monthlySold comps — $/sqft
last 12 mo · ≤1 miLoading sold comps…