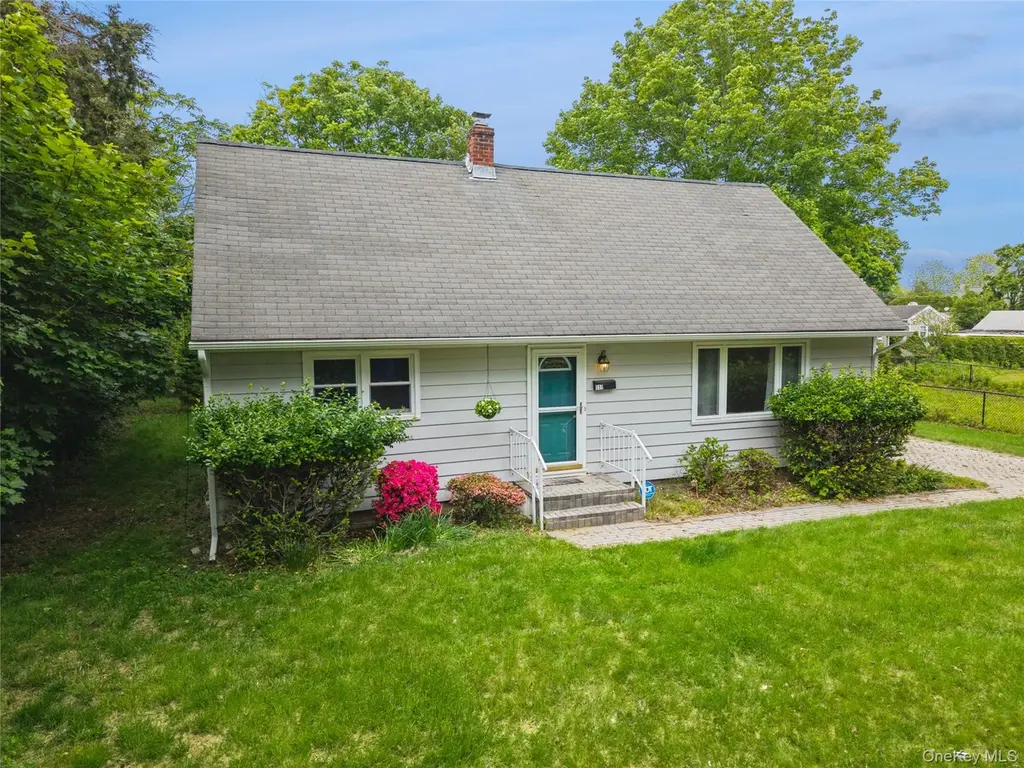
111 Miller Rd · Southampton, NY
Flood risk 1/10 · Minimal
- FEMA flood zone
- X (unshaded)
- Chance of flooding over 30 yrs
- 0.0%
- Est. flood insurance / yr
- $473 – $860
Fire risk 2/10 · Minimal
- Est. fire insurance / yr
- $691 – $1,283
Heat risk 4/10 · Minor
- Hot days now (above 90°F)
- 7 days/yr
- Hot days in 30 yrs
- 20 days/yr
Wind risk 8/10 · Major
- Chance of severe wind over 30 yrs
- 80.0%
Air-quality risk 3/10 · Minor
- Unhealthy air days now
- 3 days/yr
- Unhealthy air days in 30 yrs
- 4 days/yr
Risk factors via First Street. Map © Google.
Why this score? — see what drove the C+ grade
The composite is a weighted blend of 9 inputs, each scored 0–100. Each bar is that input's sub-score; the figure is the points it added to the 100-point composite (weight × sub-score).
- Cash flow +20.8/30.0
- ARV discount +15.0/15.0
- DSCR +6.6/10.0
- 1% rule +5.5/10.0
- Rent growth +5.0/5.0
- Schools +4.8/10.0
- Livability +3.5/5.0
- Condition / age +2.5/5.0
- Appreciation +0.0/10.0
$1,800,000
🖨 Deal sheet 📄 Offer letter ✓ Due diligence
Listing remarks
Nestled in the heart of Southampton, south of Route 27 and much larger than it appears; his charming half-dormered Cape offers the perfect blend of classic character and thoughtful modern updates. With 4 bedrooms, 2 full bathrooms, and hardwood flooring throughout most of the home, this property delivers warmth, functionality, and an unbeatable location close to everything the Hamptons lifestyle has to offer. The main level welcomes you with a sun-filled formal living room featuring an oversized picture window that fills the space with natural light. Just beyond is a formal dining room accented by updated modern lighting and direct access to the backyard—ideal for indoor/outdoor enter
Key facts
- Formal dining room
- New cabinetry
- Half-dormered cape
Tags
Property features AI
Exterior
- Parking: Driveway
- Utilities: Cesspool sewer; Electricity connected; Water connected
- Home design: Single family residence; Two levels; Dormer attic
- Construction: Asbestos and vinyl siding exterior; Basement: full, unfinished with Bilco doors
- Exterior features: Outdoor lighting; Mailbox; Rain gutters; Back yard; Front yard; Cleared, level lot
Interior
- Kitchen: Gas oven; Gas range; Range; Oven; Microwave; Indirect water heater
- Bedrooms: Two-level home (rooms across levels); includes a first-floor bedroom
- Flooring: Hardwood floors; Tile floors
- Bathrooms: 2 full bathrooms
- Heating & cooling: Oil heating; No central air
- Interior features: First-floor bedroom; First-floor full bath; Formal dining room; Stone counters; Walk-through kitchen; Walk-in closet(s); Washer/dryer hookup
- Laundry & utility: Washer hookup in basement; Laundry area in basement
Neighborhood map
What this means for you Summary
Snapshot
- This is a 3-bed/1.0-bath single-family listed at $1.80M.
Deal economics
- At list price, monthly cash flow is $2k ($29k/yr) — positive.
- The deal already cash-flows at list — no discount required.
- Meets the 1% rule at list price ($19k rent vs $1.80M).
- Recommended offer: $1.77M (1.5% below list) — sets the bar for market timing.
- Cap rate 7.9% vs local median 2.8% in Southampton — top-decile yield for the area; either an underpriced asset or a hidden risk that comps aren't pricing in. Stress-test before assuming the spread holds.
Location & tenants
- Location reads 69/100 on livability (#472 in NY) — a middle-class / working-renter tenant base. Strengths: crime A+, employment A+; Watch: commute D+, amenities F, cost of living F.
- Southampton Union Free School District (suburban): math 53% / reading 51% proficiency, ranked #293 of 590 in NY (top 50%) — acceptable for families but not a draw, mixed tenant base, ~2y average lease.
- Zoned schools: Southampton Elementary School (math 42% / reading 57%, grade D, #1,085 of 2,108 statewide, top 56%, 376 students, 51% FRL); Southampton Intermediate School (math 30% / reading 47%, grade F, #437 of 729 statewide, top 60%, 363 students, 44% FRL); Southampton High School (math 98%, 595 students, 48% FRL) — zoned schools average 48% FRL vs 30% district-wide (17 pts higher); higher-poverty schools than district average — tighter screening recommended.
- Market conditions: Rents rising fast (+14.6%/yr); 95 active listings in the ZIP; 9 comparable units currently listed for rent nearby; rentals lingering (median 44d on market — plan ~5-8 weeks vacancy on turnover, expect pricing pressure); 67% of comp listings sitting > 30 days — soft ceiling on asking rent; high-income renter base; 1,366 units permitted in Suffolk County in 2024 (216 in 5+ unit buildings).
- At $18,855/mo this rent would consume 145% of the median local household income ($156k/yr) (locally 274% of renters already pay >50% of income on rent) — very limited rent-growth headroom before tenants either downsize or default.
Forward outlook
- Local home prices are declining (-3.0%/yr); year-one equity from $12k of loan paydown is wiped out by about $54k of value loss. Plan a longer hold.
- Suffolk County population projected to shrink 5% by 2050 — rents likely to lag national; underwrite the cash flow, not the appreciation.
- At projected returns (-3.0% appreciation + 8.0% rent growth), your $504k cash investment doubles in ~9 years — after that, you're playing with house money.
Negotiation context
- It's been on market 21 days — a 2% lower offer ($1.77M) is reasonable based on typical stale-listing flexibility.
Risks & watch-outs
- Climate carrying-cost: severe wind risk, 80% chance of damaging wind over 30y — expect insurance premiums to compound above CPI over the hold.
Questions for the listing agent
- Built in 1974 — when were the roof, HVAC, electrical panel, plumbing, and water heater last replaced?
- Is there a deadline driving the sale (1031 exchange, divorce, estate, relocation)? That informs how much negotiation room exists.
- What's the average days-on-market for RENTAL listings here right now (not sales)? A rising rental-DOM trend means longer vacancies and softer asking-rent achievability than the comps imply.
- What's the recent tenant-quality profile in this submarket — average credit score on applications, eviction rate, late-payment / NSF rate, and stable-employment percentage? A property-management company in the area should have these aggregated.
- How much new for-sale + rental construction is in the pipeline within 1–3 miles? Heavy new supply typically softens prices + rents 12–24 months out; constrained supply supports both.
Investment metrics
- 1% rule
- 1.05% ✓
- Cap rate
- 7.93%
- Cash-on-cash
- 5.85%
- DSCR
- 1.26
- GRM
- 8.0
CMA / ARV
- ARV (on-the-fly)
- $2,638,868
- Comps found
- 2
Show comp detail 2 sales within ~0.75 mi
| Address | Dist | Beds/Ba | Sqft | Sold | Price | $/sf | Match |
|---|---|---|---|---|---|---|---|
| 179 Elm St | 0.68mi | 3/1.5 | 1,604 (-2%) | 1mo | $2,100,000 | $1,309 | 62 |
| 86 Hildreth St | 0.69mi | 3/4.0 | 1,674 (+2%) | 17mo | $2,700,000 | $1,613 | 38 |
Match score weights: distance 35% · size 25% · config 20% · recency 20%. Top-matched comps best support the ARV.
Projected returns pro-forma
-3.0% appreciation · 8.0% rent growth · sell at horizon
- IRR
- -1.8%
- Equity multiple
- 0.93×
- Total profit
- $-35,338
- Equity at exit
- $268,386
- IRR
- 12.7%
- Equity multiple
- 2.24×
- Total profit
- $625,304
- Equity at exit
- $155,631
Cash invested: $504,000 (down + closing). Projections, not guarantees.
Landlord ↔ Tenant lean methodology
- Overall (STATE)
- 15 Strongly Tenant-Friendly
- State New York
- 15 Strongly Tenant-Friendly · D+10
- County
- — inherits STATE
- City
- — inherits STATE
ZIP-level market 11968
- Home prices YoY
- -28.6%
- Rents YoY
- 14.6%
- Active inventory
- 95
- Price-to-rent
- 8.0×
Monthly cashflow live
- Estimated rent
- $18,855 medium interval (Pro) →
- Mortgage (P&I)
- −$9,439
- Tax est. 1.5%
- −$2,250 /mo · $27,000/yr
- Insurance
- −$750
- HOA
- −$0
- Vacancy / Maint / Mgmt
- −$3,959
- Net cashflow
- $2,456
Break-even live
UW: 25.0% down · 7.5% · 30yr · 1.5% tax · 5.0% vac · 8.0% maint · 8.0% mgmt
Financing live
Cash to close
- Down payment
- $450,000
- Closing costs
- $54,000
- Reserves months
- —
- Total cash needed
- —
Loan-product check · same deal, 3 products live
Conventional
25% down · 7.5% · 30yr
- Down + closing
- —
- Monthly P&I
- —
- Monthly cashflow
- —
- DSCR
- —
- Eligible?
- —
Personal DTI + credit; lowest rate.
DSCR
20% down · 8.5% · 30yr
- Down + closing
- —
- Monthly P&I
- —
- Monthly cashflow
- —
- DSCR
- —
- Eligible?
- —
No personal income docs; deal must DSCR.
Hard money
10% down · 12.0% · 12mo
- Down + closing
- —
- Monthly P&I
- —
- Monthly cashflow
- —
- DSCR
- —
- Eligible?
- —
Short-term bridge; refi at stabilization.
Rent comps 9 comps
| Address | Beds | Baths | Sqft | Rent | $/sqft | DOM | Units | Dist |
|---|---|---|---|---|---|---|---|---|
| 40 Roman Rd Southampton, NY | 3.0 | 3.0 | 1912 | $6,500 | $3.40 | 43d | 1 | 0.63mi |
| 393 Hill St Southampton, NY | 3.0 | 2.0 | 1345 | $35,000 | $26.02 | 43d | 1 | 0.66mi |
| 36 Corrigan St Southampton, NY | 3.0 | 3.5 | 2089 | $20,000 | $9.57 | 13d | 1 | 0.79mi |
| 669 Hill St Southampton, NY | 3.0 | 2.0 | 2000 | $75,000 | $37.50 | 43d | 1 | 1.07mi |
| 10 Leland Ln #35 Southampton, NY | 2.0 | 2.0 | 1092 | $29,000 | $26.56 | 19d | 1 | 1.20mi |
| 10 Leland Ln #19 Southampton, NY | 3.0 | 3.0 | 1400 | $30,000 | $21.43 | 43d | 1 | 1.20mi |
| 3 Meadowgrass Ln Southampton, NY | 3.0 | 2.0 | 1434 | $84,000 | $58.58 | 43d | 1 | 1.31mi |
| 520 Hampton Rd #18 Southampton, NY | 3.0 | 3.5 | 2250 | $99,000 | $44.00 | 43d | 1 | 1.35mi |
| 570 Hampton Rd #28 Southampton, NY | 2.0 | 2.0 | 1400 | $55,000 | $39.29 | 22d | 1 | 1.49mi |
Listing history 14 events
-
2026-06-18days on market $1,800,000 Active 21 DOM
-
2026-06-17days on market $1,800,000 Active 20 DOM
-
2026-06-16days on market $1,800,000 Active 19 DOM
-
2026-06-15days on market $1,800,000 Active 18 DOM
-
2026-06-13days on market $1,800,000 Active 16 DOM
-
2026-06-13days on market $1,800,000 Active 15 DOM
-
2026-06-09days on market $1,800,000 Active 12 DOM
-
2026-06-08days on market $1,800,000 Active 11 DOM
-
2026-06-07days on market $1,800,000 Active 10 DOM
-
2026-06-04days on market $1,800,000 Active 7 DOM
-
2026-06-03days on market $1,800,000 Active 6 DOM
-
2026-06-02days on market $1,800,000 Active 5 DOM
-
2026-06-01days on market $1,800,000 Active 4 DOM
-
2026-05-31days on market $1,800,000 Active 3 DOM
ⓘ Source: listings_history table (triggers on properties + properties_extension) + one-shot
backfill from property_details.listing_events for pre-trigger history.
Climate risk First Street
- Flood 1/10 Low FEMA zone X (unshaded) · 0% chance over 30 yrs
- Wildfire 2/10 Low
- Heat 4/10 Moderate 7 d/yr ≥90°F today · 20 d/yr by 30 yrs out
- Wind 8/10 Severe 80% chance of damaging wind over 30 yrs
- Air quality 3/10 Moderate 3 unhealthy d/yr today · 4 by 30 yrs out
Nearby sold comps map
Loading sold comps map…
Walkable amenities ~0.75 mi
Loading nearby amenities…
Taxation est. · year 1
- Rental income
- $226,256
- − Mortgage interest
- −$100,828
- − Property taxes
- −$27,000
- − Insurance
- −$9,000
- − Repairs & maintenance
- −$18,101
- − Management
- −$18,101
- − Depreciation
- −$52,364
- Taxable income
- $864
- Est. tax owed @ 24.0%
- −$207
- After-tax cash flow
- $29,262/yr
For passive investors: Depreciation is non-cash, so a rental often shows a tax loss while cash-flowing — sheltering income. Rental losses are passive: they offset passive income freely, and up to $25,000/yr can offset ordinary (W-2) income if you actively participate and your MAGI is under $100k (phasing out to $0 by $150k); unused losses carry forward. On sale, claimed depreciation is recaptured at up to 25%, and gains may owe capital-gains tax (a 1031 exchange can defer both). Figures are a year-1 estimate at your 24.0% rate — not tax advice; consult a CPA.
Schools (NCES district)
- District
- Southampton Union Free School District
- NCES district ID
- 3627540
- Math proficiency
- 53% ▬ 0.00%
- Reading proficiency
- 51% ▲ 4.00%
- Median HH income
- $85,977
- Composite
- 47.9/100
- National rank
- #2213
- State rank
- #293 of 590 in NY
Livability — Southampton
- Score
- 69/100
- State rank
- #472
- US rank
- #8333
Category grades
Schools grade is shown separately in the Schools card above.
Census & demographics
- Census place
- Southampton, NY
- County
- Suffolk County · 679,920 people
- City population
- 15,312
- Metro
- New York-Newark-Jersey City, NY-NJ-PA
- Population (ZIP)
- 15,312
- Household income
- $156,219
- Rent vs Own
- Severe rent burden
- 274.0
Population outlook (Suffolk County) Hauer SSP2
- Today (2025)
- 1,505,262 people
- By 2030
- 1,498,318 · -0.5%
- By 2040
- 1,471,101 · -2.3%
- By 2050
- 1,424,848 · -5.3%
- By 2075
- 1,337,157 · -11.2%
- By 2100
- 1,217,720 · -19.1%
Race, ethnicity, and origin ACS 2023
- Neighborhood character
- Predominantly White (71%)
- Race & ethnicity
- White 71% Hispanic / Latino 13% Two or more races 10% Black 9% Asian 3% Native American 2%
- Hispanic origin (detail)
- Mexican 3% Puerto Rican 2%
- Common ancestry
- Romanian 5% Scotch-Irish 2% Danish 2%
- Foreign-born
- 15% · Canada, Jamaica, Vietnam
- Languages at home
- 81% English-only · Spanish 11% Other Indo-European 3% German/W. Germanic 2%
Political lean MEDSL · Suffolk
- 2024 margin
- Lean R (+10.0) · D 45.0% · R 55.0%
- 2008→2024 swing
- -16.0pp toward R · 2008: 6.0pp · 2024: -10.0pp
- All cycles
- 2024: R+10.0 2020: R+0.0 2016: R+8.2 2012: D+2.9 2008: D+6.0
Not yet ingested
- Civics
- —
Market trends
- HPI YoY
- ▼ -184.86%
- Current HPI
- 461.1144
- Rent YoY
- ▲ 14.62%
- Metro
- New York-Newark-Jersey City, NY-NJ-PA
- State GDP YoY
- ▲ 2.60%
- F500 in state
- 92
Industry mix (Fortune 500 HQ in NY)
| Industry | F500 HQs | Revenue |
|---|---|---|
| Financial Services | 10 | $950B |
|
||
| Consumer Goods | 9 | $162B |
|
||
| Insurance | 4 | $225B |
|
||
| Telecommunications | 2 | $144B |
|
||
| Pharmaceuticals | 2 | $112B |
|
||
| Media / Entertainment | 2 | $69B |
|
||
Price history
1 event — show timeline
- 2025-09-29 Listed $1,800,000 OneKey® MLS as Distributed by MLS Grid
Property tax history
-5.1%/yrLatest (2022): $509 · +0.0% YoY. Source: county tax records.
Cash-flow waterfall
monthlySold comps — $/sqft
last 12 mo · ≤1 miLoading sold comps…