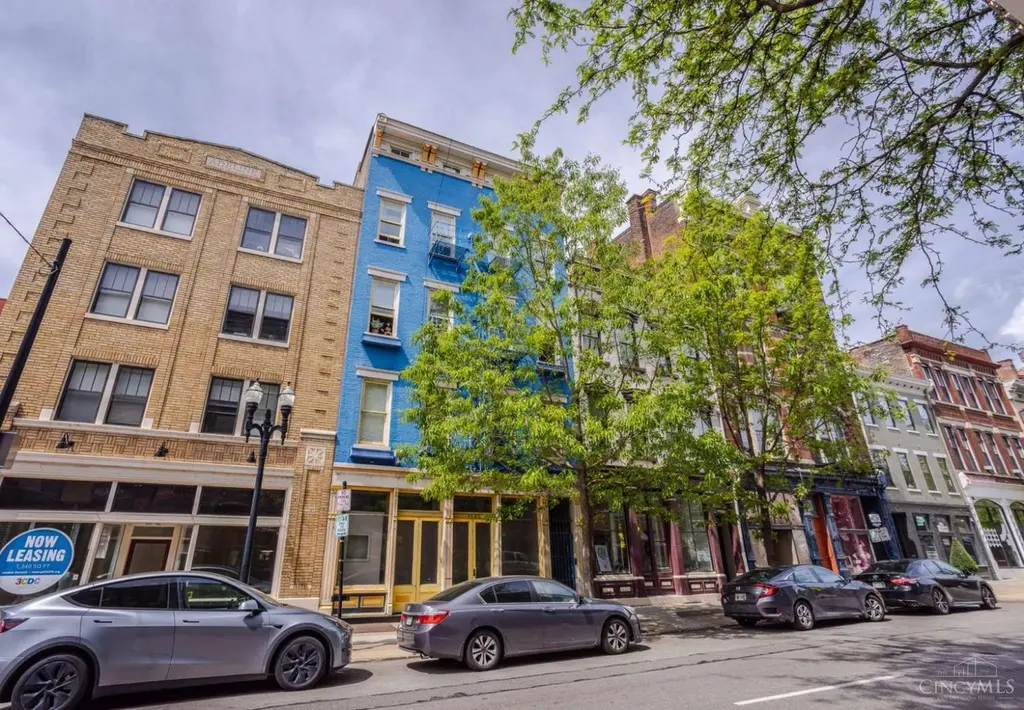
1407 Main St #4 · Cincinnati, OH
Flood risk 7/10 · Major
- FEMA flood zone
- X (unshaded)
- Chance of flooding over 30 yrs
- 0.99%
- Est. flood insurance / yr
- $507 – $1,088
Fire risk 1/10 · Minimal
- Est. fire insurance / yr
- $713 – $1,323
Heat risk 5/10 · Moderate
- Hot days now (above 103°F)
- 7 days/yr
- Hot days in 30 yrs
- 19 days/yr
Wind risk 2/10 · Minimal
- Chance of severe wind over 30 yrs
- 1.0%
Air-quality risk 3/10 · Minor
- Unhealthy air days now
- 2 days/yr
- Unhealthy air days in 30 yrs
- 3 days/yr
Risk factors via First Street. Map © Google.
Why this score? — see what drove the D grade
The composite is a weighted blend of 9 inputs, each scored 0–100. Each bar is that input's sub-score; the figure is the points it added to the 100-point composite (weight × sub-score).
- Cash flow +14.5/30.0
- ARV discount +7.5/15.0
- 1% rule +5.2/10.0
- DSCR +4.4/10.0
- Livability +4.0/5.0
- Rent growth +3.2/5.0
- Schools +2.5/10.0
- Condition / age +2.5/5.0
- Appreciation +0.0/10.0
$450,000
🖨 Deal sheet 📄 Offer letter ✓ Due diligence
Listing remarks MLS
Amazing 3 bdrm, 1.5 bath condo in the heart of OTR! 2,217 sq ft on 2 floors, with sliding glass barn doors, exposed brick, eat-in kitchen, open dining/living room, private balcony and gated courtyard. 1 parking spot at Ziegler Parking Garage included for 2017 @ $95/month. Also has on street parking. Motivated seller. Agent is owner.
Key facts
- Exposed brick
- Historic building
- Multi-level condo
Tags
Property features AI
Finance
- Other: Zoned residential; Lease not considered
- HOA & community: HOA with a monthly fee of $254 covering water and sewer
Exterior
- Utilities: Public water; Public sewer; Natural gas; Electric water heater
- Home design: Contemporary/Modern and Historical architectural elements; High-rise building (unit entry level 4); Two levels
- Construction: Brick exterior; Membrane roof; Other foundation
- Exterior features: Balcony; Vinyl windows
Interior
- Kitchen: Kitchen approximately 14 x 9; Dishwasher; Gas cooktop; Oven/Range; Garbage disposal; Refrigerator
- Bedrooms: Three bedrooms, each about 16 x 12 (primary on level 1)
- Bathrooms: Two full bathrooms (one on level 1, one on level 2)
- Heating & cooling: Variable speed HVAC
- Interior features: 8 total rooms; Full unfinished basement; Home warranty included
- Laundry & utility: Washer and dryer
Neighborhood map
What this means for you Summary
Snapshot
- This is a 3-bed/2.0-bath condo listed at $450k.
Deal economics
- At list price, monthly cash flow is $33 ($402/yr) — positive.
- The deal already cash-flows at list — no discount required.
- Meets the 1% rule at list price ($5k rent vs $450k).
- Recommended offer: $443k (1.5% below list) — sets the bar for market timing.
- Cap rate 6.6% vs local median 3.9% in Cincinnati — top-decile yield for the area; either an underpriced asset or a hidden risk that comps aren't pricing in. Stress-test before assuming the spread holds.
Location & tenants
- Location reads 80/100 on livability (#130 in OH, #1,856 nationally) — a professional / high-income tenant draw. Strengths: amenities A+, commute A+, cost of living A+; Watch: employment D, crime F.
- Cincinnati Public Schools (urban): math 25% / reading 36% proficiency, ranked #581 of 656 in OH (top 89%) — families likely to look elsewhere, expect single-tenant / working-renter base with shorter leases; 70% free/reduced lunch — lower-income household profile, screen leases tightly.
- Market conditions: Rents rising (+2.7%/yr); 154 active listings in the ZIP; 40 comparable units currently listed for rent nearby; rentals leasing fast (median 11d on market — plan ~1-2 weeks tenant-placement turnaround); solid renter incomes; 801 units permitted in Hamilton County in 2024 (190 in 5+ unit buildings).
- At $4,592/mo this rent would consume 58% of the median local household income ($96k/yr) (locally 1514% of renters already pay >50% of income on rent) — very limited rent-growth headroom before tenants either downsize or default.
Forward outlook
- Local home prices are declining (-3.0%/yr); year-one equity from $3k of loan paydown is wiped out by about $14k of value loss. Plan a longer hold.
Negotiation context
- It's been on market 28 days — a 2% lower offer ($443k) is reasonable based on typical stale-listing flexibility.
- 6 sale attempts since 10y ago with the ask held roughly flat each time — persistent listings suggest the price (not the market) is what's stuck; bring a comps-based counter.
- Current owner paid $290k; list at $450k implies a 55% gain — meaningful room to come down on a strong offer.
Risks & watch-outs
- Watch-outs: flood insurance adds $66/mo; built in 1885 — expect roof / HVAC / electrical / plumbing capex.
- Climate carrying-cost: major flood risk; extreme-heat days projected 7→19/yr by 2055 (HVAC capex compounding) — expect insurance premiums to compound above CPI over the hold.
Questions for the listing agent
- Built in 1885 — when were the roof, HVAC, electrical panel, plumbing, and water heater last replaced?
- What's the actual annual flood-insurance premium (NFIP or private), and is the property in a SFHA with mandatory coverage?
- What does the HOA fee cover, when was the last increase, and are there any pending special assessments or reserve-fund shortfalls?
- Any open or pending special assessments — roof, HVAC, plumbing, elevator, façade? What's the per-unit balance and payoff schedule, and is the seller paying it off at close or rolling it to the buyer?
- Is there a deadline driving the sale (1031 exchange, divorce, estate, relocation)? That informs how much negotiation room exists.
- Schools are B-rated — typically a magnet for longer-tenancy family renters. What's the average tenant stay here, and is there a school-zone premium baked into asking?
- Crime grade is F in this area — have there been break-ins, vandalism, or insurance claims at this property in the last 3 years? What carrier currently insures it and at what premium?
- The area grade is low — what's the realistic commute time and amenity access for the typical tenant pool here? Any planned neighborhood developments (good or bad) we should know about?
- What's the average days-on-market for RENTAL listings here right now (not sales)? A rising rental-DOM trend means longer vacancies and softer asking-rent achievability than the comps imply.
- What's the recent tenant-quality profile in this submarket — average credit score on applications, eviction rate, late-payment / NSF rate, and stable-employment percentage? A property-management company in the area should have these aggregated.
- How much new apartment / multifamily construction is in the pipeline within 1–3 miles? Heavy new supply (>2% of stock underway) typically softens rents 12–24 months out; light construction supports rent growth.
Investment metrics
- 1% rule
- 1.02% ✓
- Cap rate
- 6.56%
- Cash-on-cash
- 0.95%
- DSCR
- 1.04
- GRM
- 8.2
CMA / ARV
No comps found within radius.
Projected returns pro-forma
-3.0% appreciation · 2.7% rent growth · sell at horizon
- IRR
- -16.1%
- Equity multiple
- 0.43×
- Total profit
- $-71,802
- Equity at exit
- $67,096
- IRR
- -8.2%
- Equity multiple
- 0.49×
- Total profit
- $-63,923
- Equity at exit
- $38,908
Cash invested: $126,000 (down + closing). Projections, not guarantees.
Landlord ↔ Tenant lean methodology
- Overall (STATE)
- 73 Landlord-Friendly
- State Ohio
- 73 Landlord-Friendly · R+6
- County
- — inherits STATE
- City
- — inherits STATE
ZIP-level market 45202
- Rents YoY
- 2.7%
- Active inventory
- 154
- Price-to-rent
- 8.2×
Monthly cashflow live
- Estimated rent
- $4,592 high interval (Pro) →
- Mortgage (P&I)
- −$2,360
- Tax from tax record
- −$726 /mo · $8,718/yr
- Insurance
- −$188
- Flood insurance flood zone
- −$66 /mo · $798/yr
- HOA
- −$254
- Vacancy / Maint / Mgmt
- −$964
- Net cashflow
- $33
Break-even live
UW: 25.0% down · 7.5% · 30yr · 1.5% tax · 5.0% vac · 8.0% maint · 8.0% mgmt
Financing live
Cash to close
- Down payment
- $112,500
- Closing costs
- $13,500
- Reserves months
- —
- Total cash needed
- —
Loan-product check · same deal, 3 products live
Conventional
25% down · 7.5% · 30yr
- Down + closing
- —
- Monthly P&I
- —
- Monthly cashflow
- —
- DSCR
- —
- Eligible?
- —
Personal DTI + credit; lowest rate.
DSCR
20% down · 8.5% · 30yr
- Down + closing
- —
- Monthly P&I
- —
- Monthly cashflow
- —
- DSCR
- —
- Eligible?
- —
No personal income docs; deal must DSCR.
Hard money
10% down · 12.0% · 12mo
- Down + closing
- —
- Monthly P&I
- —
- Monthly cashflow
- —
- DSCR
- —
- Eligible?
- —
Short-term bridge; refi at stabilization.
Rent comps 40 comps
| Address | Beds | Baths | Sqft | Rent | $/sqft | DOM | Units | Dist |
|---|---|---|---|---|---|---|---|---|
| 1610 Sycamore St Cincinnati, OH | 2.0 | 2.0 | 1600 | $1,900 | $1.19 | 10d | 1 | 0.10mi |
| 1410 Mansfield St Apt 4 Cincinnati, OH | 3.0 | 2.0 | 1412 | $2,387 | $1.69 | 10d | 1 | 0.12mi |
| 1410 Mansfield St Apt 3 Cincinnati, OH | 3.0 | 2.0 | 1412 | $2,401 | $1.70 | 10d | 1 | 0.12mi |
| 1602 Mansfield St Unit 1056028P Cincinnati, OH | 2.0 | 2.0 | 1453 | $4,145 | $2.85 | 2d | 1 | 0.13mi |
| 21 E 15th St Unit 1512946P Cincinnati, OH | 3.0 | 2.0 | 2852 | $12,830 | $4.50 | 23d | 1 | 0.15mi |
| 1354 Broadway Unit 1056136P Cincinnati, OH | 4.0 | 3.0 | 2529 | $7,307 | $2.89 | 3d | 1 | 0.17mi |
| 1326 Broadway Unit 1324946P Cincinnati, OH | 1.0–3.0 | 1.0–3.0 | 1162 | $10,683 | $9.19 | 23d | 2 | 0.19mi |
| 1304 Broadway Unit 1056130P Cincinnati, OH | 1.0–5.0 | 1.0–4.0 | 2072 | $5,808 | $2.80 | 10d | 2 | 0.22mi |
| 424 Liberty Hl Unit 1056033P Cincinnati, OH | 3.0 | 2.0 | 1453 | $5,780 | $3.98 | 2d | 1 | 0.22mi |
| 328 Mulberry St Cincinnati, OH | 3.0 | 3.5 | 2640 | $5,500 | $2.08 | 23d | 1 | 0.23mi |
| 328 Mulberry St Cincinnati, OH | 3.0 | 3.5 | 2640 | $5,500 | $2.08 | 14d | 1 | 0.23mi |
| 1537 Republic St Unit 1058850P Cincinnati, OH | 4.0 | 3.0 | 2421 | $10,677 | $4.41 | 21d | 1 | 0.27mi |
| 100 East Central Pkwy Cincinnati, OH | 1.0–2.0 | 1.0–2.0 | 1080 | $2,734 | $2.53 | 4d | 8 | 0.29mi |
| 1507 Race St Unit 1056026P Cincinnati, OH | 2.0 | 1.0 | 1453 | $3,630 | $2.50 | 14d | 1 | 0.30mi |
| 1424 Pleasant St Unit 1056038P Cincinnati, OH | 4.0 | 3.0 | 2960 | $7,167 | $2.42 | 14d | 1 | 0.32mi |
| 1508 Pleasant St Unit 1495913P Cincinnati, OH | 1.0–3.0 | 1.0–2.0 | 1431 | $8,294 | $5.80 | 2d | 2 | 0.32mi |
| 1423 Pleasant St Unit 1056037P Cincinnati, OH | 2.0 | 1.0 | 1560 | $3,411 | $2.19 | 2d | 1 | 0.34mi |
| 516 E 12th St Unit 1314562P Cincinnati, OH | 4.0 | 2.0 | 2023 | $10,170 | $5.03 | 23d | 1 | 0.34mi |
| 1610 Pleasant St Unit 1056041P Cincinnati, OH | 3.0–4.0 | 2.0–3.0 | 2960 | $4,370 | $1.48 | 10d | 2 | 0.36mi |
| 1617 Elm St Cincinnati, OH | 3.0 | 1.0–2.0 | 1028 | $4,819 | $4.69 | 2d | 44 | 0.42mi |
| 111 W Elder St Unit 1056044P Cincinnati, OH | 1.0–4.0 | 1.0–4.0 | 1835 | $5,561 | $3.03 | 10d | 2 | 0.42mi |
| 1826 Republic St Unit 1056093P Cincinnati, OH | 2.0 | 1.0 | 1614 | $2,812 | $1.74 | 14d | 1 | 0.43mi |
| 55 Mulberry St Cincinnati, OH | 3.0 | 3.0 | 2500 | $3,500 | $1.40 | 23d | 1 | 0.47mi |
| 224 E 8th St Cincinnati, OH | 1.0–2.0 | 1.0–2.0 | 1200 | $2,462 | $2.05 | 2d | 5 | 0.49mi |
| 721 Main St Cincinnati, OH | 2.0 | 1.0–2.0 | 991 | $3,205 | $3.23 | 2d | 15 | 0.50mi |
| 19 Garfield Pl Cincinnati, OH | 1.0–2.0 | 1.0–2.0 | 1680 | $2,260 | $1.34 | 2d | 11 | 0.56mi |
| 634 Sycamore St Cincinnati, OH | 2.0 | 1.0–1.5 | 1261 | $2,615 | $2.07 | 4d | 9 | 0.57mi |
| 345 E 7th St Cincinnati, OH | 2.0 | 1.0–2.0 | 1184 | $4,300 | $3.63 | 3d | 18 | 0.59mi |
| 107 E Clifton Ave Unit 1234537P Cincinnati, OH | 2.0–3.0 | 1.0–2.0 | 2260 | $6,619 | $2.93 | 14d | 2 | 0.61mi |
| 151 Seventh St W Cincinnati, OH | 2.0 | 1.0–2.0 | 1191 | $2,129 | $1.79 | 2d | 4 | 0.64mi |
| 580 Walnut St Cincinnati, OH | 2.0 | 1.0–2.5 | 1101 | $4,822 | $4.38 | 2d | 19 | 0.66mi |
| 2025 Burnet Ave Unit 2 Cincinnati, OH | 3.0 | 2.0 | 1513 | $1,795 | $1.19 | 3d | 1 | 0.66mi |
| 1287 Ida St Cincinnati, OH | 3.0 | 2.5 | 2494 | $4,700 | $1.88 | 17d | 1 | 0.70mi |
| 2105 Burnet Ave Unit 1056017P Cincinnati, OH | 4.0 | 2.0 | 2960 | $7,384 | $2.49 | 2d | 1 | 0.70mi |
| 216 Gilman Ave Unit 1363975P Cincinnati, OH | 3.0 | 1.0 | 1776 | $3,474 | $1.96 | 3d | 1 | 0.73mi |
| 923 Paradrome St Cincinnati, OH | 3.0 | 2.5 | 2098 | $3,000 | $1.43 | 23d | 1 | 0.74mi |
| 236 Gilman Ave Cincinnati, OH | 3.0 | 2.5 | 1699 | $2,200 | $1.29 | 12d | 1 | 0.74mi |
| 1055 St Paul Pl Cincinnati, OH | 3.0 | 1.0–2.0 | 975 | $2,995 | $3.07 | 2d | 10 | 0.76mi |
| 2271 Vine St Cincinnati, OH | 4.0 | 2.0 | 2268 | $1,525 | $0.67 | 4d | 1 | 0.77mi |
| 417 Vine St Cincinnati, OH | 3.0 | 2.0 | 1602 | $2,950 | $1.84 | 14d | 1 | 0.80mi |
HOA detail condo
- Monthly dues
- $254 · $3,048/yr
- Likely covers
- securityparking
- Assessments
- None detected in remarks — confirm with the listing agent.
Listing history 34 events
-
2026-06-18days on market $450,000 Active 28 DOM
-
2026-06-17days on market $450,000 Active 27 DOM
-
2026-06-16days on market $450,000 Active 26 DOM
-
2026-06-15days on market $450,000 Active 25 DOM
-
2026-06-13days on market $450,000 Active 23 DOM
-
2026-06-13days on market $450,000 Active 22 DOM
-
2026-06-09days on market $450,000 Active 19 DOM
-
2026-06-08days on market $450,000 Active 18 DOM
-
2026-06-07days on market $450,000 Active 17 DOM
-
2026-06-03days on market $450,000 Active 13 DOM
-
2026-06-02remarks 644-char remark
-
2026-06-02days on market $450,000 Active 12 DOM
-
2026-06-01days on market $450,000 Active 11 DOM
-
2026-05-31days on market $450,000 Active 10 DOM
-
2026-05-21$450,000 Active
-
2017-10-06soldstatus $290,000
-
2017-09-29soldstatus $290,000 Sold 334-char remark
Show marketing remark (334 chars)
Amazing 3 bdrm, 1.5 bath condo in the heart of OTR! 2,217 sq ft on 2 floors, with sliding glass barn doors, exposed brick, eat-in kitchen, open dining/living room, private balcony and gated courtyard. 1 parking spot at Ziegler Parking Garage included for 2017 @ $95/month. Also has on street parking. Motivated seller. Agent is owner.
-
2017-08-08historical Accept Backup Offers 334-char remark
Show marketing remark (334 chars)
Amazing 3 bdrm, 1.5 bath condo in the heart of OTR! 2,217 sq ft on 2 floors, with sliding glass barn doors, exposed brick, eat-in kitchen, open dining/living room, private balcony and gated courtyard. 1 parking spot at Ziegler Parking Garage included for 2017 @ $95/month. Also has on street parking. Motivated seller. Agent is owner.
-
2017-07-24price $299,900 334-char remark
Show marketing remark (334 chars)
Amazing 3 bdrm, 1.5 bath condo in the heart of OTR! 2,217 sq ft on 2 floors, with sliding glass barn doors, exposed brick, eat-in kitchen, open dining/living room, private balcony and gated courtyard. 1 parking spot at Ziegler Parking Garage included for 2017 @ $95/month. Also has on street parking. Motivated seller. Agent is owner.
-
2017-07-05price $310,000 334-char remark
Show marketing remark (334 chars)
Amazing 3 bdrm, 1.5 bath condo in the heart of OTR! 2,217 sq ft on 2 floors, with sliding glass barn doors, exposed brick, eat-in kitchen, open dining/living room, private balcony and gated courtyard. 1 parking spot at Ziegler Parking Garage included for 2017 @ $95/month. Also has on street parking. Motivated seller. Agent is owner.
-
2017-06-06$325,000 Active 334-char remark
Show marketing remark (334 chars)
Amazing 3 bdrm, 1.5 bath condo in the heart of OTR! 2,217 sq ft on 2 floors, with sliding glass barn doors, exposed brick, eat-in kitchen, open dining/living room, private balcony and gated courtyard. 1 parking spot at Ziegler Parking Garage included for 2017 @ $95/month. Also has on street parking. Motivated seller. Agent is owner.
-
2017-06-06historical
Show marketing remark (334 chars)
Amazing 3 bdrm, 1.5 bath condo in the heart of OTR! 2,217 sq ft on 2 floors, with sliding glass barn doors, exposed brick, eat-in kitchen, open dining/living room, private balcony and gated courtyard. 1 parking spot at Ziegler Parking Garage included for 2017 @ $95/month. Also has on street parking. Motivated seller. Agent is owner.
-
2017-05-16price $330,000
-
2017-05-16status Active
-
2017-05-15historical
-
2017-04-17price $335,000
-
2017-02-13price $345,000
-
2017-01-30price $349,000
-
2016-12-16$355,000 Active
-
2016-12-13historical
-
2016-11-23$355,000 Active
-
2016-11-23historical
-
2016-09-28price $365,000
-
2016-08-26$375,000 Active
ⓘ Source: listings_history table (triggers on properties + properties_extension) + one-shot
backfill from property_details.listing_events for pre-trigger history.
Tax reassessment forecast OH · Partial reset (capped growth)
- Current annual tax
- $8,718 · $726/mo
- Projected year-2 tax
- $8,718 · $726/mo
- Expected delta
- $0/yr ($0/mo · 0.0%)
ⓘ Screening estimate from a state-policy table — verify with the county assessor before closing.
Climate risk First Street
- Flood 7/10 Severe FEMA zone X (unshaded) · 99% chance over 30 yrs
- Wildfire 1/10 Low
- Heat 5/10 Major 7 d/yr ≥103°F today · 19 d/yr by 30 yrs out
- Wind 2/10 Low 100% chance of damaging wind over 30 yrs
- Air quality 3/10 Moderate 2 unhealthy d/yr today · 3 by 30 yrs out
Nearby sold comps map
Loading sold comps map…
Walkable amenities ~0.75 mi
Loading nearby amenities…
Taxation est. · year 1
- Rental income
- $55,105
- − Mortgage interest
- −$25,207
- − Property taxes
- −$8,718
- − Insurance
- −$3,048
- − Repairs & maintenance
- −$4,408
- − Management
- −$4,408
- − HOA
- −$3,048
- − Depreciation
- −$13,091
- Taxable loss
- −$6,823
- Est. tax savings @ 24.0%
- +$1,637
- After-tax cash flow
- $2,039/yr
For passive investors: Depreciation is non-cash, so a rental often shows a tax loss while cash-flowing — sheltering income. Rental losses are passive: they offset passive income freely, and up to $25,000/yr can offset ordinary (W-2) income if you actively participate and your MAGI is under $100k (phasing out to $0 by $150k); unused losses carry forward. On sale, claimed depreciation is recaptured at up to 25%, and gains may owe capital-gains tax (a 1031 exchange can defer both). Figures are a year-1 estimate at your 24.0% rate — not tax advice; consult a CPA.
Schools (NCES district)
- District
- Cincinnati Public Schools
- NCES district ID
- 3904375
- Math proficiency
- 25% ▼ -19.00%
- Reading proficiency
- 36% ▼ -14.00%
- Median HH income
- $35,743
- Composite
- 25.21/100
- National rank
- #7508
- State rank
- #581 of 656 in OH
Livability — Cincinnati
- Score
- 80/100
- State rank
- #130
- US rank
- #1856
Category grades
Schools grade is shown separately in the Schools card above.
Census & demographics
- Census place
- Cincinnati, OH
- County
- Hamilton County · 701,295 people
- City population
- 505,555
- Metro
- Cincinnati, OH-KY-IN
- Population (ZIP)
- 17,869
- Household income
- $95,633
- Rent vs Own
- Severe rent burden
- 1514.0
Population outlook (Hamilton County) Hauer SSP2
- Today (2025)
- 826,054 people
- By 2030
- 830,947 · +0.6%
- By 2040
- 832,319 · +0.8%
- By 2050
- 822,428 · -0.4%
- By 2075
- 788,688 · -4.5%
- By 2100
- 710,674 · -14.0%
Race, ethnicity, and origin ACS 2023
- Neighborhood character
- Majority White (64%)
- Race & ethnicity
- White 64% Black 23% Two or more races 6% Asian 4% Hispanic / Latino 2%
- Common ancestry
- Italian 2% Lithuanian 2% Romanian 2%
- Foreign-born
- 7% · Canada, China, South Korea
- Languages at home
- 91% English-only · Other Indo-European 2% Spanish 2% Other Asian/Pacific 1%
Political lean MEDSL · Hamilton
- 2024 margin
- D (+14.9) · D 57.0% · R 42.1%
- 2008→2024 swing
- +7.9pp toward D · 2008: 7.0pp · 2024: 14.9pp
- All cycles
- 2024: D+14.9 2020: D+15.9 2016: D+9.5 2012: D+4.9 2008: D+7.0
Not yet ingested
- Civics
- —
Market trends
- HPI YoY
- ▼ -219.24%
- Current HPI
- 233.4526
- Rent YoY
- ▲ 2.70%
- Metro
- Cincinnati, OH-KY-IN
- State GDP YoY
- ▲ 1.98%
- F500 in state
- 48
Industry mix (Fortune 500 HQ in OH)
| Industry | F500 HQs | Revenue |
|---|---|---|
| Insurance | 3 | $145B |
|
||
| Industrial Machinery | 3 | $49B |
|
||
| Financial Services | 3 | $24B |
|
||
| Consumer Goods | 2 | $93B |
|
||
| Aerospace / Defense | 2 | $47B |
|
||
| Utilities | 2 | $33B |
|
||
Price history
+20.0% since first listed20 events — show timeline
- 2026-05-21 Listed $450,000 Cincy MLS
- 2017-10-06 Sold (Public Records) $290,000 Public Records
- 2017-09-29 Sold (MLS) $290,000 Cincy MLS
- 2017-08-08 Contingent — Cincy MLS
- 2017-07-24 Price Changed $299,900 Cincy MLS
- 2017-07-05 Price Changed $310,000 Cincy MLS
- 2017-06-06 Listed $325,000 Cincy MLS
- 2017-06-06 Listing Removed — Cincy MLS
- 2017-05-16 Price Changed $330,000 Cincy MLS
- 2017-05-16 Relisted — Cincy MLS
- 2017-05-15 Listing Removed — Cincy MLS
- 2017-04-17 Price Changed $335,000 Cincy MLS
- 2017-02-13 Price Changed $345,000 Cincy MLS
- 2017-01-30 Price Changed $349,000 Cincy MLS
- 2016-12-16 Listed $355,000 Cincy MLS
- 2016-12-13 Listing Removed — Cincy MLS
- 2016-11-23 Listed $355,000 Cincy MLS
- 2016-11-23 Listing Removed — Cincy MLS
- 2016-09-28 Price Changed $365,000 Cincy MLS
- 2016-08-26 Listed $375,000 Cincy MLS
Property tax history
+12.8%/yrLatest (2025): $8,718 · +3.2% YoY. Source: county tax records.
Cash-flow waterfall
monthlySold comps — $/sqft
last 12 mo · ≤1 miLoading sold comps…