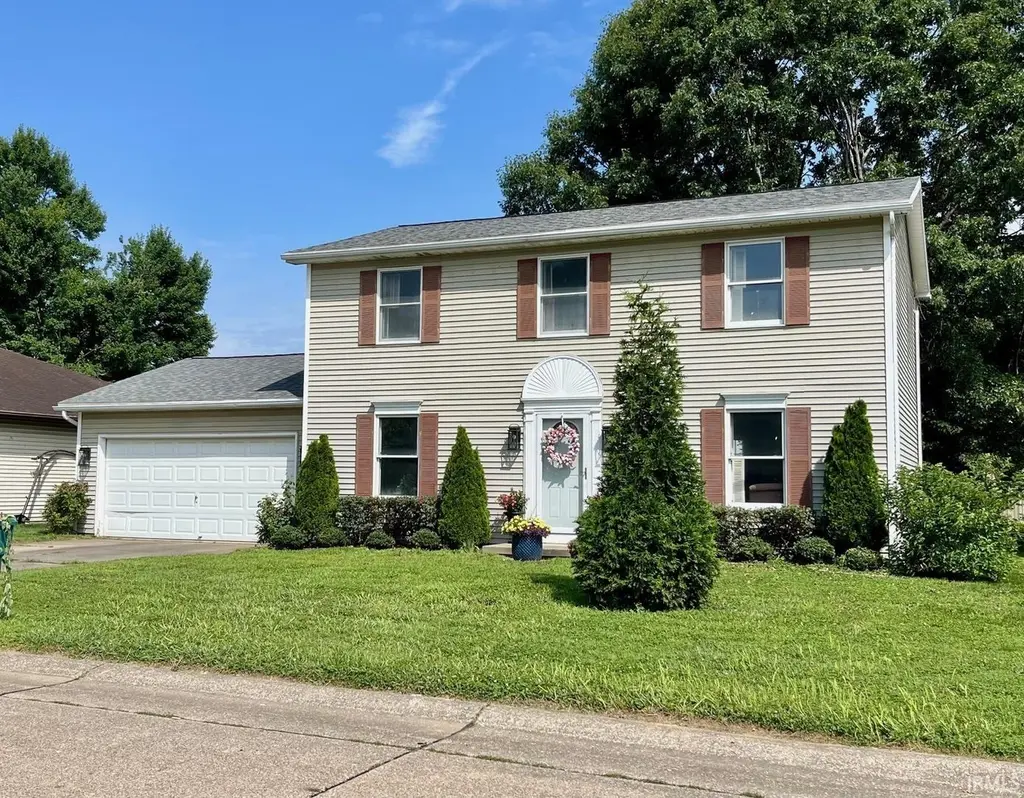
6940 Kolb Dr · Evansville, IN
Flood risk 3/10 · Minor
- FEMA flood zone
- X (unshaded)
- Chance of flooding over 30 yrs
- 0.2%
- Est. flood insurance / yr
- $507 – $1,088
Fire risk 1/10 · Minimal
- Est. fire insurance / yr
- $717 – $1,331
Heat risk 6/10 · Moderate
- Hot days now (above 106°F)
- 7 days/yr
- Hot days in 30 yrs
- 19 days/yr
Wind risk 2/10 · Minimal
- Chance of severe wind over 30 yrs
- 4.0%
Air-quality risk 3/10 · Minor
- Unhealthy air days now
- 3 days/yr
- Unhealthy air days in 30 yrs
- 4 days/yr
Risk factors via First Street. Map © Google.
Why this score? — see what drove the D- grade
The composite is a weighted blend of 9 inputs, each scored 0–100. Each bar is that input's sub-score; the figure is the points it added to the 100-point composite (weight × sub-score).
- Cash flow +12.6/30.0
- ARV discount +7.9/15.0
- DSCR +3.8/10.0
- Schools +3.3/10.0
- Livability +3.2/5.0
- Rent growth +2.5/5.0
- Condition / age +2.5/5.0
- 1% rule +2.3/10.0
- Appreciation +0.0/10.0
$250,000
🖨 Deal sheet 📄 Offer letter ✓ Due diligence
Listing remarks
Two-Story in Audubon Estates with 1856sqft, 4 bedrooms, 2.5 baths, living room, eat-in kitchen, dining room, 2 car garage. Main Level includes hardwood flooring, spacious living room, formal dining room, kitchen with breakfast bar, pantry, built-in desk, appliances stay, laundry and half bath just off the kitchen; plus kitchen dining area with access door to back patio and backyard view of mature trees. Upstairs offers an Owner’s Suite with 2 closets and full bath, plus 3 other bedrooms, and a hallway bath. Roof is 10 years old. Close to shopping and restaurants!
Key facts
- Hardwood flooring
- Eat-in kitchen
- Private view
Tags
Property features AI
Exterior
- Parking: Attached concrete garage with 2 spaces
- Utilities: Public water; Public sewer
- Home design: Single family residence (site-built); 2 stories
- Construction: Vinyl siding; Built above grade (finished area reported); Crawl space foundation
- Exterior features: Patio; Level lot; Lot dimensions 75 x 132; Lot size approximately 0.23 acres
Interior
- Kitchen: Dishwasher; Microwave; Refrigerator; Electric oven; Eat-in kitchen; Breakfast bar
- Bedrooms: 8 total rooms (bedroom count not specified)
- Flooring: Hardwood; Carpet; Vinyl
- Bathrooms: 2 full bathrooms; 1 half bathroom; 1 bathroom on the main level
- Heating & cooling: Natural gas heating; Forced air heating; Central air; Ceiling fan(s)
- Interior features: Walk-in closet(s); Entrance foyer; Breakfast bar; Ceiling fan(s); Eat-in kitchen; Crawl space basement
- Laundry & utility: Laundry on main level
Neighborhood map
What this means for you Summary
Snapshot
- This is a 3-bed/1.0-bath single-family listed at $250k.
Deal economics
- At list price, monthly cash flow is $-30 ($-365/yr) — negative.
- To cash-flow at today's rent, offer at most $245k (2.1% below list).
- To meet the 1% rule (rent ≥ 1% of price), the offer needs to be $184k (26.5% below list).
- Recommended offer: $184k (26.5% below list) — sets the bar for 1% rule.
- Cap rate 6.1% vs local median 4.6% in Evansville — top-decile yield for the area; either an underpriced asset or a hidden risk that comps aren't pricing in. Stress-test before assuming the spread holds.
Location & tenants
- Location reads 63/100 on livability (#416 in IN) — a middle-class / working-renter tenant base. Strengths: cost of living A+, housing A+, health & safety A+; Watch: crime F, commute F, employment D-.
- Evansville Vanderburgh School Corporation (urban): math 36% / reading 43% proficiency, ranked #153 of 301 in IN (top 51%) — families likely to look elsewhere, expect single-tenant / working-renter base with shorter leases.
- Zoned schools: Caze Elementary School (math 17% / reading 17%, grade F, #837 of 994 statewide, top 86%, 393 students, 79% FRL); Mcgary Middle School (math 8% / reading 15%, grade F, #311 of 330 statewide, top 94%, 351 students, 81% FRL); William Henry Harrison High School (math 29% / reading 54%, grade F, #211 of 369 statewide, top 58%, 1,158 students, 61% FRL) — zoned schools average 73% FRL vs 50% district-wide (23 pts higher); higher-poverty schools than district average — tighter screening recommended.
- Zoned-school proficiency averages 23% at this address vs 40% district-wide (-16 pts) — the specific schools serving this property underperform the Evansville Vanderburgh School Corporation average; the district grade overstates school quality for this exact location.
- Market conditions: 177 active listings in the ZIP; 5 comparable units currently listed for rent nearby; rentals at typical pace (median 21d on market — plan ~3-4 weeks tenant-placement turnaround); 40% of comp listings sitting > 30 days — soft ceiling on asking rent; 508 units permitted in Vanderburgh County in 2024 (32 in 5+ unit buildings).
- This rent runs 36% of the median local income ($61k/yr) — at the standard rent-burdened threshold; future hikes will face affordability resistance.
Forward outlook
- Local home prices are declining (-3.0%/yr); year-one equity from $2k of loan paydown is wiped out by about $8k of value loss. Plan a longer hold.
Negotiation context
- Only 8 days on market — expect competitive offers; lowballing is unlikely to land.
Risks & watch-outs
- Climate carrying-cost: extreme-heat days projected 7→19/yr by 2055 (HVAC capex compounding) — expect insurance premiums to compound above CPI over the hold.
Questions for the listing agent
- What do current leases actually rent for vs. the listed asking? Can we see a recent rent roll and the last 12 months of T-12 income?
- Is there a deadline driving the sale (1031 exchange, divorce, estate, relocation)? That informs how much negotiation room exists.
- Schools are D-rated, which usually means shorter tenancies and higher turnover. Who's the typical renter profile here, and what's been the actual vacancy rate?
- Crime grade is F in this area — have there been break-ins, vandalism, or insurance claims at this property in the last 3 years? What carrier currently insures it and at what premium?
- The area grade is low — what's the realistic commute time and amenity access for the typical tenant pool here? Any planned neighborhood developments (good or bad) we should know about?
- What's the average days-on-market for RENTAL listings here right now (not sales)? A rising rental-DOM trend means longer vacancies and softer asking-rent achievability than the comps imply.
- What's the recent tenant-quality profile in this submarket — average credit score on applications, eviction rate, late-payment / NSF rate, and stable-employment percentage? A property-management company in the area should have these aggregated.
- How much new for-sale + rental construction is in the pipeline within 1–3 miles? Heavy new supply typically softens prices + rents 12–24 months out; constrained supply supports both.
Investment metrics
- 1% rule
- 0.73% ✗
- Cap rate
- 6.15%
- Cash-on-cash
- -0.52%
- DSCR
- 0.98
- GRM
- 11.3
CMA / ARV
- ARV (on-the-fly)
- $252,416
- Comps found
- 12
Show comp detail 12 sales within ~0.75 mi
| Address | Dist | Beds/Ba | Sqft | Sold | Price | $/sf | Match |
|---|---|---|---|---|---|---|---|
| 6927 Kolb Dr | 0.03mi | 3/2.0 | 1,755 (-5%) | 3mo | $195,000 | $111 | 83 |
| 1511 Oriole Dr | 0.36mi | 3/2.5 | 1,897 (+2%) | 1mo | $235,000 | $124 | 73 |
| 1908 Chickasaw Dr | 0.26mi | 3/2.0 | 1,998 (+8%) | 1mo | $245,000 | $123 | 70 |
| 1551 Greenfield Rd | 0.25mi | 3/2.5 | 1,986 (+7%) | 0mo | $295,000 | $149 | 70 |
| 6607 Kolb Rd | 0.23mi | 4/2.0 (+1) | 1,912 (+3%) | 7mo | $270,500 | $141 | 69 |
| 6921 Monroe Ave | 0.40mi | 3/1.5 | 1,955 (+5%) | 3mo | $242,000 | $124 | 68 |
| 7418 Julius Ct | 0.42mi | 3/2.0 | 1,779 (-4%) | 7mo | $295,000 | $166 | 64 |
| 1452 Bonnie View Dr | 0.38mi | 2/1.0 (-1) | 1,700 (-8%) | 1mo | $204,799 | $120 | 62 |
| 1719 Seasons Ridge Blvd | 0.51mi | 3/2.0 | 1,756 (-5%) | 3mo | $238,000 | $136 | 61 |
| 7508 Julius Ct | 0.45mi | 3/2.5 | 1,990 (+7%) | 5mo | $314,900 | $158 | 57 |
| 1200 S Burkhardt Rd | 0.55mi | 3/1.5 | 1,607 (-13%) | 3mo | $265,000 | $165 | 47 |
| 1020 Martin Ln | 0.70mi | 4/2.0 (+1) | 2,107 (+14%) | 1mo | $209,900 | $100 | 35 |
Match score weights: distance 35% · size 25% · config 20% · recency 20%. Top-matched comps best support the ARV.
Projected returns pro-forma
-3.0% appreciation · 3.0% rent growth · sell at horizon
- IRR
- -17.2%
- Equity multiple
- 0.39×
- Total profit
- $-42,572
- Equity at exit
- $37,276
- IRR
- -9.3%
- Equity multiple
- 0.43×
- Total profit
- $-40,069
- Equity at exit
- $21,615
Cash invested: $70,000 (down + closing). Projections, not guarantees.
Landlord ↔ Tenant lean methodology
- Overall (STATE)
- 90 Strongly Landlord-Friendly
- State Indiana
- 90 Strongly Landlord-Friendly · R+11
- County
- — inherits STATE
- City
- — inherits STATE
ZIP-level market 47715
- Active inventory
- 177
- Price-to-rent
- 11.3×
Monthly cashflow live
- Estimated rent
- $1,837 high interval (Pro) →
- Mortgage (P&I)
- −$1,311
- Tax from tax record
- −$66 /mo · $794/yr
- Insurance
- −$104
- HOA
- −$0
- Vacancy / Maint / Mgmt
- −$386
- Net cashflow
- $-30
Break-even live
UW: 25.0% down · 7.5% · 30yr · 1.5% tax · 5.0% vac · 8.0% maint · 8.0% mgmt
Financing live
Cash to close
- Down payment
- $62,500
- Closing costs
- $7,500
- Reserves months
- —
- Total cash needed
- —
Loan-product check · same deal, 3 products live
Conventional
25% down · 7.5% · 30yr
- Down + closing
- —
- Monthly P&I
- —
- Monthly cashflow
- —
- DSCR
- —
- Eligible?
- —
Personal DTI + credit; lowest rate.
DSCR
20% down · 8.5% · 30yr
- Down + closing
- —
- Monthly P&I
- —
- Monthly cashflow
- —
- DSCR
- —
- Eligible?
- —
No personal income docs; deal must DSCR.
Hard money
10% down · 12.0% · 12mo
- Down + closing
- —
- Monthly P&I
- —
- Monthly cashflow
- —
- DSCR
- —
- Eligible?
- —
Short-term bridge; refi at stabilization.
Rent comps 5 comps
| Address | Beds | Baths | Sqft | Rent | $/sqft | DOM | Units | Dist |
|---|---|---|---|---|---|---|---|---|
| 1701 Southfield Rd Evansville, IN | 3.0 | 2.5 | 1696 | $1,900 | $1.12 | 21d | 1 | 0.12mi |
| 1100 Erie Ave Evansville, IN | 1.0–3.0 | 1.0–2.0 | 962 | $1,500 | $1.56 | 21d | 2 | 1.21mi |
| 4920 Penrose Dr Newburgh, IN | 3.0 | 2.0 | 1250 | $1,900 | $1.52 | 43d | 1 | 1.40mi |
| 815 Erie Ave Evansville, IN | 1.0–2.0 | 1.0–2.5 | 1038 | $1,349 | $1.30 | 13d | 17 | 1.42mi |
| 4799 Imperial Dr Newburgh, IN | 3.0 | 2.0 | 1370 | $1,975 | $1.44 | 43d | 1 | 1.48mi |
Listing history 7 events
-
2026-06-18days on market $250,000 Active 8 DOM
-
2026-06-17days on market $250,000 Active 7 DOM
-
2026-06-16days on market $250,000 Active 6 DOM
-
2026-06-15days on market $250,000 Active 5 DOM
-
2026-06-14days on market $250,000 Active 3 DOM
-
2026-06-13remarks 569-char remark
-
2026-06-13$250,000 Active 2 DOM
ⓘ Source: listings_history table (triggers on properties + properties_extension) + one-shot
backfill from property_details.listing_events for pre-trigger history.
Tax reassessment forecast IN · Partial reset (capped growth)
- Current annual tax
- $794 · $66/mo
- Projected year-2 tax
- $1,460 · $122/mo
- Expected delta
- +$665/yr (+$55/mo · 83.8%)
ⓘ Screening estimate from a state-policy table — verify with the county assessor before closing.
Climate risk First Street
- Flood 3/10 Moderate FEMA zone X (unshaded) · 20% chance over 30 yrs
- Wildfire 1/10 Low
- Heat 6/10 Major 7 d/yr ≥106°F today · 19 d/yr by 30 yrs out
- Wind 2/10 Low 4% chance of damaging wind over 30 yrs
- Air quality 3/10 Moderate 3 unhealthy d/yr today · 4 by 30 yrs out
Nearby sold comps map
Loading sold comps map…
Walkable amenities ~0.75 mi
Loading nearby amenities…
Taxation est. · year 1
- Rental income
- $22,040
- − Mortgage interest
- −$14,004
- − Property taxes
- −$794
- − Insurance
- −$1,250
- − Repairs & maintenance
- −$1,763
- − Management
- −$1,763
- − Depreciation
- −$7,273
- Taxable loss
- −$4,807
- Est. tax savings @ 24.0%
- +$1,154
- After-tax cash flow
- $789/yr
For passive investors: Depreciation is non-cash, so a rental often shows a tax loss while cash-flowing — sheltering income. Rental losses are passive: they offset passive income freely, and up to $25,000/yr can offset ordinary (W-2) income if you actively participate and your MAGI is under $100k (phasing out to $0 by $150k); unused losses carry forward. On sale, claimed depreciation is recaptured at up to 25%, and gains may owe capital-gains tax (a 1031 exchange can defer both). Figures are a year-1 estimate at your 24.0% rate — not tax advice; consult a CPA.
Schools (NCES district)
- District
- Evansville Vanderburgh School Corporation
- NCES district ID
- 1803450
- Math proficiency
- 36% ▼ -7.00%
- Reading proficiency
- 43% ▼ -3.00%
- Median HH income
- $43,270
- Composite
- 33.41/100
- National rank
- #5471
- State rank
- #153 of 301 in IN
Livability — Evansville
- Score
- 63/100
- State rank
- #416
- US rank
- #15047
Category grades
Schools grade is shown separately in the Schools card above.
Census & demographics
- County
- Vanderburgh County · 146,793 people
- City population
- 146,793
- Metro
- Evansville, IN-KY
- Population (ZIP)
- 29,280
- Household income
- $60,897
- Rent vs Own
- Severe rent burden
- 1652.0
Population outlook (Vanderburgh County) Hauer SSP2
- Today (2025)
- 187,038 people
- By 2030
- 188,907 · +1.0%
- By 2040
- 190,272 · +1.7%
- By 2050
- 188,871 · +1.0%
- By 2075
- 180,751 · -3.4%
- By 2100
- 163,015 · -12.8%
Race, ethnicity, and origin ACS 2023
- Neighborhood character
- Predominantly White (74%)
- Race & ethnicity
- White 74% Black 13% Hispanic / Latino 6% Two or more races 4% Asian 2% Native American 1%
- Hispanic origin (detail)
- Mexican 5%
- Common ancestry
- Slovak 3% Romanian 2% Italian 2%
- Foreign-born
- 6% · Canada, China
- Languages at home
- 93% English-only · Spanish 4% Chinese 1%
Political lean MEDSL · Vanderburgh
- 2024 margin
- R (+12.7) · D 43.0% · R 55.6% · Other 1.4%
- 2008→2024 swing
- -15.1pp toward R · 2008: 2.5pp · 2024: -12.7pp
- All cycles
- 2024: R+12.7 2020: R+9.6 2016: R+16.9 2012: R+10.8 2008: D+2.5
Not yet ingested
- Civics
- —
Market trends
- HPI YoY
- ▼ -113.01%
- Current HPI
- 195.7299
- Rent YoY
- —
- Metro
- Evansville, IN-KY
- State GDP YoY
- ▲ 2.90%
- F500 in state
- 18
Industry mix (Fortune 500 HQ in IN)
| Industry | F500 HQs | Revenue |
|---|---|---|
| Industrial Machinery | 2 | $37B |
|
||
| Healthcare | 1 | $177B |
|
||
| Pharmaceuticals | 1 | $45B |
|
||
| Metals / Steel | 1 | $18B |
|
||
| Agriculture | 1 | $17B |
|
||
| Packaging | 1 | $12B |
|
||
Price history
1 event — show timeline
- 2026-06-10 Listed $250,000 IRMLS
Property tax history
-2.2%/yrLatest (2024): $794 · +2.0% YoY. Source: county tax records.
Cash-flow waterfall
monthlySold comps — $/sqft
last 12 mo · ≤1 miLoading sold comps…