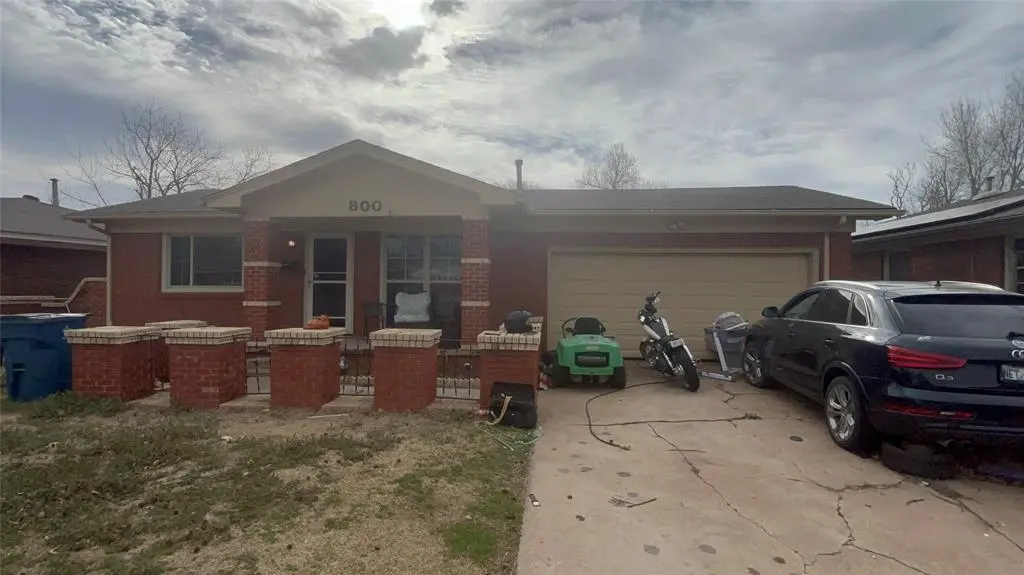
800 E Towry Dr · Midwest City, OK
Flood risk 3/10 · Minor
- FEMA flood zone
- X (unshaded)
- Chance of flooding over 30 yrs
- 0.2%
- Est. flood insurance / yr
- $507 – $1,088
Fire risk 1/10 · Minimal
- Est. fire insurance / yr
- $2,463 – $4,575
Heat risk 6/10 · Moderate
- Hot days now (above 107°F)
- 7 days/yr
- Hot days in 30 yrs
- 19 days/yr
Wind risk 2/10 · Minimal
- Chance of severe wind over 30 yrs
- 4.0%
Air-quality risk 2/10 · Minimal
- Unhealthy air days now
- 1 days/yr
- Unhealthy air days in 30 yrs
- 2 days/yr
Risk factors via First Street. Map © Google.
Why this score? — see what drove the B- grade
The composite is a weighted blend of 9 inputs, each scored 0–100. Each bar is that input's sub-score; the figure is the points it added to the 100-point composite (weight × sub-score).
- Cash flow +26.2/30.0
- ARV discount +15.0/15.0
- DSCR +8.8/10.0
- 1% rule +7.6/10.0
- Livability +3.6/5.0
- Rent growth +3.2/5.0
- Condition / age +2.5/5.0
- Schools +1.2/10.0
- Appreciation +0.0/10.0
$100,000
🖨 Deal sheet 📄 Offer letter ✓ Due diligence
Listing remarks MLS
Check out this cute and cozy move-in ready home, right in the heart of Midwest City! Inside you'll find original hardwood floors, updated main bath, large bedrooms, energy efficient windows and lots of storage. The kitchen and half-bath boast a clean and classic vintage look. Outside, enjoy the large covered back patio, huge backyard, creek/greenbelt area, newly-planted Magnolia tree and a sprinkler system. Flower beds and designated garden area could be a gardener's dream. Close to I-40, Tinker AFB and loads of restaurants and shopping!
Key facts
- Generous yard
- Ample cabinet space
- 9,919 sq ft lot
Tags
Property features AI
Finance
- Other: Short sale requires lender approval; Occupied: No
- Financial info: Loan qualification available; Assumable loan: No; Current list price: $100,000; Tax amount reported
- HOA & community: No mandatory association dues
Exterior
- Parking: 2-car garage
- Utilities: No flood insurance required
- Home design: Single family residence; One story; Residential property; Entry level: One
- Construction: Brick construction; Composition roof; Slab foundation; Built status: Existing; Homestead applied
- Exterior features: Interior lot
Interior
- Bedrooms: 3 bedrooms
- Bathrooms: 1 full bathroom; 1 half bathroom
- Interior features: One living area; Porch
Neighborhood map
What this means for you Summary
Snapshot
- This is a 3-bed/2.0-bath single-family listed at $100k.
Deal economics
- At list price, monthly cash flow is $254 ($3k/yr) — positive.
- The deal already cash-flows at list — no discount required.
- Meets the 1% rule at list price ($1k rent vs $100k).
- Cap rate 9.3% vs local median 5.6% in Midwest City — top-decile yield for the area; either an underpriced asset or a hidden risk that comps aren't pricing in. Stress-test before assuming the spread holds.
Location & tenants
- Location reads 71/100 on livability (#30 in OK) — a middle-class / working-renter tenant base. Strengths: cost of living A+, housing A+, health & safety A; Watch: crime D+, employment D, amenities F.
- Midwest City-Del City (suburban): math 10% / reading 17% proficiency, ranked #231 of 270 in OK (top 86%) — low school quality limits family demand, transient renter base, plan for 1-2y turnover.
- Zoned schools: Midwest City Es (math 13% / reading 13%, grade F, #647 of 845 statewide, top 77%, 793 students, 0% FRL); Midwest City Hs (math 7% / reading 17%, grade F, #359 of 447 statewide, top 80%, 1,368 students, 0% FRL) — zoned schools average 0% FRL vs 57% district-wide (57 pts lower); this property's tenant base skews higher-income than the district average.
- Market conditions: Rents rising (+3.0%/yr); 171 active listings in the ZIP; 40 comparable units currently listed for rent nearby; rentals leasing fast (median 5d on market — plan ~1-2 weeks tenant-placement turnaround); 5,365 units permitted in Oklahoma County in 2024 (569 in 5+ unit buildings).
Forward outlook
- Local home prices are declining (-3.0%/yr); year-one equity from $691 of loan paydown is wiped out by about $3k of value loss. Plan a longer hold.
- Oklahoma County population projected at +41% by 2050 — long-run rental-demand tailwind backs the buy-and-hold thesis.
- At projected returns (-3.0% appreciation + 3.0% rent growth), your $28k cash investment doubles in ~10 years — after that, you're playing with house money.
Negotiation context
- Only 8 days on market — expect competitive offers; lowballing is unlikely to land.
- 5 sale attempts since 25y ago with the ask held roughly flat each time — persistent listings suggest the price (not the market) is what's stuck; bring a comps-based counter.
Risks & watch-outs
- Watch-outs: built in 1955 — expect roof / HVAC / electrical / plumbing capex.
- Climate carrying-cost: extreme-heat days projected 7→19/yr by 2055 (HVAC capex compounding) — expect insurance premiums to compound above CPI over the hold.
Questions for the listing agent
- Built in 1955 — when were the roof, HVAC, electrical panel, plumbing, and water heater last replaced?
- Is there a deadline driving the sale (1031 exchange, divorce, estate, relocation)? That informs how much negotiation room exists.
- Schools are D-rated, which usually means shorter tenancies and higher turnover. Who's the typical renter profile here, and what's been the actual vacancy rate?
- Crime grade is D in this area — have there been break-ins, vandalism, or insurance claims at this property in the last 3 years? What carrier currently insures it and at what premium?
- What's the average days-on-market for RENTAL listings here right now (not sales)? A rising rental-DOM trend means longer vacancies and softer asking-rent achievability than the comps imply.
- What's the recent tenant-quality profile in this submarket — average credit score on applications, eviction rate, late-payment / NSF rate, and stable-employment percentage? A property-management company in the area should have these aggregated.
- How much new for-sale + rental construction is in the pipeline within 1–3 miles? Heavy new supply typically softens prices + rents 12–24 months out; constrained supply supports both.
Investment metrics
- 1% rule
- 1.26% ✓
- Cap rate
- 9.34%
- Cash-on-cash
- 10.87%
- DSCR
- 1.48
- GRM
- 6.6
CMA / ARV
- ARV (on-the-fly)
- $137,214
- Comps found
- 12
Show comp detail 12 sales within ~0.75 mi
| Address | Dist | Beds/Ba | Sqft | Sold | Price | $/sf | Match |
|---|---|---|---|---|---|---|---|
| 721 Hedge Dr | 0.18mi | 3/1.5 | 1,215 (+7%) | 0mo | $147,000 | $121 | 78 |
| 705 Stahl Dr | 0.18mi | 3/1.0 | 1,067 (-6%) | 1mo | $121,500 | $114 | 76 |
| 317 E Key Blvd | 0.40mi | 3/1.0 | 1,107 (-2%) | 5mo | $90,000 | $81 | 70 |
| 809 General Senter Dr | 0.06mi | 4/2.0 (+1) | 1,275 (+12%) | 3mo | $150,000 | $118 | 69 |
| 413 Russell Dr | 0.57mi | 3/2.0 | 1,144 (+1%) | 5mo | $164,900 | $144 | 68 |
| 732 E Rose Dr | 0.41mi | 3/1.0 | 1,077 (-5%) | 2mo | $130,000 | $121 | 67 |
| 837 S Stahl Dr | 0.11mi | 3/1.0 | 975 (-14%) | 1mo | $141,000 | $145 | 67 |
| 2600 N Towry Dr | 0.40mi | 3/1.5 | 1,029 (-9%) | 2mo | $165,000 | $160 | 62 |
| 201 E Key Blvd | 0.63mi | 3/2.0 | 1,167 (+3%) | 6mo | $180,000 | $154 | 61 |
| 2420 N Key Blvd | 0.70mi | 3/1.0 | 1,136 (+0%) | 4mo | $154,000 | $136 | 60 |
| 2600 Murray Dr | 0.60mi | 3/1.0 | 1,200 (+6%) | 6mo | $74,500 | $62 | 53 |
| 404 E Jarman Dr | 0.42mi | 2/1.0 (-1) | 972 (-14%) | 6mo | $60,000 | $62 | 43 |
Match score weights: distance 35% · size 25% · config 20% · recency 20%. Top-matched comps best support the ARV.
Projected returns pro-forma
-3.0% appreciation · 2.99% rent growth · sell at horizon
- IRR
- -0.0%
- Equity multiple
- 1.00×
- Total profit
- $-15
- Equity at exit
- $14,910
- IRR
- 9.7%
- Equity multiple
- 1.75×
- Total profit
- $20,932
- Equity at exit
- $8,646
Cash invested: $28,000 (down + closing). Projections, not guarantees.
Landlord ↔ Tenant lean methodology
- Overall (STATE)
- 83 Strongly Landlord-Friendly
- State Oklahoma
- 83 Strongly Landlord-Friendly · R+20
- County
- — inherits STATE
- City
- — inherits STATE
ZIP-level market 73110
- Rents YoY
- 3.0%
- Active inventory
- 171
- Price-to-rent
- 6.6×
Monthly cashflow live
- Estimated rent
- $1,256 high interval (Pro) →
- Mortgage (P&I)
- −$524
- Tax from tax record
- −$173 /mo · $2,072/yr
- Insurance
- −$42
- HOA
- −$0
- Vacancy / Maint / Mgmt
- −$264
- Net cashflow
- $254
Break-even live
UW: 25.0% down · 7.5% · 30yr · 1.5% tax · 5.0% vac · 8.0% maint · 8.0% mgmt
Financing live
Cash to close
- Down payment
- $25,000
- Closing costs
- $3,000
- Reserves months
- —
- Total cash needed
- —
Loan-product check · same deal, 3 products live
Conventional
25% down · 7.5% · 30yr
- Down + closing
- —
- Monthly P&I
- —
- Monthly cashflow
- —
- DSCR
- —
- Eligible?
- —
Personal DTI + credit; lowest rate.
DSCR
20% down · 8.5% · 30yr
- Down + closing
- —
- Monthly P&I
- —
- Monthly cashflow
- —
- DSCR
- —
- Eligible?
- —
No personal income docs; deal must DSCR.
Hard money
10% down · 12.0% · 12mo
- Down + closing
- —
- Monthly P&I
- —
- Monthly cashflow
- —
- DSCR
- —
- Eligible?
- —
Short-term bridge; refi at stabilization.
Rent comps 40 comps
| Address | Beds | Baths | Sqft | Rent | $/sqft | DOM | Units | Dist |
|---|---|---|---|---|---|---|---|---|
| 641 E Frolich Dr Oklahoma City, OK | 3.0 | 1.5 | 1032 | $975 | $0.94 | 23d | 1 | 0.13mi |
| 864 E Steed Dr Oklahoma City, OK | 3.0 | 1.0 | 1200 | $1,200 | $1.00 | 2d | 1 | 0.22mi |
| 721 E Bouse Dr Oklahoma City, OK | 3.0 | 1.0 | 1002 | $1,225 | $1.22 | 2d | 1 | 0.27mi |
| 407 E Key Blvd Oklahoma City, OK | 4.0 | 2.0 | 1200 | $1,395 | $1.16 | 23d | 1 | 0.33mi |
| 609 E Steed Dr Oklahoma City, OK | 2.0 | 1.0 | 811 | $1,800 | $2.22 | 23d | 1 | 0.33mi |
| 764 E Rose Dr Oklahoma City, OK | 3.0 | 1.0 | 920 | $1,025 | $1.11 | 2d | 1 | 0.34mi |
| 322 E Kerr Dr Oklahoma City, OK | 3.0 | 1.0 | 1086 | $1,200 | $1.10 | 23d | 1 | 0.34mi |
| 8032 E Reno Ave Oklahoma City, OK | 1.0–2.0 | 1.0 | 770 | $850 | $1.10 | 2d | 3 | 0.35mi |
| 221 E Kerr Dr Oklahoma City, OK | 3.0 | 1.5 | 1339 | $1,145 | $0.86 | 4d | 1 | 0.55mi |
| 8517 E Reno Ave Oklahoma City, OK | 1.0–2.0 | 1.0–2.0 | 837 | $859 | $1.03 | 4d | 1 | 0.64mi |
| 1109 Parkview Dr Oklahoma City, OK | 3.0 | 2.0 | 1290 | $1,300 | $1.01 | 23d | 1 | 0.66mi |
| 121 Gill Dr Oklahoma City, OK | 3.0 | 1.0 | 950 | $1,150 | $1.21 | 2d | 1 | 0.70mi |
| 119 Woodman Dr Oklahoma City, OK | 3.0 | 2.0 | 1252 | $1,400 | $1.12 | 2d | 1 | 0.71mi |
| 312 Bolton Pl Oklahoma City, OK | 3.0 | 1.5 | 756 | $1,099 | $1.45 | 23d | 1 | 0.71mi |
| 327 N Midwest Blvd Unit 205 Midwest City, OK | 2.0 | 1.0 | 920 | $900 | $0.98 | 23d | 1 | 0.72mi |
| 8717 Saint George Way Oklahoma City, OK | 2.0 | 2.0 | 1075 | $1,150 | $1.07 | 23d | 1 | 0.78mi |
| 2105 Maple Dr Midwest City, OK | 3.0 | 2.0 | 1032 | $1,295 | $1.25 | 23d | 1 | 0.80mi |
| 536 E Northrup Dr Oklahoma City, OK | 2.0 | 1.0 | 858 | $889 | $1.04 | 2d | 1 | 0.81mi |
| 8801 Saint George Way Oklahoma City, OK | 3.0 | 2.0 | 1122 | $1,175 | $1.05 | 23d | 1 | 0.87mi |
| 8801 Saint George Way Oklahoma City, OK | 3.0 | 2.0 | 1122 | $1,175 | $1.05 | 10d | 1 | 0.87mi |
| 422 E Northrup Dr Oklahoma City, OK | 3.0 | 1.0 | 819 | $1,395 | $1.70 | 2d | 1 | 0.87mi |
| 413 E Northrup Dr Oklahoma City, OK | 3.0 | 1.0 | 800 | $1,395 | $1.74 | 2d | 1 | 0.87mi |
| 204 Elm St Oklahoma City, OK | 3.0 | 2.0 | 1098 | $1,250 | $1.14 | 23d | 1 | 0.88mi |
| 1436 Maple Dr Oklahoma City, OK | 4.0 | 2.0 | 1409 | $1,350 | $0.96 | 16d | 1 | 0.90mi |
| 236 Spirit Dr Midwest City, OK | 3.0 | 2.0 | 1350 | $1,600 | $1.19 | 2d | 1 | 0.91mi |
| 616 Lions Park Pl Oklahoma City, OK | 2.0 | 1.0 | 906 | $950 | $1.05 | 2d | 1 | 0.99mi |
| 3409 Willow Creek Dr Oklahoma City, OK | 3.0 | 1.0 | 932 | $1,050 | $1.13 | 23d | 1 | 1.01mi |
| 442 Babb Dr Oklahoma City, OK | 2.0 | 2.0 | 920 | $925 | $1.01 | 4d | 1 | 1.02mi |
| 7122 SE 15th St Oklahoma City, OK | 2.0 | 1.0 | 816 | $1,100 | $1.35 | 4d | 1 | 1.02mi |
| 3413 Willow Creek Dr Oklahoma City, OK | 3.0 | 1.0 | 872 | $975 | $1.12 | 2d | 1 | 1.02mi |
| 444 1/2 Babb Dr Oklahoma City, OK | 2.0 | 1.0 | 920 | $895 | $0.97 | 4d | 1 | 1.03mi |
| 124 E Northrup Dr Oklahoma City, OK | 4.0 | 1.0 | 1085 | $1,400 | $1.29 | 23d | 1 | 1.03mi |
| 120 E Northrup Dr Oklahoma City, OK | 4.0 | 2.0 | 1364 | $1,475 | $1.08 | 23d | 1 | 1.04mi |
| 1040 Sycamore Dr Oklahoma City, OK | 4.0 | 1.0 | 1144 | $1,595 | $1.39 | 1d | 1 | 1.07mi |
| 110 E Myrtle Dr Oklahoma City, OK | 3.0 | 1.5 | 1236 | $1,300 | $1.05 | 11d | 1 | 1.08mi |
| 677 Midtown Pl Midwest City, OK | 1.0–2.0 | 1.0–2.0 | 770 | $1,450 | $1.88 | 1d | 1 | 1.09mi |
| 3512 Brookside Dr Oklahoma City, OK | 4.0 | 2.0 | 763 | $1,595 | $2.09 | 1d | 1 | 1.10mi |
| 3512 N Holman Ct Oklahoma City, OK | 3.0 | 2.0 | 1092 | $1,275 | $1.17 | 2d | 1 | 1.11mi |
| 3513 Parkwoods Ln Oklahoma City, OK | 3.0 | 1.5 | 903 | $1,150 | $1.27 | 44d | 1 | 1.11mi |
| 538 E Indian Dr Oklahoma City, OK | 2.0 | 1.0 | 739 | $920 | $1.24 | 21d | 1 | 1.13mi |
Listing history 15 events
-
2026-04-17status Pending
-
2026-04-09$100,000 Active
-
2025-10-08historical
-
2025-08-17status Active
-
2025-04-27status Pending
-
2025-04-09$169,900 Active
-
2023-01-30soldstatus $143,000
-
2023-01-27soldstatus $143,000 Closed 543-char remark
Show marketing remark (543 chars)
Check out this cute and cozy move-in ready home, right in the heart of Midwest City! Inside you'll find original hardwood floors, updated main bath, large bedrooms, energy efficient windows and lots of storage. The kitchen and half-bath boast a clean and classic vintage look. Outside, enjoy the large covered back patio, huge backyard, creek/greenbelt area, newly-planted Magnolia tree and a sprinkler system. Flower beds and designated garden area could be a gardener's dream. Close to I-40, Tinker AFB and loads of restaurants and shopping!
-
2023-01-02status Pending 543-char remark
Show marketing remark (543 chars)
Check out this cute and cozy move-in ready home, right in the heart of Midwest City! Inside you'll find original hardwood floors, updated main bath, large bedrooms, energy efficient windows and lots of storage. The kitchen and half-bath boast a clean and classic vintage look. Outside, enjoy the large covered back patio, huge backyard, creek/greenbelt area, newly-planted Magnolia tree and a sprinkler system. Flower beds and designated garden area could be a gardener's dream. Close to I-40, Tinker AFB and loads of restaurants and shopping!
-
2022-12-19$150,000 Active 543-char remark
Show marketing remark (543 chars)
Check out this cute and cozy move-in ready home, right in the heart of Midwest City! Inside you'll find original hardwood floors, updated main bath, large bedrooms, energy efficient windows and lots of storage. The kitchen and half-bath boast a clean and classic vintage look. Outside, enjoy the large covered back patio, huge backyard, creek/greenbelt area, newly-planted Magnolia tree and a sprinkler system. Flower beds and designated garden area could be a gardener's dream. Close to I-40, Tinker AFB and loads of restaurants and shopping!
-
2021-05-10soldstatus $109,500
-
2002-01-22soldstatus $69,000
-
2002-01-15soldstatus $68,900
-
2001-12-10$68,900
-
1985-04-01soldstatus $40,000
ⓘ Source: listings_history table (triggers on properties + properties_extension) + one-shot
backfill from property_details.listing_events for pre-trigger history.
Tax reassessment forecast OK · Resets to sale price
- Current annual tax
- $2,072 · $173/mo
- Projected year-2 tax
- $2,072 · $173/mo
- Expected delta
- $0/yr ($0/mo · 0.0%)
ⓘ Screening estimate from a state-policy table — verify with the county assessor before closing.
Climate risk First Street
- Flood 3/10 Moderate FEMA zone X (unshaded) · 20% chance over 30 yrs
- Wildfire 1/10 Low
- Heat 6/10 Major 7 d/yr ≥107°F today · 19 d/yr by 30 yrs out
- Wind 2/10 Low 4% chance of damaging wind over 30 yrs
- Air quality 2/10 Low 1 unhealthy d/yr today · 2 by 30 yrs out
Nearby sold comps map
Loading sold comps map…
Walkable amenities ~0.75 mi
Loading nearby amenities…
Taxation est. · year 1
- Rental income
- $15,074
- − Mortgage interest
- −$5,602
- − Property taxes
- −$2,072
- − Insurance
- −$500
- − Repairs & maintenance
- −$1,206
- − Management
- −$1,206
- − Depreciation
- −$2,909
- Taxable income
- $1,580
- Est. tax owed @ 24.0%
- −$379
- After-tax cash flow
- $2,664/yr
For passive investors: Depreciation is non-cash, so a rental often shows a tax loss while cash-flowing — sheltering income. Rental losses are passive: they offset passive income freely, and up to $25,000/yr can offset ordinary (W-2) income if you actively participate and your MAGI is under $100k (phasing out to $0 by $150k); unused losses carry forward. On sale, claimed depreciation is recaptured at up to 25%, and gains may owe capital-gains tax (a 1031 exchange can defer both). Figures are a year-1 estimate at your 24.0% rate — not tax advice; consult a CPA.
Schools (NCES district)
- District
- Midwest City-Del City
- NCES district ID
- 4019950
- Math proficiency
- 10% ▼ -11.00%
- Reading proficiency
- 17% ▼ -8.00%
- Median HH income
- $45,724
- Composite
- 12.09/100
- National rank
- #9658
- State rank
- #231 of 270 in OK
Livability — Midwest City
- Score
- 71/100
- State rank
- #30
- US rank
- #6637
Category grades
Schools grade is shown separately in the Schools card above.
Census & demographics
- Census place
- Midwest City, OK
- County
- Oklahoma County · 771,644 people
- City population
- 57,386
- Metro
- Oklahoma City, OK
- Population (ZIP)
- 32,348
- Household income
- $51,228
- Rent vs Own
- Severe rent burden
- 1440.0
Population outlook (Oklahoma County) Hauer SSP2
- Today (2025)
- 911,875 people
- By 2030
- 982,413 · +7.7%
- By 2040
- 1,130,468 · +24.0%
- By 2050
- 1,288,422 · +41.3%
- By 2075
- 1,711,482 · +87.7%
- By 2100
- 2,088,448 · +129.0%
Race, ethnicity, and origin ACS 2023
- Neighborhood character
- Diverse neighborhood (Simpson 0.63)
- Race & ethnicity
- White 55% Black 25% Two or more races 11% Hispanic / Latino 7% Native American 4% Asian 1%
- Hispanic origin (detail)
- Mexican 5%
- Common ancestry
- Lithuanian 2% Slovak 1% Serbian 1%
- Foreign-born
- 3% · Canada, Vietnam
- Languages at home
- 95% English-only · Spanish 3%
Political lean MEDSL · Oklahoma
- 2024 margin
- Toss-up / Even · D 48.0% · R 49.7% · Other 2.3%
- 2008→2024 swing
- +15.1pp toward D · 2008: -16.8pp · 2024: -1.7pp
- All cycles
- 2024: R+1.7 2020: R+1.1 2016: R+10.5 2012: R+16.7 2008: R+16.8
Not yet ingested
- Civics
- —
Market trends
- HPI YoY
- ▼ -156.25%
- Current HPI
- 257.0791
- Rent YoY
- ▲ 2.99%
- Metro
- Oklahoma City, OK
- State GDP YoY
- ▲ 1.55%
- F500 in state
- 6
Industry mix (Fortune 500 HQ in OK)
| Industry | F500 HQs | Revenue |
|---|---|---|
| Energy | 3 | $48B |
|
||
Price history
+150.0% since first listed15 events — show timeline
- 2026-04-17 Pending — MLSOK
- 2026-04-09 Listed $100,000 MLSOK
- 2025-10-08 Listing Removed — MLSOK
- 2025-08-17 Relisted — MLSOK
- 2025-04-27 Pending — MLSOK
- 2025-04-09 Listed $169,900 MLSOK
- 2023-01-30 Sold (Public Records) $143,000 Public Records
- 2023-01-27 Sold (MLS) $143,000 MLSOK
- 2023-01-02 Pending — MLSOK
- 2022-12-19 Listed $150,000 MLSOK
- 2021-05-10 Sold (Public Records) $109,500 Public Records
- 2002-01-22 Sold (Public Records) $69,000 Public Records
- 2002-01-15 Sold (MLS) $68,900 MLSOK
- 2001-12-10 Listed $68,900 MLSOK
- 1985-04-01 Sold (Public Records) $40,000 Public Records
Property tax history
+8.8%/yrLatest (2025): $2,072 · +2.5% YoY. Source: county tax records.
Cash-flow waterfall
monthlySold comps — $/sqft
last 12 mo · ≤1 miLoading sold comps…