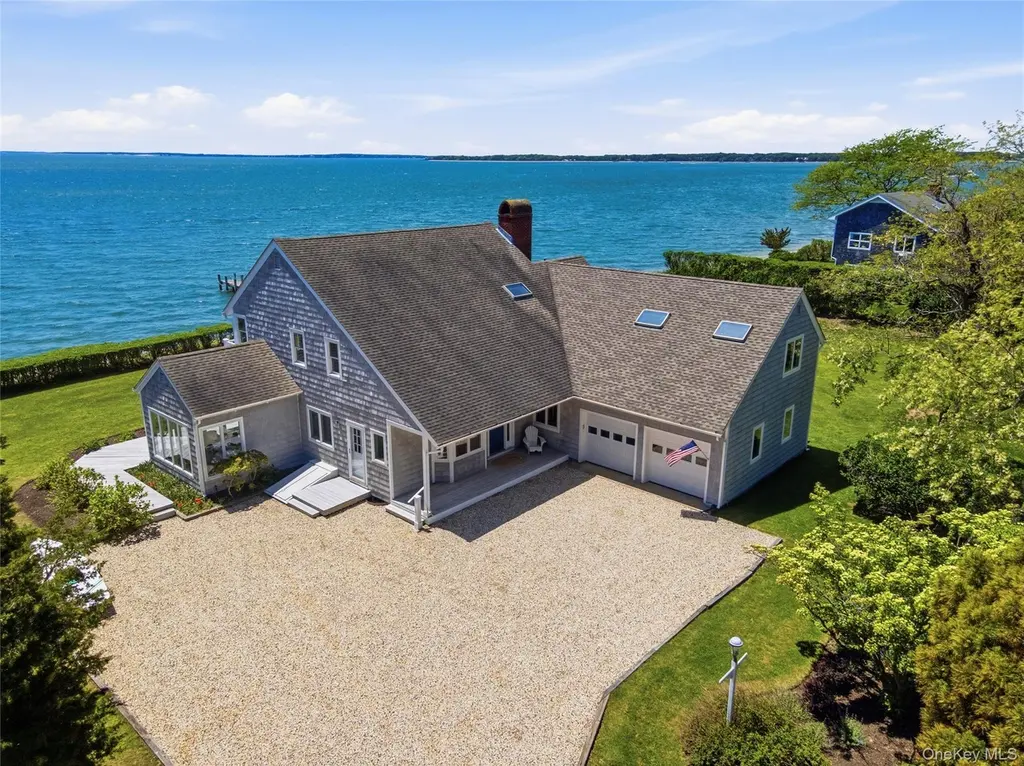
90 Peconic Ave · Shelter Island Heights, NY
Flood risk 3/10 · Minor
- FEMA flood zone
- X (unshaded)
- Chance of flooding over 30 yrs
- 0.1%
- Est. flood insurance / yr
- $473 – $860
Fire risk 1/10 · Minimal
- Est. fire insurance / yr
- $691 – $1,283
Heat risk 5/10 · Moderate
- Hot days now (above 90°F)
- 7 days/yr
- Hot days in 30 yrs
- 19 days/yr
Wind risk 8/10 · Major
- Chance of severe wind over 30 yrs
- 80.0%
Air-quality risk 3/10 · Minor
- Unhealthy air days now
- 2 days/yr
- Unhealthy air days in 30 yrs
- 3 days/yr
Risk factors via First Street. Map © Google.
Why this score? — see what drove the B+ grade
The composite is a weighted blend of 9 inputs, each scored 0–100. Each bar is that input's sub-score; the figure is the points it added to the 100-point composite (weight × sub-score).
- Cash flow +30.0/30.0
- 1% rule +10.0/10.0
- DSCR +10.0/10.0
- ARV discount +7.5/15.0
- Appreciation +6.0/10.0
- Schools +4.1/10.0
- Livability +2.8/5.0
- Rent growth +2.5/5.0
- Condition / age +2.5/5.0
$4,800,000
🖨 Deal sheet 📄 Offer letter ✓ Due diligence
Listing remarks
Held by a single family for nearly a century, 90 Peconic Avenue carries the kind of history that can't be manufactured - a deep sense of place, of summers lived well, of a waterfront that has remained unchanged while the world around it evolved. Custom built by Reich Eklund in 1985 and thoughtfully maintained, this classic Shelter Island shingled beach house sits on a level acre along one of the Island's most coveted stretches of waterfront -190 feet of Silver Beach shoreline, fully bulkheaded, with a private dock and unobstructed sunset views that define the property at every hour. Deceptively generous in scale, the five-bedroom, 3.5-bath residence features an open floor plan with every ro
Key facts
- Private dock
- Expansive side lawn
- Accessory structure
Tags
Property features AI
Finance
- HOA & community: Association with annual fee of $75 covering common area maintenance; Association amenities: Other
Exterior
- Parking: Attached garage; Two garage spaces; Driveway parking; Garage door opener; Oversized garage; Unpaved parking
- Utilities: Electricity connected (PSEG); Propane available; Water connected; Septic tank; Cable available; Private trash collection
- Home design: Single-family residence; Updated/remodeled condition; Three or more levels
- Construction: Frame construction; Shingle siding; Concrete perimeter foundation
- Exterior features: Back yard; Front yard; Garden; Landscaped grounds; Level and cleared lot; Private setting; Wooded areas; Waterfront with views
Interior
- Kitchen: Dishwasher; Gas cooktop; Electric oven; Exhaust fan; Refrigerator
- Bedrooms: Bedrooms present (includes a first-floor bedroom)
- Flooring: Wood flooring; Ceramic tile flooring
- Bathrooms: Three full bathrooms; One half bathroom
- Heating & cooling: Baseboard heating; Oil heating; Central air conditioning; Wall/window air conditioning units
- Interior features: First-floor bedroom; First-floor full bathroom; Beamed ceilings; Ceiling fans; Eat-in kitchen; Double-pane windows; Deck, patio, porch, and wrap-around porch; Basement (full, unfinished, with storage space); Grip-accessible features
- Laundry & utility: Washer; Dryer; Electric water heater; Laundry located inside
Neighborhood map
What this means for you Summary
Snapshot
- This is a 5-bed/3.5-bath single-family listed at $4.80M.
Deal economics
- At list price, monthly cash flow is $26k ($313k/yr) — positive.
- The deal already cash-flows at list — no discount required.
- Meets the 1% rule at list price ($75k rent vs $4.80M).
- Recommended offer: $4.73M (1.5% below list) — sets the bar for market timing.
Location & tenants
- Location reads 56/100 on livability (#1,120 in NY) — a working-class tenant base; expect higher turnover. Strengths: crime A+, employment A+; Watch: amenities F, commute F, cost of living F.
- Shelter Island Union Free School District (rural): math 40% / reading 45% proficiency, ranked #546 of 755 in NY (top 72%) — families likely to look elsewhere, expect single-tenant / working-renter base with shorter leases; only 16% free/reduced lunch — higher-income household profile.
- Market conditions: 39 active listings in the ZIP; 1 comparable units currently listed for rent nearby; 1,366 units permitted in Suffolk County in 2024 (216 in 5+ unit buildings).
Forward outlook
- In year one you build about $128k of equity ($33k loan paydown + $94k appreciation (2.0% local appreciation)).
- Suffolk County population projected to shrink 5% by 2050 — rents likely to lag national; underwrite the cash flow, not the appreciation.
- At projected returns (2.0% appreciation + 3.0% rent growth), your $1.34M cash investment doubles in ~3 years — after that, you're playing with house money.
- By year 3, paydown + projected appreciation supports a ~$324k cash-out refi (75% LTV) — recoverable capital for the next deal without selling this one.
Negotiation context
- It's been on market 16 days — a 2% lower offer ($4.73M) is reasonable based on typical stale-listing flexibility.
- 3 sale attempts since 7y ago with the ask held roughly flat each time — persistent listings suggest the price (not the market) is what's stuck; bring a comps-based counter.
Risks & watch-outs
- Climate carrying-cost: severe wind risk, 80% chance of damaging wind over 30y; extreme-heat days projected 7→19/yr by 2055 (HVAC capex compounding) — expect insurance premiums to compound above CPI over the hold.
Questions for the listing agent
- What does the HOA fee cover, when was the last increase, and are there any pending special assessments or reserve-fund shortfalls?
- Is there a deadline driving the sale (1031 exchange, divorce, estate, relocation)? That informs how much negotiation room exists.
- What's the average days-on-market for RENTAL listings here right now (not sales)? A rising rental-DOM trend means longer vacancies and softer asking-rent achievability than the comps imply.
- What's the recent tenant-quality profile in this submarket — average credit score on applications, eviction rate, late-payment / NSF rate, and stable-employment percentage? A property-management company in the area should have these aggregated.
- How much new for-sale + rental construction is in the pipeline within 1–3 miles? Heavy new supply typically softens prices + rents 12–24 months out; constrained supply supports both.
Investment metrics
- 1% rule
- 1.56% ✓
- Cap rate
- 12.81%
- Cash-on-cash
- 23.28%
- DSCR
- 2.04
- GRM
- 5.3
CMA / ARV
No comps found within radius.
Projected returns pro-forma
1.97% appreciation · 3.0% rent growth · sell at horizon
- IRR
- 27.4%
- Equity multiple
- 2.48×
- Total profit
- $1,983,204
- Equity at exit
- $1,885,182
- IRR
- 29.0%
- Equity multiple
- 4.77×
- Total profit
- $5,068,401
- Equity at exit
- $2,708,509
Cash invested: $1,344,000 (down + closing). Projections, not guarantees.
Landlord ↔ Tenant lean methodology
- Overall (STATE)
- 15 Strongly Tenant-Friendly
- State New York
- 15 Strongly Tenant-Friendly · D+10
- County
- — inherits STATE
- City
- — inherits STATE
ZIP-level market 11964
- Home prices YoY
- 0.4%
- Active inventory
- 39
- Price-to-rent
- 5.3×
Monthly cashflow live
- Estimated rent
- $75,000 medium interval (Pro) →
- Mortgage (P&I)
- −$25,172
- Tax est. 1.5%
- −$6,000 /mo · $72,000/yr
- Insurance
- −$2,000
- HOA
- −$6
- Vacancy / Maint / Mgmt
- −$15,750
- Net cashflow
- $26,072
Break-even live
UW: 25.0% down · 7.5% · 30yr · 1.5% tax · 5.0% vac · 8.0% maint · 8.0% mgmt
Financing live
Cash to close
- Down payment
- $1,200,000
- Closing costs
- $144,000
- Reserves months
- —
- Total cash needed
- —
Loan-product check · same deal, 3 products live
Conventional
25% down · 7.5% · 30yr
- Down + closing
- —
- Monthly P&I
- —
- Monthly cashflow
- —
- DSCR
- —
- Eligible?
- —
Personal DTI + credit; lowest rate.
DSCR
20% down · 8.5% · 30yr
- Down + closing
- —
- Monthly P&I
- —
- Monthly cashflow
- —
- DSCR
- —
- Eligible?
- —
No personal income docs; deal must DSCR.
Hard money
10% down · 12.0% · 12mo
- Down + closing
- —
- Monthly P&I
- —
- Monthly cashflow
- —
- DSCR
- —
- Eligible?
- —
Short-term bridge; refi at stabilization.
Rent comps 1 comps
| Address | Beds | Baths | Sqft | Rent | $/sqft | DOM | Units | Dist |
|---|---|---|---|---|---|---|---|---|
| 15 Montclair Ave Shelter Island, NY | 6.0 | 4.5 | 4600 | $75,000 | $16.30 | 22d | 1 | 0.53mi |
HOA detail
- Monthly dues
- $6 · $72/yr
- Likely covers
- water
Listing history 12 events
-
2026-06-18days on market $4,800,000 Active 16 DOM
-
2026-06-17days on market $4,800,000 Active 15 DOM
-
2026-06-16days on market $4,800,000 Active 14 DOM
-
2026-06-15days on market $4,800,000 Active 13 DOM
-
2026-06-13days on market $4,800,000 Active 11 DOM
-
2026-06-13days on market $4,800,000 Active 10 DOM
-
2026-06-09days on market $4,800,000 Active 7 DOM
-
2026-06-08days on market $4,800,000 Active 6 DOM
-
2026-06-07days on market $4,800,000 Active 5 DOM
-
2026-06-04days on market $4,800,000 Active 2 DOM
-
2026-06-02remarks 699-char remark
-
2026-06-02$4,800,000 Active 1 DOM
ⓘ Source: listings_history table (triggers on properties + properties_extension) + one-shot
backfill from property_details.listing_events for pre-trigger history.
Climate risk First Street
- Flood 3/10 Moderate FEMA zone X (unshaded) · 10% chance over 30 yrs
- Wildfire 1/10 Low
- Heat 5/10 Major 7 d/yr ≥90°F today · 19 d/yr by 30 yrs out
- Wind 8/10 Severe 80% chance of damaging wind over 30 yrs
- Air quality 3/10 Moderate 2 unhealthy d/yr today · 3 by 30 yrs out
Nearby sold comps map
Loading sold comps map…
Walkable amenities ~0.75 mi
Loading nearby amenities…
Taxation est. · year 1
- Rental income
- $900,000
- − Mortgage interest
- −$268,875
- − Property taxes
- −$72,000
- − Insurance
- −$24,000
- − Repairs & maintenance
- −$72,000
- − Management
- −$72,000
- − HOA
- −$72
- − Depreciation
- −$139,636
- Taxable income
- $251,417
- Est. tax owed @ 24.0%
- −$60,340
- After-tax cash flow
- $252,527/yr
For passive investors: Depreciation is non-cash, so a rental often shows a tax loss while cash-flowing — sheltering income. Rental losses are passive: they offset passive income freely, and up to $25,000/yr can offset ordinary (W-2) income if you actively participate and your MAGI is under $100k (phasing out to $0 by $150k); unused losses carry forward. On sale, claimed depreciation is recaptured at up to 25%, and gains may owe capital-gains tax (a 1031 exchange can defer both). Figures are a year-1 estimate at your 24.0% rate — not tax advice; consult a CPA.
Schools (NCES district)
- District
- Shelter Island Union Free School District
- NCES district ID
- 3626640
- Math proficiency
- 40% ▼ -15.00%
- Reading proficiency
- 45% ▼ -15.00%
- Median HH income
- $75,456
- Composite
- 41.31/100
- National rank
- #7365
- State rank
- #546 of 755 in NY
Livability — Shelter Island Heights
- Score
- 56/100
- State rank
- #1120
- US rank
- #23056
Category grades
Schools grade is shown separately in the Schools card above.
Census & demographics
- Census place
- Shelter Island Heights, NY
- Population (ZIP)
- 2,858
Population outlook (Suffolk County) Hauer SSP2
- Today (2025)
- 1,505,262 people
- By 2030
- 1,498,318 · -0.5%
- By 2040
- 1,471,101 · -2.3%
- By 2050
- 1,424,848 · -5.3%
- By 2075
- 1,337,157 · -11.2%
- By 2100
- 1,217,720 · -19.1%
Race, ethnicity, and origin ACS 2023
- Neighborhood character
- Diverse neighborhood (Simpson 0.57)
- Race & ethnicity
- White 62% Hispanic / Latino 21% Native American 15% Two or more races 7% Asian 6%
- Hispanic origin (detail)
- Mexican 16%
- Common ancestry
- Italian 13% Romanian 5% Portuguese 1%
- Foreign-born
- 15% · Canada
- Languages at home
- 78% English-only · Spanish 18% Other Indo-European 3%
Political lean MEDSL · Suffolk
- 2024 margin
- Lean R (+10.0) · D 45.0% · R 55.0%
- 2008→2024 swing
- -16.0pp toward R · 2008: 6.0pp · 2024: -10.0pp
- All cycles
- 2024: R+10.0 2020: R+0.0 2016: R+8.2 2012: D+2.9 2008: D+6.0
Not yet ingested
- Civics
- —
Market trends
- HPI YoY
- ▲ 1.97%
- Current HPI
- 476.2348
- Rent YoY
- —
- Metro
- —
- State GDP YoY
- ▲ 2.60%
- F500 in state
- 92
Industry mix (Fortune 500 HQ in NY)
| Industry | F500 HQs | Revenue |
|---|---|---|
| Financial Services | 10 | $950B |
|
||
| Consumer Goods | 9 | $162B |
|
||
| Insurance | 4 | $225B |
|
||
| Telecommunications | 2 | $144B |
|
||
| Pharmaceuticals | 2 | $112B |
|
||
| Media / Entertainment | 2 | $69B |
|
||
Price history
+26.5% since first listed9 events — show timeline
- 2026-05-25 Listed $4,800,000 OneKey® MLS as Distributed by MLS Grid
- 2021-04-28 Listing Removed — OneKey® MLS as Distributed by MLS Grid
- 2020-10-03 Price Changed $3,500,000 OneKey® MLS as Distributed by MLS Grid
- 2020-08-27 Price Changed $3,650,000 OneKey® MLS as Distributed by MLS Grid
- 2020-06-25 Price Changed $3,695,000 OneKey® MLS as Distributed by MLS Grid
- 2020-06-10 Listed $3,750,000 OneKey® MLS as Distributed by MLS Grid
- 2020-05-27 Listing Removed — OneKey® MLS as Distributed by MLS Grid
- 2020-03-01 Price Changed $3,750,000 OneKey® MLS as Distributed by MLS Grid
- 2019-09-22 Listed $3,795,000 OneKey® MLS as Distributed by MLS Grid
Cash-flow waterfall
monthlySold comps — $/sqft
last 12 mo · ≤1 miLoading sold comps…