1661 Limpkin Dr · Fort Worth, TX
Flood risk No data
- FEMA flood zone
- —
- Chance of flooding over 30 yrs
- —
- Est. flood insurance / yr
- —
Fire risk No data
- Est. fire insurance / yr
- —
Heat risk No data
- Hot days now (above threshold)
- —
- Hot days in 30 yrs
- —
Wind risk No data
- Chance of severe wind over 30 yrs
- —
Air-quality risk No data
- Unhealthy air days now
- —
- Unhealthy air days in 30 yrs
- —
Risk factors via First Street. Map © Google.
Why this score? — see what drove the D- grade
The composite is a weighted blend of 9 inputs, each scored 0–100. Each bar is that input's sub-score; the figure is the points it added to the 100-point composite (weight × sub-score).
- Cash flow +14.1/30.0
- ARV discount +6.0/15.0
- DSCR +4.3/10.0
- Livability +4.0/5.0
- 1% rule +3.1/10.0
- Rent growth +2.5/5.0
- Condition / age +2.5/5.0
- Schools +2.3/10.0
- Appreciation +0.0/10.0
$245,999
🖨 Deal sheet 📄 Offer letter ✓ Due diligence
Listing remarks MLS
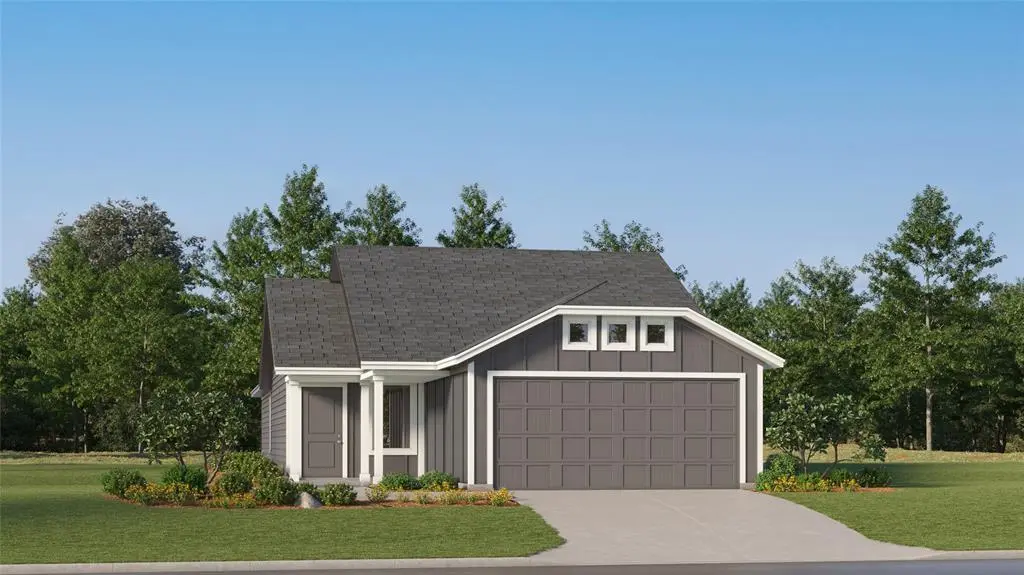
LENNAR - Eagles Crossing - Kitson Floorplan - This single-level home showcases a spacious open floorplan shared between the kitchen, dining area and family room for easy entertaining during gatherings. An owner’s suite enjoys a private location in a rear corner of the home, complemented by an en-suite bathroom and walk-in closet. There are two secondary bedrooms along the side of the home, which are comfortable spaces for household members and overnight guests. Prices and features may vary and are subject to change. Photos are for illustrative purposes only.
Key facts
- Walk-in closet
- Open floorplan
- Secondary bedrooms
Tags
Neighborhood map
What this means for you Summary
Snapshot
- This is a 3-bed/2.0-bath other listed at $246k.
Deal economics
- At list price, monthly cash flow is $38 ($453/yr) — positive.
- The deal already cash-flows at list — no discount required.
- To meet the 1% rule (rent ≥ 1% of price), the offer needs to be $198k (19.4% below list).
- Recommended offer: $198k (19.4% below list) — sets the bar for 1% rule.
- Cap rate 6.5% vs local median 3.9% in Fort Worth — top-decile yield for the area; either an underpriced asset or a hidden risk that comps aren't pricing in. Stress-test before assuming the spread holds.
Location & tenants
- Location reads 80/100 on livability (#49 in TX, #1,954 nationally) — a professional / high-income tenant draw. Strengths: amenities A+, cost of living A+, housing A+; Watch: schools D+, crime F.
- Everman ISD (suburban): math 21% / reading 32% proficiency, ranked #691 of 826 in TX (top 84%) — low school quality limits family demand, transient renter base, plan for 1-2y turnover; 77% free/reduced lunch — lower-income household profile, screen leases tightly.
- Market conditions: Rents flat; 374 active listings in the ZIP; 40 comparable units currently listed for rent nearby; rentals at typical pace (median 20d on market — plan ~3-4 weeks tenant-placement turnaround); solid renter incomes; 18,938 units permitted in Tarrant County in 2024 (8,336 in 5+ unit buildings).
- This rent runs 31% of the median local income ($76k/yr) — at the standard rent-burdened threshold; future hikes will face affordability resistance.
Forward outlook
- Local home prices are declining (-3.0%/yr); year-one equity from $2k of loan paydown is wiped out by about $7k of value loss. Plan a longer hold.
- Tarrant County population projected at +41% by 2050 — long-run rental-demand tailwind backs the buy-and-hold thesis.
Negotiation context
- It's been on market 55 days — a 3% lower offer ($239k) is reasonable based on typical stale-listing flexibility.
Questions for the listing agent
- It's been on market 55 days. Have you received any prior offers? Is the seller open to a 19% concession, seller financing, or rate buy-down credit?
- What does the HOA fee cover, when was the last increase, and are there any pending special assessments or reserve-fund shortfalls?
- Is there a deadline driving the sale (1031 exchange, divorce, estate, relocation)? That informs how much negotiation room exists.
- Schools are D-rated, which usually means shorter tenancies and higher turnover. Who's the typical renter profile here, and what's been the actual vacancy rate?
- Crime grade is F in this area — have there been break-ins, vandalism, or insurance claims at this property in the last 3 years? What carrier currently insures it and at what premium?
- The area grade is low — what's the realistic commute time and amenity access for the typical tenant pool here? Any planned neighborhood developments (good or bad) we should know about?
- What's the average days-on-market for RENTAL listings here right now (not sales)? A rising rental-DOM trend means longer vacancies and softer asking-rent achievability than the comps imply.
- What's the recent tenant-quality profile in this submarket — average credit score on applications, eviction rate, late-payment / NSF rate, and stable-employment percentage? A property-management company in the area should have these aggregated.
- How much new for-sale + rental construction is in the pipeline within 1–3 miles? Heavy new supply typically softens prices + rents 12–24 months out; constrained supply supports both.
Investment metrics
- 1% rule
- 0.81% ✗
- Cap rate
- 6.48%
- Cash-on-cash
- 0.66%
- DSCR
- 1.03
- GRM
- 10.3
CMA / ARV
- ARV (median comp)
- $237,821
- List price
- $245,999
- Delta
- 3.44%
- Verdict
- FAIR
- Comps
- 20 within 1.0 mi
Projected returns pro-forma
-3.0% appreciation · 0.11% rent growth · sell at horizon
- IRR
- -18.3%
- Equity multiple
- 0.37×
- Total profit
- $-43,134
- Equity at exit
- $36,679
- IRR
- -16.8%
- Equity multiple
- 0.18×
- Total profit
- $-56,465
- Equity at exit
- $21,269
Cash invested: $68,880 (down + closing). Projections, not guarantees.
Landlord ↔ Tenant lean methodology
- Overall (STATE)
- 87 Strongly Landlord-Friendly
- State Texas
- 87 Strongly Landlord-Friendly · R+5
- County
- — inherits STATE
- City
- — inherits STATE
ZIP-level market 76140
- Home prices YoY
- -21.8%
- Rents YoY
- 0.1%
- Active inventory
- 374
- Price-to-rent
- 10.3×
Monthly cashflow live
- Estimated rent
- $1,982 high interval (Pro) →
- Mortgage (P&I)
- −$1,290
- Tax from tax record
- −$93 /mo · $1,122/yr
- Insurance
- −$102
- HOA
- −$42
- Vacancy / Maint / Mgmt
- −$416
- Net cashflow
- $38
Break-even live
UW: 25.0% down · 7.5% · 30yr · 1.5% tax · 5.0% vac · 8.0% maint · 8.0% mgmt
Financing live
Cash to close
- Down payment
- $61,500
- Closing costs
- $7,380
- Reserves months
- —
- Total cash needed
- —
Loan-product check · same deal, 3 products live
Conventional
25% down · 7.5% · 30yr
- Down + closing
- —
- Monthly P&I
- —
- Monthly cashflow
- —
- DSCR
- —
- Eligible?
- —
Personal DTI + credit; lowest rate.
DSCR
20% down · 8.5% · 30yr
- Down + closing
- —
- Monthly P&I
- —
- Monthly cashflow
- —
- DSCR
- —
- Eligible?
- —
No personal income docs; deal must DSCR.
Hard money
10% down · 12.0% · 12mo
- Down + closing
- —
- Monthly P&I
- —
- Monthly cashflow
- —
- DSCR
- —
- Eligible?
- —
Short-term bridge; refi at stabilization.
Rent comps 40 comps
| Address | Beds | Baths | Sqft | Rent | $/sqft | DOM | Units | Dist |
|---|---|---|---|---|---|---|---|---|
| 1644 Limpkin Dr Fort Worth, TX | 3.0 | 2.0 | 1402 | $1,860 | $1.33 | 43d | 1 | 0.02mi |
| 1633 Limpkin Dr Fort Worth, TX | 3.0 | 2.0 | 1266 | $1,905 | $1.50 | 43d | 1 | 0.07mi |
| 1616 Limpkin Dr Fort Worth, TX | 4.0 | 2.0 | 1600 | $1,980 | $1.24 | 24d | 1 | 0.09mi |
| 1612 Limpkin Dr Fort Worth, TX | 3.0 | 2.0 | 1411 | $1,925 | $1.36 | 43d | 1 | 0.10mi |
| 1617 Crested Way Fort Worth, TX | 3.0 | 2.0 | 1411 | $2,200 | $1.56 | 43d | 1 | 0.11mi |
| 1680 Crested Way Fort Worth, TX | 3.0 | 2.0 | 1411 | $1,895 | $1.34 | 12d | 1 | 0.13mi |
| 1508 Pine Ln Fort Worth, TX | 3.0 | 1.0 | 1098 | $1,599 | $1.46 | 43d | 1 | 0.24mi |
| 1461 Pine Ln Fort Worth, TX | 3.0 | 2.0 | 1268 | $1,739 | $1.37 | 7d | 1 | 0.27mi |
| 1452 Pine Ln Fort Worth, TX | 3.0 | 1.5 | 1098 | $1,595 | $1.45 | 20d | 1 | 0.28mi |
| 1437 Pine Ln Fort Worth, TX | 3.0 | 2.0 | 1175 | $1,800 | $1.53 | 43d | 1 | 0.30mi |
| 1433 Pine Ln Fort Worth, TX | 3.0 | 3.0 | 1316 | $2,075 | $1.58 | 43d | 1 | 0.31mi |
| 1424 Pine Ln Fort Worth, TX | 3.0 | 2.5 | 1332 | $1,590 | $1.19 | 12d | 1 | 0.32mi |
| 1432 Silver Oak Ln Fort Worth, TX | 4.0 | 3.0 | 1550 | $2,143 | $1.38 | 24d | 1 | 0.33mi |
| 1408 Silver Spruce Ln Fort Worth, TX | 3.0 | 2.0 | 1411 | $1,800 | $1.28 | 18d | 1 | 0.35mi |
| 10716 Wild Oak Dr Fort Worth, TX | 2.0 | 2.0 | 1072 | $1,595 | $1.49 | 20d | 1 | 0.38mi |
| 1800 Oak Grove Rd E Burleson, TX | 3.0–4.0 | 2.0 | 1392 | $1,795 | $1.29 | 1d | 14 | 0.40mi |
| 10628 Wild Oak Dr Fort Worth, TX | 3.0 | 2.5 | 1312 | $1,740 | $1.33 | 3d | 1 | 0.40mi |
| 10745 Many Oaks Dr Fort Worth, TX | 2.0 | 1.0 | 997 | $1,595 | $1.60 | 24d | 1 | 0.40mi |
| 10213 S Race St Fort Worth, TX | 4.0 | 2.0 | 1819 | $1,961 | $1.08 | 22d | 1 | 0.53mi |
| 1412 Royal Meadows Trl Fort Worth, TX | 3.0 | 2.0 | 1576 | $1,779 | $1.13 | 2d | 1 | 0.63mi |
| 1300 Hazelnut Dr Fort Worth, TX | 3.0 | 2.0 | 1448 | $2,300 | $1.59 | 5d | 1 | 0.69mi |
| 1500 Four Seasons Ln Fort Worth, TX | 1.0–3.0 | 1.0–2.0 | 876 | $1,400 | $1.60 | 22d | 1 | 0.88mi |
| 10613 Flamewood Dr Fort Worth, TX | 3.0 | 2.0 | 1324 | $1,550 | $1.17 | 43d | 1 | 0.89mi |
| 1312 Nelson Pl Burleson, TX | 3.0 | 2.0 | 1232 | $1,820 | $1.48 | 43d | 1 | 0.89mi |
| 10525 Flamewood Dr Fort Worth, TX | 3.0 | 2.0 | 1446 | $1,849 | $1.28 | 2d | 1 | 0.90mi |
| 1456 Palamedes Dr Fort Worth, TX | 3.0 | 2.0 | 1316 | $2,000 | $1.52 | 4d | 1 | 0.92mi |
| 10640 Towerwood Dr Fort Worth, TX | 3.0 | 2.0 | 1422 | $1,696 | $1.19 | 7d | 1 | 0.96mi |
| 10632 Towerwood Dr Fort Worth, TX | 3.0 | 2.0 | 1382 | $1,750 | $1.27 | 24d | 1 | 0.96mi |
| 1421 Sunkiss Dr Fort Worth, TX | 3.0 | 2.0 | 1604 | $1,995 | $1.24 | 2d | 1 | 0.97mi |
| 1324 Sierra Blanca Dr Burleson, TX | 3.0 | 2.0 | 1541 | $2,000 | $1.30 | 43d | 1 | 0.97mi |
| 1401 Sunkiss Dr Fort Worth, TX | 3.0 | 2.0 | 1600 | $2,095 | $1.31 | 12d | 1 | 1.02mi |
| 10436 Phantom Hill Rd Fort Worth, TX | 3.0 | 2.0 | 1498 | $1,885 | $1.26 | 7d | 1 | 1.05mi |
| 9632 Sierra Grande Dr Fort Worth, TX | 3.0 | 2.0 | 1600 | $1,895 | $1.18 | 43d | 1 | 1.05mi |
| 1540 Woodwinds Dr Fort Worth, TX | 4.0 | 2.0 | 1600 | $2,280 | $1.43 | 5d | 1 | 1.06mi |
| 9609 Sierra Grande Dr Fort Worth, TX | 4.0 | 2.0 | 1754 | $2,175 | $1.24 | 7d | 1 | 1.08mi |
| 1209 Brownford Dr Burleson, TX | 3.0 | 2.0 | 1495 | $1,875 | $1.25 | 43d | 1 | 1.08mi |
| 812 Peaceful Brook Dr Fort Worth, TX | 3.0 | 2.0 | 1557 | $1,995 | $1.28 | 43d | 1 | 1.09mi |
| 1329 Woodwinds Dr Fort Worth, TX | 4.0 | 2.0 | 1803 | $2,320 | $1.29 | 5d | 1 | 1.09mi |
| 1505 Woodwinds Dr Fort Worth, TX | 4.0 | 2.0 | 1600 | $2,280 | $1.43 | 19d | 1 | 1.10mi |
| 1508 Harvester Dr Fort Worth, TX | 4.0 | 2.0 | 1724 | $2,328 | $1.35 | 7d | 1 | 1.12mi |
HOA detail
- Monthly dues
- $42 · $504/yr
Listing history 4 events
-
2026-05-15price $245,999 575-char remark
Show marketing remark (575 chars)
LENNAR - Eagles Crossing - Kitson Floorplan - This single-level home showcases a spacious open floorplan shared between the kitchen, dining area and family room for easy entertaining during gatherings. An owner’s suite enjoys a private location in a rear corner of the home, complemented by an en-suite bathroom and walk-in closet. There are two secondary bedrooms along the side of the home, which are comfortable spaces for household members and overnight guests. Prices and features may vary and are subject to change. Photos are for illustrative purposes only.
-
2026-05-14status Pending 575-char remark
Show marketing remark (575 chars)
LENNAR - Eagles Crossing - Kitson Floorplan - This single-level home showcases a spacious open floorplan shared between the kitchen, dining area and family room for easy entertaining during gatherings. An owner’s suite enjoys a private location in a rear corner of the home, complemented by an en-suite bathroom and walk-in closet. There are two secondary bedrooms along the side of the home, which are comfortable spaces for household members and overnight guests. Prices and features may vary and are subject to change. Photos are for illustrative purposes only.
-
2026-05-12price $287,999 575-char remark
Show marketing remark (575 chars)
LENNAR - Eagles Crossing - Kitson Floorplan - This single-level home showcases a spacious open floorplan shared between the kitchen, dining area and family room for easy entertaining during gatherings. An owner’s suite enjoys a private location in a rear corner of the home, complemented by an en-suite bathroom and walk-in closet. There are two secondary bedrooms along the side of the home, which are comfortable spaces for household members and overnight guests. Prices and features may vary and are subject to change. Photos are for illustrative purposes only.
-
2026-03-20$250,999 Active 575-char remark
Show marketing remark (575 chars)
LENNAR - Eagles Crossing - Kitson Floorplan - This single-level home showcases a spacious open floorplan shared between the kitchen, dining area and family room for easy entertaining during gatherings. An owner’s suite enjoys a private location in a rear corner of the home, complemented by an en-suite bathroom and walk-in closet. There are two secondary bedrooms along the side of the home, which are comfortable spaces for household members and overnight guests. Prices and features may vary and are subject to change. Photos are for illustrative purposes only.
ⓘ Source: listings_history table (triggers on properties + properties_extension) + one-shot
backfill from property_details.listing_events for pre-trigger history.
Tax reassessment forecast TX · Resets to sale price
- Current annual tax
- $1,122 · $93/mo
- Projected year-2 tax
- $4,502 · $375/mo
- Expected delta
- +$3,380/yr (+$282/mo · 301.3%)
ⓘ Screening estimate from a state-policy table — verify with the county assessor before closing.
Nearby sold comps map
Loading sold comps map…
Walkable amenities ~0.75 mi
Loading nearby amenities…
Taxation est. · year 1
- Rental income
- $23,784
- − Mortgage interest
- −$13,780
- − Property taxes
- −$1,122
- − Insurance
- −$1,230
- − Repairs & maintenance
- −$1,903
- − Management
- −$1,903
- − HOA
- −$504
- − Depreciation
- −$7,156
- Taxable loss
- −$3,813
- Est. tax savings @ 24.0%
- +$915
- After-tax cash flow
- $1,368/yr
For passive investors: Depreciation is non-cash, so a rental often shows a tax loss while cash-flowing — sheltering income. Rental losses are passive: they offset passive income freely, and up to $25,000/yr can offset ordinary (W-2) income if you actively participate and your MAGI is under $100k (phasing out to $0 by $150k); unused losses carry forward. On sale, claimed depreciation is recaptured at up to 25%, and gains may owe capital-gains tax (a 1031 exchange can defer both). Figures are a year-1 estimate at your 24.0% rate — not tax advice; consult a CPA.
Schools (NCES district)
- District
- Everman ISD
- NCES district ID
- 4818810
- Math proficiency
- 21% ▼ -18.00%
- Reading proficiency
- 32% ▼ -4.00%
- Median HH income
- $44,803
- Composite
- 22.77/100
- National rank
- #8027
- State rank
- #691 of 826 in TX
Livability — Fort Worth
- Score
- 80/100
- State rank
- #49
- US rank
- #1954
Category grades
Schools grade is shown separately in the Schools card above.
Census & demographics
- Census place
- Fort Worth, TX
- County
- Tarrant County · 2,033,669 people
- City population
- 911,619
- Metro
- Dallas-Fort Worth-Arlington, TX
- Population (ZIP)
- 33,321
- Household income
- $75,955
- Rent vs Own
- Severe rent burden
- 1264.0
Population outlook (Tarrant County) Hauer SSP2
- Today (2025)
- 2,380,417 people
- By 2030
- 2,578,900 · +8.3%
- By 2040
- 2,974,995 · +25.0%
- By 2050
- 3,350,489 · +40.8%
- By 2075
- 4,216,909 · +77.2%
- By 2100
- 4,741,527 · +99.2%
Race, ethnicity, and origin ACS 2023
- Neighborhood character
- Diverse neighborhood (Simpson 0.68)
- Race & ethnicity
- Hispanic / Latino 39% Black 35% White 20% Two or more races 14% Asian 3%
- Hispanic origin (detail)
- Mexican 36%
- Common ancestry
- Scotch-Irish 2% Lithuanian 1% Slovak 1%
- Foreign-born
- 18% · Canada, Vietnam, China
- Languages at home
- 64% English-only · Spanish 32% Vietnamese 2% Chinese 1%
Political lean MEDSL · Tarrant
- 2024 margin
- Lean R (+5.1) · D 46.7% · R 51.9% · Other 1.4%
- 2008→2024 swing
- +6.6pp toward D · 2008: -11.7pp · 2024: -5.1pp
- All cycles
- 2024: R+5.1 2020: D+0.2 2016: R+8.7 2012: R+15.7 2008: R+11.7
Not yet ingested
- Civics
- —
Market trends
- HPI YoY
- ▼ -79.54%
- Current HPI
- 285.9894
- Rent YoY
- ▲ 0.11%
- Metro
- Dallas-Fort Worth-Arlington, TX
- State GDP YoY
- ▲ 3.95%
- F500 in state
- 110
Industry mix (Fortune 500 HQ in TX)
| Industry | F500 HQs | Revenue |
|---|---|---|
| Energy | 16 | $1,198B |
|
||
| Technology | 5 | $198B |
|
||
| Engineering / Construction | 4 | $72B |
|
||
| Energy Services | 3 | $60B |
|
||
| Utilities | 3 | $41B |
|
||
| Healthcare | 2 | $330B |
|
||
Price history
-2.0% since first listed4 events — show timeline
- 2026-05-15 Price Changed $245,999 NTREIS
- 2026-05-14 Pending — NTREIS
- 2026-05-12 Price Changed $287,999 NTREIS
- 2026-03-20 Listed $250,999 NTREIS
Cash-flow waterfall
monthlySold comps — $/sqft
last 12 mo · ≤1 miLoading sold comps…