147 SE Olustee Ave · Watertown, FL
Flood risk 1/10 · Minimal
- FEMA flood zone
- X (unshaded)
- Chance of flooding over 30 yrs
- 0.0%
- Est. flood insurance / yr
- $507 – $1,088
Fire risk 3/10 · Minor
- Est. fire insurance / yr
- $947 – $1,759
Heat risk 8/10 · Major
- Hot days now (above 107°F)
- 7 days/yr
- Hot days in 30 yrs
- 20 days/yr
Wind risk 9/10 · Severe
- Chance of severe wind over 30 yrs
- 99.0%
Air-quality risk 5/10 · Moderate
- Unhealthy air days now
- 9 days/yr
- Unhealthy air days in 30 yrs
- 10 days/yr
Risk factors via First Street. Map © Google.
Why this score? — see what drove the F grade
The composite is a weighted blend of 9 inputs, each scored 0–100. Each bar is that input's sub-score; the figure is the points it added to the 100-point composite (weight × sub-score).
- Appreciation +10.0/10.0
- Cash flow +7.5/30.0
- Schools +4.5/10.0
- Livability +3.0/5.0
- Rent growth +2.5/5.0
- Condition / age +2.5/5.0
- DSCR +1.7/10.0
- 1% rule +1.3/10.0
- ARV discount +0.0/15.0
$284,900
🖨 Deal sheet (PDF) 📄 Offer letter ✓ Due diligence
Listing remarks MLS
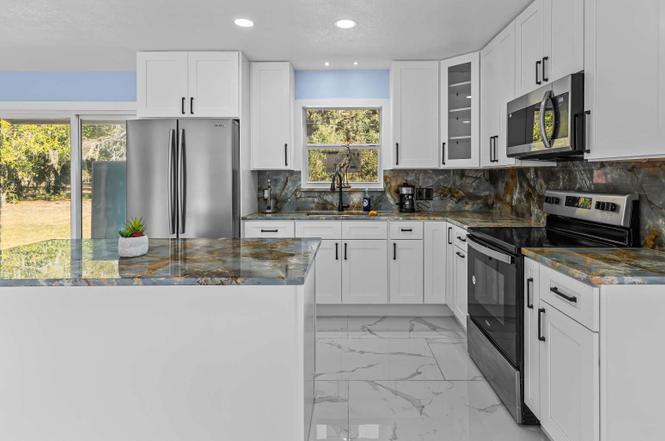
Great investment home. Located in an established subdivision, this 3-bedroom, 2 bath home. Open kitchen, large living room, storage area under carport and fenced back yard. This house is conveniently located near restaurants, hospitals, schools, shopping and much more.
Key facts
- Remodeled
- Large living area
- Spacious cabinetry
Tags
Property features AI
Exterior
- Parking: On-street parking
- Home design: Single-family residential; 1 story
- Construction: Brick construction; Shingle roof; Slab foundation; Built on approximately 0.258 acre lot
- Exterior features: Patio; Chain link fence; Shed(s)
Interior
- Kitchen: Electric cooktop; Refrigerator; Microwave
- Bathrooms: 2 full bathrooms
- Interior features: Ceiling fans; Central air conditioning; Central electric heating
Neighborhood map
What this means for you Summary
Snapshot
- This is a 3-bed/2.0-bath single-family listed at $285k.
Deal economics
- At list price, monthly cash flow is $-349 ($-4k/yr) — negative.
- To cash-flow at today's rent, offer at most $223k (21.6% below list).
- To meet the 1% rule (rent ≥ 1% of price), the offer needs to be $180k (36.9% below list).
- Recommended offer: $180k (36.9% below list) — sets the bar for 1% rule.
Location & tenants
- Location reads 60/100 on livability (#798 in FL) — a middle-class / working-renter tenant base. Strengths: crime A+, cost of living A+, housing A-; Watch: amenities F, commute F, employment F.
- Columbia (town): math 53% / reading 54% proficiency, ranked #25 of 73 in FL (top 34%) — acceptable for families but not a draw, mixed tenant base, ~2y average lease.
- Zoned schools: Eastside Elementary School (math 68% / reading 62%, grade B+, #514 of 2,144 statewide, top 24%, 631 students, 62% FRL); Columbia High School (math 28% / reading 45%, grade F, #351 of 667 statewide, top 54%, 1,737 students, 50% FRL) — zoned schools at 56% FRL track the district average.
- Market conditions: 146 active listings in the ZIP; 178 units permitted in Columbia County in 2024 (0 in 5+ unit buildings).
- This rent runs 39% of the median local income ($55k/yr) — at the standard rent-burdened threshold; future hikes will face affordability resistance.
Forward outlook
- In year one you build about $30k of equity ($2k loan paydown + $28k appreciation (10.0% local appreciation)).
- Columbia County population projected to shrink 7% by 2050 — rents likely to lag national; underwrite the cash flow, not the appreciation.
- By year 2, paydown + projected appreciation supports a ~$49k cash-out refi (75% LTV) — recoverable capital for the next deal without selling this one.
Negotiation context
- It's been on market 112 days — a 9% lower offer ($259k) is reasonable based on typical stale-listing flexibility.
- 6 sale attempts since 3y ago with the ask held roughly flat each time — persistent listings suggest the price (not the market) is what's stuck; bring a comps-based counter.
- Current owner paid $178k; list at $285k implies a 60% gain — meaningful room to come down on a strong offer.
Risks & watch-outs
- Climate carrying-cost: severe wind risk, 99% chance of damaging wind over 30y; extreme-heat days projected 7→20/yr by 2055 (HVAC capex compounding) — expect insurance premiums to compound above CPI over the hold.
Questions for the listing agent
- What do current leases actually rent for vs. the listed asking? Can we see a recent rent roll and the last 12 months of T-12 income?
- It's been on market 112 days. Have you received any prior offers? Is the seller open to a 37% concession, seller financing, or rate buy-down credit?
- Built in 1964 — when were the roof, HVAC, electrical panel, plumbing, and water heater last replaced?
- Why hasn't it sold? Are there any deal-killer items the seller is aware of (foundation, flood, title, zoning, code violations)?
- Is there a deadline driving the sale (1031 exchange, divorce, estate, relocation)? That informs how much negotiation room exists.
- Schools are F-rated, which usually means shorter tenancies and higher turnover. Who's the typical renter profile here, and what's been the actual vacancy rate?
- The area grade is low — what's the realistic commute time and amenity access for the typical tenant pool here? Any planned neighborhood developments (good or bad) we should know about?
- What's the average days-on-market for RENTAL listings here right now (not sales)? A rising rental-DOM trend means longer vacancies and softer asking-rent achievability than the comps imply.
- What's the recent tenant-quality profile in this submarket — average credit score on applications, eviction rate, late-payment / NSF rate, and stable-employment percentage? A property-management company in the area should have these aggregated.
- How much new for-sale + rental construction is in the pipeline within 1–3 miles? Heavy new supply typically softens prices + rents 12–24 months out; constrained supply supports both.
Investment metrics
- 1% rule
- 0.63% ✗
- Cap rate
- 4.82%
- Cash-on-cash
- -5.25%
- DSCR
- 0.77
- GRM
- 13.2
CMA / ARV
- ARV (on-the-fly)
- $218,790
- Comps found
- 12
Show comp detail 12 sales within ~0.75 mi
| Address | Dist | Beds/Ba | Sqft | Sold | Price | $/sf | Match |
|---|---|---|---|---|---|---|---|
| 176 SE Dekle Way | 0.25mi | 3/1.0 | 1,390 (-3%) | 3mo | $145,000 | $104 | 77 |
| 772 SE Defender Dr | 0.21mi | 3/1.5 | 1,509 (+6%) | 8mo | $170,000 | $113 | 73 |
| 186 SE Rosewood Cir | 0.33mi | 2/1.5 (-1) | 1,448 (+1%) | 6mo | $235,000 | $162 | 71 |
| 1871 SE Baya Dr | 0.11mi | 3/2.0 | 1,575 (+10%) | 10mo | $175,000 | $111 | 70 |
| 465 SE Golf Club Ave | 0.16mi | 3/2.0 | 1,215 (-15%) | 0mo | $175,000 | $144 | 67 |
| 465 SE Rosewood Cir | 0.36mi | 2/2.0 (-1) | 1,488 (+4%) | 7mo | $255,000 | $171 | 66 |
| 795 SE Defender Dr | 0.21mi | 3/1.5 | 1,568 (+10%) | 8mo | $193,500 | $123 | 66 |
| 208 SE Elm Loop | 0.29mi | 3/2.0 | 1,230 (-14%) | 7mo | $192,500 | $157 | 57 |
| 406 SE Pearl Ter | 0.37mi | 2/2.0 (-1) | 1,288 (-10%) | 9mo | $219,000 | $170 | 54 |
| 240 SE Cameron Ter | 0.39mi | 3/2.0 | 1,225 (-14%) | 5mo | $235,000 | $192 | 53 |
| 201 SE Rosewood Cir | 0.30mi | 2/2.0 (-1) | 1,220 (-15%) | 7mo | $187,000 | $153 | 51 |
| 173 SE Jenese Way | 0.46mi | 2/2.0 (-1) | 1,216 (-15%) | 0mo | $180,000 | $148 | 48 |
Match score weights: distance 35% · size 25% · config 20% · recency 20%. Top-matched comps best support the ARV.
Projected returns pro-forma
10.0% appreciation · 3.0% rent growth · sell at horizon
- IRR
- 20.5%
- Equity multiple
- 2.67×
- Total profit
- $132,836
- Equity at exit
- $256,660
- IRR
- 18.7%
- Equity multiple
- 6.12×
- Total profit
- $408,474
- Equity at exit
- $553,498
Cash invested: $79,772 (down + closing). Projections, not guarantees.
Landlord ↔ Tenant lean methodology
- Overall (STATE)
- 87 Strongly Landlord-Friendly
- State Florida
- 87 Strongly Landlord-Friendly · R+3
- County
- — inherits STATE
- City
- — inherits STATE
ZIP-level market 32025
- Home prices YoY
- 6.8%
- Active inventory
- 146
- Price-to-rent
- 13.2×
Monthly cashflow live
- Estimated rent
- $1,799 medium interval (Pro) →
- Mortgage (P&I)
- −$1,494
- Tax from tax record
- −$157 /mo · $1,888/yr
- Insurance
- −$119
- HOA
- −$0
- Vacancy / Maint / Mgmt
- −$378
- Net cashflow
- $-349
Break-even live
Sensitivity live
| Price | -10% $-188 | -5% $-268 | +0% $-349 | +5% $-430 | +10% $-510 |
|---|---|---|---|---|---|
| Rent | -10% $-491 | -5% $-420 | +0% $-349 | +5% $-278 | +10% $-207 |
| Rate | -1.0pp $-206 | -0.5pp $-277 | base $-349 | +0.5pp $-423 | +1.0pp $-498 |
UW: 25.0% down · 7.5% · 30yr · 1.5% tax · 5.0% vac · 8.0% maint · 8.0% mgmt
Financing live
Cash to close
- Down payment
- $71,225
- Closing costs
- $8,547
- Reserves months
- —
- Total cash needed
- —
Loan-product check · same deal, 3 products live
Conventional
25% down · 7.5% · 30yr
- Down + closing
- —
- Monthly P&I
- —
- Monthly cashflow
- —
- DSCR
- —
- Eligible?
- —
Personal DTI + credit; lowest rate.
DSCR
20% down · 8.5% · 30yr
- Down + closing
- —
- Monthly P&I
- —
- Monthly cashflow
- —
- DSCR
- —
- Eligible?
- —
No personal income docs; deal must DSCR.
Hard money
10% down · 12.0% · 12mo
- Down + closing
- —
- Monthly P&I
- —
- Monthly cashflow
- —
- DSCR
- —
- Eligible?
- —
Short-term bridge; refi at stabilization.
Listing history 29 events
-
2026-06-21days on market $284,900 Active 112 DOM
-
2026-06-19days on market $284,900 Active 110 DOM
-
2026-06-18days on market $284,900 Active 109 DOM
-
2026-06-17days on market $284,900 Active 108 DOM
-
2026-06-16days on market $284,900 Active 107 DOM
-
2026-06-15days on market $284,900 Active 106 DOM
-
2026-06-14days on market $284,900 Active 104 DOM
-
2026-06-12days on market $284,900 Active 103 DOM
-
2026-06-09days on market $284,900 Active 100 DOM
-
2026-06-08days on market $284,900 Active 99 DOM
-
2026-06-07days on market $284,900 Active 98 DOM
-
2026-06-05days on market $284,900 Active 95 DOM
-
2026-06-03days on market $284,900 Active 94 DOM
-
2026-06-02days on market $284,900 Active 93 DOM
-
2026-06-01days on market $284,900 Active 92 DOM
-
2026-05-31days on market $284,900 Active 91 DOM
-
2026-05-30days on market $284,900 Active 90 DOM
-
2026-03-02historical $2,000
-
2026-03-01$284,900 Active
-
2026-02-14$2,000
-
2024-01-28status Active Under Contract 269-char remark
Show marketing remark (269 chars)
Great investment home. Located in an established subdivision, this 3-bedroom, 2 bath home. Open kitchen, large living room, storage area under carport and fenced back yard. This house is conveniently located near restaurants, hospitals, schools, shopping and much more.
-
2024-01-28soldstatus $178,000 Closed 269-char remark
Show marketing remark (269 chars)
Great investment home. Located in an established subdivision, this 3-bedroom, 2 bath home. Open kitchen, large living room, storage area under carport and fenced back yard. This house is conveniently located near restaurants, hospitals, schools, shopping and much more.
-
2024-01-08status Active 269-char remark
Show marketing remark (269 chars)
Great investment home. Located in an established subdivision, this 3-bedroom, 2 bath home. Open kitchen, large living room, storage area under carport and fenced back yard. This house is conveniently located near restaurants, hospitals, schools, shopping and much more.
-
2023-09-12price $160,000 269-char remark
Show marketing remark (269 chars)
Great investment home. Located in an established subdivision, this 3-bedroom, 2 bath home. Open kitchen, large living room, storage area under carport and fenced back yard. This house is conveniently located near restaurants, hospitals, schools, shopping and much more.
-
2023-07-09status Active 269-char remark
Show marketing remark (269 chars)
Great investment home. Located in an established subdivision, this 3-bedroom, 2 bath home. Open kitchen, large living room, storage area under carport and fenced back yard. This house is conveniently located near restaurants, hospitals, schools, shopping and much more.
-
2023-06-11historical Active Under Contract 269-char remark
Show marketing remark (269 chars)
Great investment home. Located in an established subdivision, this 3-bedroom, 2 bath home. Open kitchen, large living room, storage area under carport and fenced back yard. This house is conveniently located near restaurants, hospitals, schools, shopping and much more.
-
2023-05-10$164,000 Active 269-char remark
Show marketing remark (269 chars)
Great investment home. Located in an established subdivision, this 3-bedroom, 2 bath home. Open kitchen, large living room, storage area under carport and fenced back yard. This house is conveniently located near restaurants, hospitals, schools, shopping and much more.
-
2015-06-29soldstatus $52,000
-
2015-06-17soldstatus $52,000 254-char remark
Show marketing remark (254 chars)
Great starter or investment home. Located in an established subdivision, this 3 bedroom 2 bath home is spacious and functional. Open kitchen with plenty of cabinet and counter space, interior utility room, storage area under carport and fenced back yard.
ⓘ Source: listings_history table (triggers on properties + properties_extension) + one-shot
backfill from property_details.listing_events for pre-trigger history.
Tax reassessment forecast FL · Resets to sale price
- Current annual tax
- $1,888 · $157/mo
- Projected year-2 tax
- $2,365 · $197/mo
- Expected delta
- +$477/yr (+$40/mo · 25.3%)
ⓘ Screening estimate from a state-policy table — verify with the county assessor before closing.
Climate risk First Street
- Flood 1/10 Low FEMA zone X (unshaded) · 0% chance over 30 yrs
- Wildfire 3/10 Moderate
- Heat 8/10 Severe 7 d/yr ≥107°F today · 20 d/yr by 30 yrs out
- Wind 9/10 Extreme 99% chance of damaging wind over 30 yrs
- Air quality 5/10 Major 9 unhealthy d/yr today · 10 by 30 yrs out
Nearby sold comps map
Loading sold comps map…
Walkable amenities ~0.75 mi
Loading nearby amenities…
Taxation est. · year 1
- Rental income
- $21,585
- − Mortgage interest
- −$15,959
- − Property taxes
- −$1,888
- − Insurance
- −$1,424
- − Repairs & maintenance
- −$1,727
- − Management
- −$1,727
- − Depreciation
- −$8,288
- Taxable loss
- −$9,428
- Est. tax savings @ 24.0%
- +$2,263
- After-tax cash flow
- $-1,926/yr
For passive investors: Depreciation is non-cash, so a rental often shows a tax loss while cash-flowing — sheltering income. Rental losses are passive: they offset passive income freely, and up to $25,000/yr can offset ordinary (W-2) income if you actively participate and your MAGI is under $100k (phasing out to $0 by $150k); unused losses carry forward. On sale, claimed depreciation is recaptured at up to 25%, and gains may owe capital-gains tax (a 1031 exchange can defer both). Figures are a year-1 estimate at your 24.0% rate — not tax advice; consult a CPA.
Schools (NCES district)
- District
- Columbia
- NCES district ID
- 1200360
- Math proficiency
- 53% ▼ -10.00%
- Reading proficiency
- 54% ▼ -3.00%
- Median HH income
- $40,053
- Composite
- 44.74/100
- National rank
- #2750
- State rank
- #25 of 73 in FL
Livability — Watertown
- Score
- 60/100
- State rank
- #798
- US rank
- #18481
Category grades
Schools grade is shown separately in the Schools card above.
Census & demographics
- Census place
- Watertown, FL
- County
- Columbia County · 40,507 people
- Metro
- Lake City, FL
- Population (ZIP)
- 22,948
- Household income
- $55,004
- Rent vs Own
- Severe rent burden
- 754.0
Population outlook (Columbia County) Hauer SSP2
- Today (2025)
- 68,129 people
- By 2030
- 67,501 · -0.9%
- By 2040
- 65,465 · -3.9%
- By 2050
- 63,058 · -7.4%
- By 2075
- 56,291 · -17.4%
- By 2100
- 45,243 · -33.6%
Race, ethnicity, and origin ACS 2023
- Neighborhood character
- Predominantly White (67%)
- Race & ethnicity
- White 67% Black 20% Hispanic / Latino 8% Two or more races 7%
- Hispanic origin (detail)
- Mexican 1% Puerto Rican 3% Cuban 1%
- Common ancestry
- Serbian 2% Lithuanian 2% Romanian 2%
- Foreign-born
- 3% · Canada
- Languages at home
- 91% English-only · Spanish 6% French/Haitian/Cajun 2%
Political lean MEDSL · Columbia
- 2024 margin
- Solid R (+50.2) · D 24.6% · R 74.7%
- 2008→2024 swing
- -16.4pp toward R · 2008: -33.8pp · 2024: -50.2pp
- All cycles
- 2024: R+50.2 2020: R+45.2 2016: R+44.5 2012: R+36.7 2008: R+33.8
Not yet ingested
- Civics
- —
Market trends
- HPI YoY
- ▲ 17.57%
- Current HPI
- 276.7253
- Rent YoY
- —
- Metro
- Lake City, FL
- State GDP YoY
- ▲ 3.28%
- F500 in state
- 36
Industry mix (Fortune 500 HQ in FL)
| Industry | F500 HQs | Revenue |
|---|---|---|
| Industrial Technology | 2 | $29B |
|
||
| Insurance | 2 | $17B |
|
||
| Retail | 1 | $60B |
|
||
| Technology Distribution | 1 | $58B |
|
||
| Homebuilding | 1 | $35B |
|
||
| Technology Manufacturing | 1 | $35B |
|
||
Price history
-96.2% since first listed12 events — show timeline
- 2026-03-02 Rental Removed $2,000 NFMLS
- 2026-03-01 Listed $284,900 NFMLS
- 2026-02-14 Listed for Rent $2,000 NFMLS
- 2024-01-28 Relisted — NFMLS
- 2024-01-28 Sold (MLS) $178,000 NFMLS
- 2024-01-08 Relisted — NFMLS
- 2023-09-12 Price Changed $160,000 NFMLS
- 2023-07-09 Relisted — NFMLS
- 2023-06-11 Contingent — NFMLS
- 2023-05-10 Listed $164,000 NFMLS
- 2015-06-29 Sold (Public Records) $52,000 Public Records
- 2015-06-17 Sold (MLS) $52,000 NFMLS
Property tax history
+7.8%/yrLatest (2025): $1,888 · -16.4% YoY. Source: county tax records.
Cash-flow waterfall
monthlySold comps — $/sqft
last 12 mo · ≤1 miLoading sold comps…