 Duplex
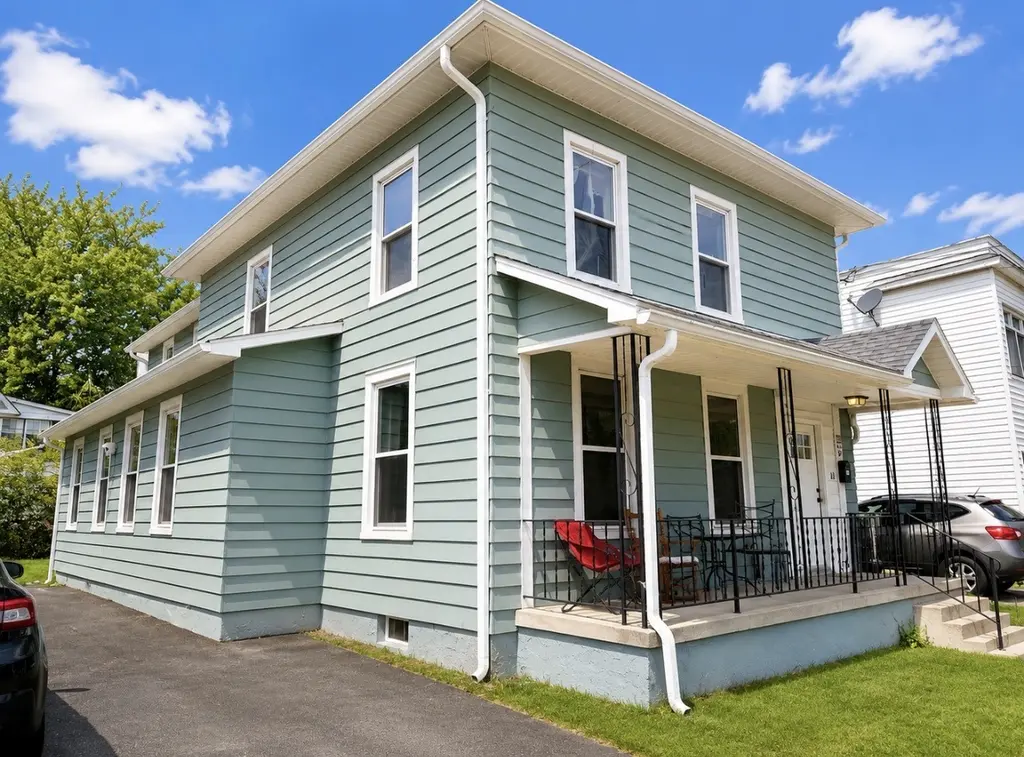
23 Stuyvesant St St · Binghamton, NY
Flood risk 1/10 · Minimal
- FEMA flood zone
- X
- Chance of flooding over 30 yrs
- 0.0%
- Est. flood insurance / yr
- $473 – $860
Fire risk 3/10 · Minor
- Est. fire insurance / yr
- $691 – $1,283
Heat risk 3/10 · Minor
- Hot days now (above 92°F)
- 8 days/yr
- Hot days in 30 yrs
- 17 days/yr
Wind risk 2/10 · Minimal
- Chance of severe wind over 30 yrs
- 1.0%
Air-quality risk 2/10 · Minimal
- Unhealthy air days now
- 0 days/yr
- Unhealthy air days in 30 yrs
- 1 days/yr
Risk factors via First Street. Map © Google.
Why this score? — see what drove the C grade
The composite is a weighted blend of 9 inputs, each scored 0–100. Each bar is that input's sub-score; the figure is the points it added to the 100-point composite (weight × sub-score).
- Cash flow +27.7/30.0
- DSCR +9.7/10.0
- 1% rule +7.9/10.0
- Livability +3.9/5.0
- Schools +3.0/10.0
- Rent growth +2.5/5.0
- Condition / age +2.5/5.0
- ARV discount +0.0/15.0
- Appreciation +0.0/10.0
$204,900
🖨 Deal sheet (PDF) 📄 Offer letter ✓ Due diligence
Multi-family units
County records classify this as Multi-Family (2-4 Unit). Listing-text estimate: 2 units. confirmed
Listing remarks MLS
Large 2 family home; could be a good money maker! Freddie Mac Foreclosure being sold CASH; as is. First look period first 20 days of listing - owner-occupy offers ONLY considered; expires 9/24/2015.
Key facts
- Strong rental demand
- Immediate income
- 3,484 sq ft lot
Tags
Property features AI
Finance
- Other: Above-grade finished area reported
- Financial info: Income property with listed rent: $2,600 (unit)
Exterior
- Parking: Driveway parking; On-street parking
- Utilities: Public water; Public sewer
- Home design: Duplex (residential income property); Level lot; Zoned R-3
- Construction: Aluminum siding; Has basement
- Exterior features: Covered porch; Screened porch; Patio
Interior
- Kitchen: Range; Refrigerator; Gas water heater
- Bedrooms: 4 bedrooms
- Flooring: Hardwood floors
- Bathrooms: 2 full bathrooms
- Heating & cooling: Baseboard heating; No central cooling
- Interior features: Washer and dryer included; Gas water heater; Range; Refrigerator
- Laundry & utility: Washer; Dryer
Neighborhood map
What this means for you Summary
Snapshot
- This is a 2 × 2-bed/1.0-bath units multifamily listed at $205k.
Deal economics
- At list price, monthly cash flow is $616 ($7k/yr) — positive. Per door: $308/mo.
- The deal already cash-flows at list — no discount required.
- Meets the 1% rule at list price ($3k rent vs $205k).
- Recommended offer: $202k (1.5% below list) — sets the bar for market timing.
- Cap rate 9.9% vs local median 6.4% in Binghamton — top-decile yield for the area; either an underpriced asset or a hidden risk that comps aren't pricing in. Stress-test before assuming the spread holds.
Location & tenants
- Location reads 78/100 on livability (#174 in NY, #2,710 nationally) — a middle-class / working-renter tenant base. Strengths: amenities A+, commute A+, cost of living A+; Watch: crime F, employment F.
- Binghamton City School District (urban): math 30% / reading 44% proficiency, ranked #557 of 590 in NY (top 94%) — families likely to look elsewhere, expect single-tenant / working-renter base with shorter leases; 61% free/reduced lunch — lower-income household profile, screen leases tightly.
- Zoned schools: Macarthur School (math 17% / reading 37%, grade F, #1,786 of 2,108 statewide, top 86%, 398 students, 62% FRL); Binghamton High School (math 71% / reading 79%, grade A-, #631 of 1,100 statewide, top 58%, 1,341 students, 69% FRL) — zoned schools at 65% FRL track the district average.
- Zoned-school proficiency averages 51% at this address vs 37% district-wide (+14 pts) — the actual schools serving this property are materially stronger than the Binghamton City School District average implies; a family-tenant draw the district grade alone would hide.
- Market conditions: 92 active listings in the ZIP; 5 comparable units currently listed for rent nearby; rentals lingering (median 45d on market — plan ~5-8 weeks vacancy on turnover, expect pricing pressure); 60% of comp listings sitting > 30 days — soft ceiling on asking rent; 340 units permitted in Broome County in 2024 (269 in 5+ unit buildings).
Forward outlook
- Local home prices are declining (-3.0%/yr); year-one equity from $1k of loan paydown is wiped out by about $6k of value loss. Plan a longer hold.
- Broome County population projected at -13% by 2050 — secular population decline; favor cash flow + early exit over multi-decade hold.
- At projected returns (-3.0% appreciation + 3.0% rent growth), your $57k cash investment doubles in ~9 years — after that, you're playing with house money.
Negotiation context
- It's been on market 22 days — a 2% lower offer ($202k) is reasonable based on typical stale-listing flexibility.
- 2 sale attempts since 11y ago with the ask held roughly flat each time — persistent listings suggest the price (not the market) is what's stuck; bring a comps-based counter.
- Current owner paid $12k; list at $205k implies a 1539% gain — meaningful room to come down on a strong offer.
Risks & watch-outs
- Watch-outs: built in 1940 — expect roof / HVAC / electrical / plumbing capex.
Questions for the listing agent
- Can we see the unit-by-unit rent roll, current vacancy, and any below-market leases? What's the average tenancy length?
- What capital expenditures (roof, boiler, parking lot, exteriors) have been made in the last 5 years, and what's planned in the next 2?
- Built in 1940 — when were the roof, HVAC, electrical panel, plumbing, and water heater last replaced?
- Is there a deadline driving the sale (1031 exchange, divorce, estate, relocation)? That informs how much negotiation room exists.
- Schools are D-rated, which usually means shorter tenancies and higher turnover. Who's the typical renter profile here, and what's been the actual vacancy rate?
- Crime grade is F in this area — have there been break-ins, vandalism, or insurance claims at this property in the last 3 years? What carrier currently insures it and at what premium?
- What's the average days-on-market for RENTAL listings here right now (not sales)? A rising rental-DOM trend means longer vacancies and softer asking-rent achievability than the comps imply.
- What's the recent tenant-quality profile in this submarket — average credit score on applications, eviction rate, late-payment / NSF rate, and stable-employment percentage? A property-management company in the area should have these aggregated.
- How much new apartment / multifamily construction is in the pipeline within 1–3 miles? Heavy new supply (>2% of stock underway) typically softens rents 12–24 months out; light construction supports rent growth.
Investment metrics
- 1% rule
- 1.29% ✓
- Cap rate
- 9.90%
- Cash-on-cash
- 12.88%
- DSCR
- 1.57
- GRM
- 6.5
CMA / ARV
- ARV (on-the-fly)
- $163,674
- Comps found
- 12
Show comp detail 12 sales within ~0.75 mi
| Address | Dist | Beds/Ba | Sqft | Sold | Price | $/sf | Match |
|---|---|---|---|---|---|---|---|
| 14 Wales Ave | 0.49mi | 6/2.0 | 2,654 (+2%) | 1mo | $108,000 | $41 | 73 |
| 5 Mill St | 0.52mi | 6/2.0 | 2,485 (-4%) | 1mo | $220,000 | $89 | 68 |
| 233 Conklin Ave | 0.52mi | 6/2.0 | 2,576 (-1%) | 9mo | $163,000 | $63 | 67 |
| 23 Robinson St | 0.54mi | 7/4.0 (+1) | 2,612 (+0%) | 3mo | $90,000 | $34 | 58 |
| 231 Conklin Ave | 0.51mi | 6/2.0 | 2,432 (-6%) | 9mo | $163,000 | $67 | 58 |
| 196 Hawley St | 0.11mi | 6/2.0 | 2,984 (+15%) | 15mo | $127,000 | $43 | 57 |
| 192 Conklin Ave | 0.48mi | 6/2.0 | 2,253 (-13%) | 5mo | $115,000 | $51 | 52 |
| 28 Jackson St | 0.41mi | 5/2.0 (-1) | 2,208 (-15%) | 2mo | $100,000 | $45 | 49 |
| 121 Eldredge St | 0.46mi | 5/3.5 (-1) | 2,508 (-4%) | 16mo | $230,000 | $92 | 48 |
| 19 Mcnamara Ave | 0.67mi | 5/2.0 (-1) | 2,688 (+4%) | 13mo | $200,000 | $74 | 47 |
| 114 Conklin Ave | 0.46mi | 5/4.0 (-1) | 2,822 (+9%) | 10mo | $176,000 | $62 | 43 |
| 62 Conklin Ave | 0.58mi | 6/5.0 | 2,520 (-3%) | 16mo | $250,000 | $99 | 43 |
Match score weights: distance 35% · size 25% · config 20% · recency 20%. Top-matched comps best support the ARV.
Projected returns pro-forma
-3.0% appreciation · 3.0% rent growth · sell at horizon
- IRR
- 2.8%
- Equity multiple
- 1.11×
- Total profit
- $6,101
- Equity at exit
- $30,551
- IRR
- 12.4%
- Equity multiple
- 1.98×
- Total profit
- $56,119
- Equity at exit
- $17,716
Cash invested: $57,372 (down + closing). Projections, not guarantees.
Landlord ↔ Tenant lean methodology
- Overall (STATE)
- 15 Strongly Tenant-Friendly
- State New York
- 15 Strongly Tenant-Friendly · D+10
- County
- — inherits STATE
- City
- — inherits STATE
ZIP-level market 13901
- Home prices YoY
- -5.1%
- Active inventory
- 92
- Price-to-rent
- 13.0×
Monthly cashflow live
- Estimated rent
- $2,636 high interval (Pro) →
- Mortgage (P&I)
- −$1,075
- Tax from tax record
- −$307 /mo · $3,679/yr
- Insurance
- −$85
- HOA
- −$0
- Vacancy / Maint / Mgmt
- −$554
- Net cashflow
- $616
Break-even live
Sensitivity live
| Price | -10% $732 | -5% $674 | +0% $616 | +5% $558 | +10% $500 |
|---|---|---|---|---|---|
| Rent | -10% $408 | -5% $512 | +0% $616 | +5% $720 | +10% $824 |
| Rate | -1.0pp $719 | -0.5pp $668 | base $616 | +0.5pp $563 | +1.0pp $509 |
2-unit breakdown (identical units grouped — click to expand)
| Units | Beds | Baths | Est. rent |
|---|---|---|---|
| 2× units | 2 | 1 | $2,636 |
| #1 | 2 | 1 | $1,318 |
| #2 | 2 | 1 | $1,318 |
| Total (2 units) | $2,636 | ||
UW: 25.0% down · 7.5% · 30yr · 1.5% tax · 5.0% vac · 8.0% maint · 8.0% mgmt
Financing live
Cash to close
- Down payment
- $51,225
- Closing costs
- $6,147
- Reserves months
- —
- Total cash needed
- —
Loan-product check · same deal, 3 products live
Conventional
25% down · 7.5% · 30yr
- Down + closing
- —
- Monthly P&I
- —
- Monthly cashflow
- —
- DSCR
- —
- Eligible?
- —
Personal DTI + credit; lowest rate.
DSCR
20% down · 8.5% · 30yr
- Down + closing
- —
- Monthly P&I
- —
- Monthly cashflow
- —
- DSCR
- —
- Eligible?
- —
No personal income docs; deal must DSCR.
Hard money
10% down · 12.0% · 12mo
- Down + closing
- —
- Monthly P&I
- —
- Monthly cashflow
- —
- DSCR
- —
- Eligible?
- —
Short-term bridge; refi at stabilization.
Rent comps 5 comps
| Address | Beds | Baths | Sqft | Rent | $/sqft | DOM | Units | Dist |
|---|---|---|---|---|---|---|---|---|
| 90 Conklin Ave Binghamton, NY | 5.0 | 2.0 | 2000 | $575 | $0.29 | 15d | 1 | 0.47mi |
| 16 North St Unit 1-1 Binghamton, NY | 5.0 | 2.0 | 2600 | $650 | $0.25 | 45d | 1 | 0.88mi |
| 2 Chapel Pl Binghamton, NY | 6.0 | 3.0 | 2600 | $650 | $0.25 | 45d | 1 | 0.93mi |
| 44 Leroy St Binghamton, NY | 6.0 | 2.0 | 1772 | $3,000 | $1.69 | 22d | 1 | 1.06mi |
| 19 Edwards St Binghamton, NY | 7.0 | 3.0 | 2989 | $600 | $0.20 | 45d | 1 | 1.20mi |
Listing history 17 events
-
2026-06-21days on market $204,900 Active 22 DOM
-
2026-06-19days on market $204,900 Active 20 DOM
-
2026-06-18days on market $204,900 Active 19 DOM
-
2026-06-17days on market $204,900 Active 18 DOM
-
2026-06-16days on market $204,900 Active 17 DOM
-
2026-06-15days on market $204,900 Active 16 DOM
-
2026-06-14days on market $204,900 Active 14 DOM
-
2026-06-13days on market $204,900 Active 13 DOM
-
2026-06-10days on market $204,900 Active 11 DOM
-
2026-06-09days on market $204,900 Active 10 DOM
-
2026-06-08days on market $204,900 Active 9 DOM
-
2026-06-07days on market $204,900 Active 8 DOM
-
2026-06-03days on market $204,900 Active 4 DOM
-
2026-06-02days on market $204,900 Active 3 DOM
-
2026-06-01days on market $204,900 Active 2 DOM
-
2026-05-30remarks 699-char remark
-
2026-05-30$204,900 Active 1 DOM
ⓘ Source: listings_history table (triggers on properties + properties_extension) + one-shot
backfill from property_details.listing_events for pre-trigger history.
Tax reassessment forecast NY · Partial reset (capped growth)
- Current annual tax
- $3,679 · $307/mo
- Projected year-2 tax
- $3,679 · $307/mo
- Expected delta
- $0/yr ($0/mo · 0.0%)
ⓘ Screening estimate from a state-policy table — verify with the county assessor before closing.
Climate risk First Street
- Flood 1/10 Low FEMA zone X · 0% chance over 30 yrs
- Wildfire 3/10 Moderate
- Heat 3/10 Moderate 8 d/yr ≥92°F today · 17 d/yr by 30 yrs out
- Wind 2/10 Low 100% chance of damaging wind over 30 yrs
- Air quality 2/10 Low 0 unhealthy d/yr today · 1 by 30 yrs out
Nearby sold comps map
Loading sold comps map…
Walkable amenities ~0.75 mi
Loading nearby amenities…
Taxation est. · year 1
- Rental income
- $31,632
- − Mortgage interest
- −$11,478
- − Property taxes
- −$3,679
- − Insurance
- −$1,024
- − Repairs & maintenance
- −$2,531
- − Management
- −$2,531
- − Depreciation
- −$5,961
- Taxable income
- $4,429
- Est. tax owed @ 24.0%
- −$1,063
- After-tax cash flow
- $6,329/yr
For passive investors: Depreciation is non-cash, so a rental often shows a tax loss while cash-flowing — sheltering income. Rental losses are passive: they offset passive income freely, and up to $25,000/yr can offset ordinary (W-2) income if you actively participate and your MAGI is under $100k (phasing out to $0 by $150k); unused losses carry forward. On sale, claimed depreciation is recaptured at up to 25%, and gains may owe capital-gains tax (a 1031 exchange can defer both). Figures are a year-1 estimate at your 24.0% rate — not tax advice; consult a CPA.
Schools (NCES district)
- District
- Binghamton City School District
- NCES district ID
- 3604870
- Math proficiency
- 30% ▬ 0.00%
- Reading proficiency
- 44% ▲ 15.00%
- Median HH income
- $30,475
- Composite
- 30.09/100
- National rank
- #6342
- State rank
- #557 of 590 in NY
Livability — Binghamton
- Score
- 78/100
- State rank
- #174
- US rank
- #2710
Category grades
Schools grade is shown separately in the Schools card above.
Census & demographics
- Census place
- Binghamton, NY
- County
- Broome County · 126,805 people
- City population
- 65,170
- Metro
- Binghamton, NY
- Population (ZIP)
- 19,613
- Household income
- $55,523
- Rent vs Own
- Severe rent burden
- 1230.0
Population outlook (Broome County) Hauer SSP2
- Today (2025)
- 187,989 people
- By 2030
- 183,066 · -2.6%
- By 2040
- 172,228 · -8.4%
- By 2050
- 163,161 · -13.2%
- By 2075
- 153,641 · -18.3%
- By 2100
- 140,851 · -25.1%
Race, ethnicity, and origin ACS 2023
- Neighborhood character
- Predominantly White (80%)
- Race & ethnicity
- White 80% Two or more races 7% Hispanic / Latino 7% Black 5% Asian 2%
- Hispanic origin (detail)
- Puerto Rican 3%
- Common ancestry
- Romanian 6% Lithuanian 1% Italian 1%
- Foreign-born
- 5% · Canada, Jamaica
- Languages at home
- 93% English-only · Spanish 3% Russian/Polish/Slavic 1% Other Indo-European 1%
Political lean MEDSL · Broome
- 2024 margin
- Toss-up / Even · D 50.2% · R 49.8%
- 2008→2024 swing
- -7.6pp toward R · 2008: 8.0pp · 2024: 0.4pp
- All cycles
- 2024: D+0.4 2020: D+3.5 2016: R+3.7 2012: D+4.6 2008: D+8.0
Not yet ingested
- Civics
- —
Market trends
- HPI YoY
- ▼ -16.13%
- Current HPI
- 300.7692
- Rent YoY
- —
- Metro
- Binghamton, NY
- State GDP YoY
- ▲ 2.60%
- F500 in state
- 92
Industry mix (Fortune 500 HQ in NY)
| Industry | F500 HQs | Revenue |
|---|---|---|
| Financial Services | 10 | $950B |
|
||
| Consumer Goods | 9 | $162B |
|
||
| Insurance | 4 | $225B |
|
||
| Telecommunications | 2 | $144B |
|
||
| Pharmaceuticals | 2 | $112B |
|
||
| Media / Entertainment | 2 | $69B |
|
||
Price history
+260.0% since first listed4 events — show timeline
- 2026-05-30 Listed $204,900 GBAOR
- 2015-12-15 Sold (MLS) $12,500 GBAOR
- 2015-09-14 Listed $14,900 GBAOR
- 2007-05-07 Sold (Public Records) $56,914 Public Records
Property tax history
+2.4%/yrLatest (2025): $3,679 · +0.9% YoY. Source: county tax records.
Cash-flow waterfall
monthlySold comps — $/sqft
last 12 mo · ≤1 miLoading sold comps…