 🏷️ Likely Rental
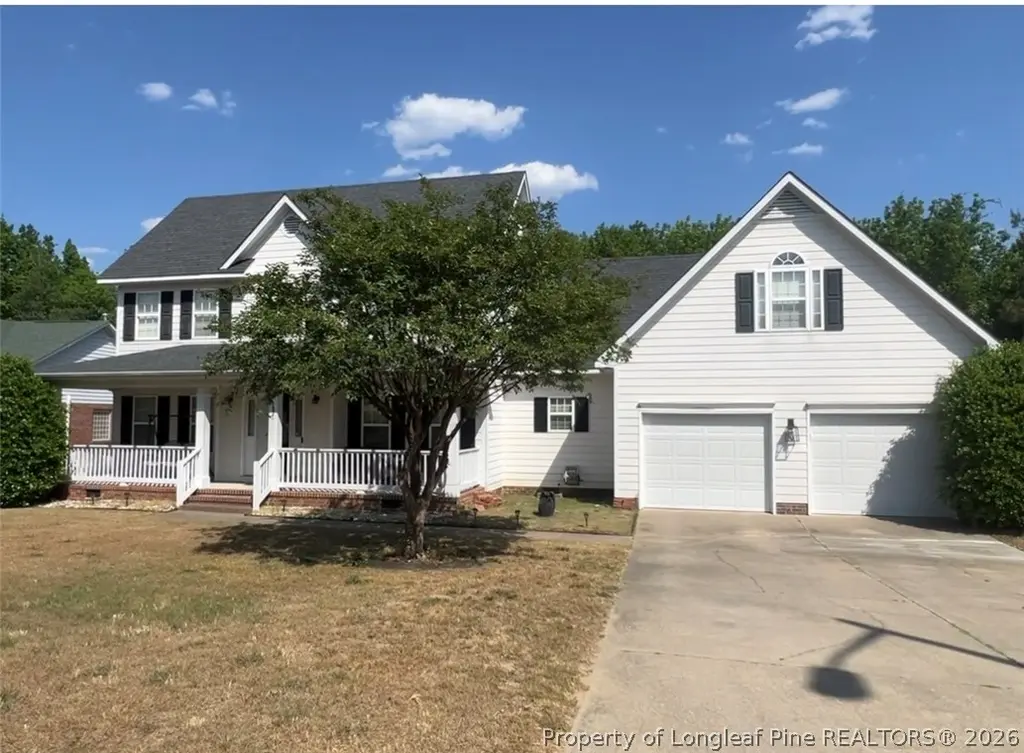
1921 Ashridge Dr · Fayetteville, NC
Flood risk 1/10 · Minimal
- FEMA flood zone
- X (unshaded)
- Chance of flooding over 30 yrs
- 0.0%
- Est. flood insurance / yr
- $507 – $1,088
Fire risk 4/10 · Minor
- Est. fire insurance / yr
- $906 – $1,684
Heat risk 8/10 · Major
- Hot days now (above 107°F)
- 7 days/yr
- Hot days in 30 yrs
- 16 days/yr
Wind risk 7/10 · Major
- Chance of severe wind over 30 yrs
- 78.0%
Air-quality risk 1/10 · Minimal
- Unhealthy air days now
- 0 days/yr
- Unhealthy air days in 30 yrs
- 0 days/yr
Risk factors via First Street. Map © Google.
Why this score? — see what drove the D+ grade
The composite is a weighted blend of 9 inputs, each scored 0–100. Each bar is that input's sub-score; the figure is the points it added to the 100-point composite (weight × sub-score).
- ARV discount +15.0/15.0
- Cash flow +13.0/30.0
- DSCR +3.9/10.0
- Livability +3.8/5.0
- 1% rule +3.3/10.0
- Rent growth +3.3/5.0
- Schools +3.1/10.0
- Condition / age +2.5/5.0
- Appreciation +0.0/10.0
$264,900
🖨 Deal sheet (PDF) 📄 Offer letter ✓ Due diligence
Listing remarks MLS
-Great 4 or 5 bedroom home in excellent conditon. Master down stairs w/jetted tub & sep/shower. Double vanity sinks & walk-in-closet, dining with hardwoods, Den w/fireplace and much more. Double garage w/AGDO. Privacy fenced & nice deck. Tenant occupied.
Key facts
- Eat-in dining area
- Formal dining room
- Glamour bath
Tags
Property features AI
Finance
- Other: Listed by Longleaf Pine Realtors / EXP REALTY LLC
Exterior
- Parking: Attached garage; 2 covered garage spaces (2-car garage)
- Utilities: Public water; Public sewer
- Home design: Single-family residence; Two levels / 2 stories
- Construction: Cement siding construction
- Exterior features: Subdivision: ASBURY; Zoned SF10 (Single Family Residential 10)
Interior
- Kitchen: Refrigerator
- Bedrooms: 9 total rooms (bedroom count not specified)
- Flooring: Carpet; Hardwood; Vinyl
- Bathrooms: 2 full bathrooms; 1 half bathroom
- Heating & cooling: Heat pump heating; Has heating
- Interior features: Refrigerator included; One fireplace (Other type)
Neighborhood map
What this means for you Summary
Snapshot
- This is a 4-bed/4.0-bath single-family listed at $265k.
Deal economics
- At list price, monthly cash flow is $-13 ($-159/yr) — negative.
- To cash-flow at today's rent, offer at most $263k (0.9% below list).
- To meet the 1% rule (rent ≥ 1% of price), the offer needs to be $221k (16.5% below list).
- Recommended offer: $221k (16.5% below list) — sets the bar for 1% rule.
- Cap rate 6.2% vs local median 4.8% in Fayetteville — meaningfully above typical; check what's discounted (condition, days-on-market, listing class) to confirm the premium yield is real.
Location & tenants
- Location reads 75/100 on livability (#45 in NC, #4,031 nationally) — a middle-class / working-renter tenant base. Strengths: commute A+, cost of living A+, housing A+; Watch: crime F, employment D-.
- Cumberland County Schools (urban): math 32% / reading 41% proficiency, ranked #126 of 178 in NC (top 71%) — families likely to look elsewhere, expect single-tenant / working-renter base with shorter leases.
- Zoned schools: Loyd E Auman Elementary (math 15% / reading 29%, grade F, #1,190 of 1,410 statewide, top 86%, 528 students, 99% FRL); Lewis Chapel Middle (math 15% / reading 27%, grade F, #424 of 475 statewide, top 90%, 578 students, 100% FRL); Seventy-First High (math 45% / reading 44%, grade F, #352 of 535 statewide, top 68%, 1,366 students, 70% FRL) — zoned schools average 90% FRL vs 55% district-wide (35 pts higher); higher-poverty schools than district average — tighter screening recommended.
- Market conditions: Rents rising (+3.2%/yr); 308 active listings in the ZIP; 5 comparable units currently listed for rent nearby; rentals at typical pace (median 25d on market — plan ~3-4 weeks tenant-placement turnaround); 1,125 units permitted in Cumberland County in 2024 (104 in 5+ unit buildings).
- At $2,211/mo this rent would consume 45% of the median local household income ($59k/yr) (locally 1667% of renters already pay >50% of income on rent) — very limited rent-growth headroom before tenants either downsize or default.
Forward outlook
- Local home prices are declining (-3.0%/yr); year-one equity from $2k of loan paydown is wiped out by about $8k of value loss. Plan a longer hold.
Negotiation context
- It's been on market 44 days — a 3% lower offer ($257k) is reasonable based on typical stale-listing flexibility.
- 2 sale attempts since 16y ago with the ask held roughly flat each time — persistent listings suggest the price (not the market) is what's stuck; bring a comps-based counter.
- Current owner paid $197k; 34% above their basis — modest negotiation headroom, anchor on the comps not their cost.
Risks & watch-outs
- Climate carrying-cost: major wind risk, 78% chance of damaging wind over 30y; extreme-heat days projected 7→16/yr by 2055 (HVAC capex compounding) — expect insurance premiums to compound above CPI over the hold.
Questions for the listing agent
- What do current leases actually rent for vs. the listed asking? Can we see a recent rent roll and the last 12 months of T-12 income?
- It's been on market 44 days. Have you received any prior offers? Is the seller open to a 17% concession, seller financing, or rate buy-down credit?
- Is there a deadline driving the sale (1031 exchange, divorce, estate, relocation)? That informs how much negotiation room exists.
- Crime grade is F in this area — have there been break-ins, vandalism, or insurance claims at this property in the last 3 years? What carrier currently insures it and at what premium?
- The area grade is low — what's the realistic commute time and amenity access for the typical tenant pool here? Any planned neighborhood developments (good or bad) we should know about?
- What's the average days-on-market for RENTAL listings here right now (not sales)? A rising rental-DOM trend means longer vacancies and softer asking-rent achievability than the comps imply.
- What's the recent tenant-quality profile in this submarket — average credit score on applications, eviction rate, late-payment / NSF rate, and stable-employment percentage? A property-management company in the area should have these aggregated.
- How much new for-sale + rental construction is in the pipeline within 1–3 miles? Heavy new supply typically softens prices + rents 12–24 months out; constrained supply supports both.
Investment metrics
- 1% rule
- 0.83% ✗
- Cap rate
- 6.23%
- Cash-on-cash
- -0.21%
- DSCR
- 0.99
- GRM
- 10.0
CMA / ARV
- ARV (on-the-fly)
- $336,540
- Comps found
- 12
Show comp detail 12 sales within ~0.75 mi
| Address | Dist | Beds/Ba | Sqft | Sold | Price | $/sf | Match |
|---|---|---|---|---|---|---|---|
| 7202 Manassas St | 0.39mi | 4/3.0 | 2,365 (-0%) | 6mo | $370,990 | $157 | 72 |
| 7194 Manassas St | 0.39mi | 4/3.5 | 2,539 (+7%) | 2mo | $400,000 | $158 | 67 |
| 6711 Carloway Dr | 0.07mi | 3/2.5 (-1) | 2,145 (-10%) | 5mo | $315,000 | $147 | 66 |
| 7198 Manassas St | 0.39mi | 4/3.5 | 2,525 (+6%) | 5mo | $399,990 | $158 | 64 |
| 6601 Kodiak Dr | 0.53mi | 3/2.5 (-1) | 2,447 (+3%) | 3mo | $327,000 | $134 | 57 |
| 1959 Oakview Dr | 0.59mi | 4/2.5 | 2,430 (+2%) | 11mo | $315,000 | $130 | 53 |
| 1519 Deanscroft Pl | 0.72mi | 4/3.0 | 2,391 (+1%) | 10mo | $350,000 | $146 | 53 |
| 6434 Kincross Ave | 0.63mi | 4/3.0 | 2,167 (-9%) | 1mo | $249,900 | $115 | 51 |
| 7504 Coleridge Dr | 0.73mi | 4/3.0 | 2,499 (+5%) | 2mo | $330,000 | $132 | 51 |
| 6664 Kodiak Dr | 0.69mi | 4/2.5 | 2,438 (+3%) | 9mo | $345,000 | $142 | 49 |
| 2008 Greendale Dr | 0.62mi | 4/2.5 | 2,492 (+5%) | 10mo | $340,000 | $136 | 48 |
| 1968 Oakview Dr | 0.63mi | 3/2.5 (-1) | 2,149 (-9%) | 8mo | $290,000 | $135 | 37 |
Match score weights: distance 35% · size 25% · config 20% · recency 20%. Top-matched comps best support the ARV.
Projected returns pro-forma
-3.0% appreciation · 3.17% rent growth · sell at horizon
- IRR
- -16.5%
- Equity multiple
- 0.41×
- Total profit
- $-43,402
- Equity at exit
- $39,497
- IRR
- -8.0%
- Equity multiple
- 0.50×
- Total profit
- $-37,363
- Equity at exit
- $22,904
Cash invested: $74,172 (down + closing). Projections, not guarantees.
Landlord ↔ Tenant lean methodology
- Overall (STATE)
- 85 Strongly Landlord-Friendly
- State North Carolina
- 85 Strongly Landlord-Friendly · R+3
- County
- — inherits STATE
- City
- — inherits STATE
ZIP-level market 28304
- Home prices YoY
- -21.7%
- Rents YoY
- 3.2%
- Active inventory
- 308
- Price-to-rent
- 10.0×
Monthly cashflow live
- Estimated rent
- $2,211 high interval (Pro) →
- Mortgage (P&I)
- −$1,389
- Tax from tax record
- −$261 /mo · $3,130/yr
- Insurance
- −$110
- HOA
- −$0
- Vacancy / Maint / Mgmt
- −$464
- Net cashflow
- $-13
Break-even live
Sensitivity live
| Price | -10% $137 | -5% $62 | +0% $-13 | +5% $-88 | +10% $-163 |
|---|---|---|---|---|---|
| Rent | -10% $-188 | -5% $-101 | +0% $-13 | +5% $74 | +10% $161 |
| Rate | -1.0pp $120 | -0.5pp $54 | base $-13 | +0.5pp $-82 | +1.0pp $-152 |
UW: 25.0% down · 7.5% · 30yr · 1.5% tax · 5.0% vac · 8.0% maint · 8.0% mgmt
Financing live
Cash to close
- Down payment
- $66,225
- Closing costs
- $7,947
- Reserves months
- —
- Total cash needed
- —
Loan-product check · same deal, 3 products live
Conventional
25% down · 7.5% · 30yr
- Down + closing
- —
- Monthly P&I
- —
- Monthly cashflow
- —
- DSCR
- —
- Eligible?
- —
Personal DTI + credit; lowest rate.
DSCR
20% down · 8.5% · 30yr
- Down + closing
- —
- Monthly P&I
- —
- Monthly cashflow
- —
- DSCR
- —
- Eligible?
- —
No personal income docs; deal must DSCR.
Hard money
10% down · 12.0% · 12mo
- Down + closing
- —
- Monthly P&I
- —
- Monthly cashflow
- —
- DSCR
- —
- Eligible?
- —
Short-term bridge; refi at stabilization.
Rent comps 5 comps
| Address | Beds | Baths | Sqft | Rent | $/sqft | DOM | Units | Dist |
|---|---|---|---|---|---|---|---|---|
| 1941 Abbeydale Ln Fayetteville, NC | 4.0 | 3.0 | 2408 | $2,300 | $0.96 | 25d | 1 | 0.15mi |
| 6604 Kodiak Dr Fayetteville, NC | 4.0 | 2.5 | 2375 | $2,400 | $1.01 | 25d | 1 | 0.54mi |
| 1183 Helmsley Dr Fayetteville, NC | 3.0 | 2.5 | 1978 | $2,000 | $1.01 | 15d | 1 | 0.89mi |
| 1890 Frankie Ave Fayetteville, NC | 4.0 | 2.5 | 2107 | $2,200 | $1.04 | 25d | 1 | 1.34mi |
| 5812 Shenandoah Dr Fayetteville, NC | 4.0 | 2.0 | 1800 | $1,599 | $0.89 | 25d | 1 | 1.45mi |
Listing history 20 events
-
2026-06-21days on market $264,900 Active 44 DOM
-
2026-06-18days on market $264,900 Active 41 DOM
-
2026-06-17days on market $264,900 Active 40 DOM
-
2026-06-16days on market $264,900 Active 39 DOM
-
2026-06-15days on market $264,900 Active 38 DOM
-
2026-06-14days on market $264,900 Active 36 DOM
-
2026-06-13days on market $264,900 Active 35 DOM
-
2026-06-10days on market $264,900 Active 33 DOM
-
2026-06-09days on market $264,900 Active 32 DOM
-
2026-06-08days on market $264,900 Active 31 DOM
-
2026-06-07days on market $264,900 Active 30 DOM
-
2026-06-03days on market $264,900 Active 26 DOM
-
2026-06-02days on market $264,900 Active 25 DOM
-
2026-06-01days on market $264,900 Active 24 DOM
-
2026-05-31days on market $264,900 Active 23 DOM
-
2026-05-30days on market $264,900 Active 22 DOM
-
2026-05-08$264,900 Active
-
2011-07-01soldstatus $197,000
-
2011-06-30soldstatus $197,000 266-char remark
Show marketing remark (266 chars)
-Great 4 or 5 bedroom home in excellent conditon. Master down stairs w/jetted tub & sep/shower. Double vanity sinks & walk-in-closet, dining with hardwoods, Den w/fireplace and much more. Double garage w/AGDO. Privacy fenced & nice deck. Tenant occupied.
-
2010-09-17$199,900 266-char remark
Show marketing remark (266 chars)
-Great 4 or 5 bedroom home in excellent conditon. Master down stairs w/jetted tub & sep/shower. Double vanity sinks & walk-in-closet, dining with hardwoods, Den w/fireplace and much more. Double garage w/AGDO. Privacy fenced & nice deck. Tenant occupied.
ⓘ Source: listings_history table (triggers on properties + properties_extension) + one-shot
backfill from property_details.listing_events for pre-trigger history.
Tax reassessment forecast NC · Resets to sale price
- Current annual tax
- $3,130 · $261/mo
- Projected year-2 tax
- $3,130 · $261/mo
- Expected delta
- $0/yr ($0/mo · 0.0%)
ⓘ Screening estimate from a state-policy table — verify with the county assessor before closing.
Climate risk First Street
- Flood 1/10 Low FEMA zone X (unshaded) · 0% chance over 30 yrs
- Wildfire 4/10 Moderate
- Heat 8/10 Severe 7 d/yr ≥107°F today · 16 d/yr by 30 yrs out
- Wind 7/10 Severe 78% chance of damaging wind over 30 yrs
- Air quality 1/10 Low 0 unhealthy d/yr today · 0 by 30 yrs out
Nearby sold comps map
Loading sold comps map…
Walkable amenities ~0.75 mi
Loading nearby amenities…
Taxation est. · year 1
- Rental income
- $26,538
- − Mortgage interest
- −$14,839
- − Property taxes
- −$3,130
- − Insurance
- −$1,324
- − Repairs & maintenance
- −$2,123
- − Management
- −$2,123
- − Depreciation
- −$7,706
- Taxable loss
- −$4,707
- Est. tax savings @ 24.0%
- +$1,130
- After-tax cash flow
- $970/yr
For passive investors: Depreciation is non-cash, so a rental often shows a tax loss while cash-flowing — sheltering income. Rental losses are passive: they offset passive income freely, and up to $25,000/yr can offset ordinary (W-2) income if you actively participate and your MAGI is under $100k (phasing out to $0 by $150k); unused losses carry forward. On sale, claimed depreciation is recaptured at up to 25%, and gains may owe capital-gains tax (a 1031 exchange can defer both). Figures are a year-1 estimate at your 24.0% rate — not tax advice; consult a CPA.
Schools (NCES district)
- District
- Cumberland County Schools
- NCES district ID
- 3700011
- Math proficiency
- 32% ▼ -2.00%
- Reading proficiency
- 41% ▼ -1.00%
- Median HH income
- $44,168
- Composite
- 31.0/100
- National rank
- #6096
- State rank
- #126 of 178 in NC
Livability — Fayetteville
- Score
- 75/100
- State rank
- #45
- US rank
- #4031
Category grades
Schools grade is shown separately in the Schools card above.
Census & demographics
- Census place
- Fayetteville, NC
- County
- Cumberland County · 265,314 people
- City population
- 226,118
- Metro
- Fayetteville, NC
- Population (ZIP)
- 37,140
- Household income
- $58,563
- Rent vs Own
- Severe rent burden
- 1667.0
Population outlook (Cumberland County) Hauer SSP2
- Today (2025)
- 330,855 people
- By 2030
- 333,523 · +0.8%
- By 2040
- 335,583 · +1.4%
- By 2050
- 335,325 · +1.4%
- By 2075
- 342,853 · +3.6%
- By 2100
- 340,698 · +3.0%
Race, ethnicity, and origin ACS 2023
- Neighborhood character
- Highly diverse neighborhood (Simpson 0.70)
- Race & ethnicity
- Black 39% White 36% Hispanic / Latino 14% Two or more races 12% Asian 3% Native American 1%
- Hispanic origin (detail)
- Mexican 5% Puerto Rican 5%
- Common ancestry
- Slovak 2% Italian 1% Serbian 1%
- Foreign-born
- 8% · Canada, South Korea, Vietnam
- Languages at home
- 87% English-only · Spanish 9% Tagalog/Filipino 1% French/Haitian/Cajun 1%
Political lean MEDSL · Cumberland
- 2024 margin
- D (+13.4) · D 56.1% · R 42.7% · Other 1.2%
- 2008→2024 swing
- -4.3pp toward R · 2008: 17.7pp · 2024: 13.4pp
- All cycles
- 2024: D+13.4 2020: D+16.6 2016: D+16.0 2012: D+19.7 2008: D+17.7
Not yet ingested
- Civics
- —
Market trends
- HPI YoY
- ▼ -59.90%
- Current HPI
- 215.927
- Rent YoY
- ▲ 3.17%
- Metro
- Fayetteville, NC
- State GDP YoY
- ▲ 3.28%
- F500 in state
- 26
Industry mix (Fortune 500 HQ in NC)
| Industry | F500 HQs | Revenue |
|---|---|---|
| Financial Services | 2 | $213B |
|
||
| Retail | 2 | $95B |
|
||
| Industrial Conglomerate | 1 | $38B |
|
||
| Metals / Steel | 1 | $35B |
|
||
| Utilities | 1 | $30B |
|
||
| Industrial Machinery | 1 | $19B |
|
||
Price history
+32.5% since first listed4 events — show timeline
- 2026-05-08 Listed $264,900 LPRMLS
- 2011-07-01 Sold (Public Records) $197,000 Public Records
- 2011-06-30 Sold (MLS) $197,000 TMLS
- 2010-09-17 Listed $199,900 TMLS
Property tax history
+0.6%/yrLatest (2025): $3,130 · +21.1% YoY. Source: county tax records.
Cash-flow waterfall
monthlySold comps — $/sqft
last 12 mo · ≤1 miLoading sold comps…