3804 Deer Haven Dr · Radcliff, KY
Flood risk 1/10 · Minimal
- FEMA flood zone
- X (unshaded)
- Chance of flooding over 30 yrs
- 0.0%
- Est. flood insurance / yr
- $507 – $1,088
Fire risk 4/10 · Minor
- Est. fire insurance / yr
- $839 – $1,559
Heat risk 4/10 · Minor
- Hot days now (above 104°F)
- 7 days/yr
- Hot days in 30 yrs
- 19 days/yr
Wind risk 2/10 · Minimal
- Chance of severe wind over 30 yrs
- 1.0%
Air-quality risk 2/10 · Minimal
- Unhealthy air days now
- 0 days/yr
- Unhealthy air days in 30 yrs
- 2 days/yr
Risk factors via First Street. Map © Google.
Why this score? — see what drove the C grade
The composite is a weighted blend of 9 inputs, each scored 0–100. Each bar is that input's sub-score; the figure is the points it added to the 100-point composite (weight × sub-score).
- Cash flow +20.3/30.0
- ARV discount +15.0/15.0
- DSCR +6.5/10.0
- 1% rule +4.1/10.0
- Rent growth +3.3/5.0
- Schools +3.2/10.0
- Livability +3.1/5.0
- Condition / age +2.5/5.0
- Appreciation +0.0/10.0
$185,000
🖨 Deal sheet (PDF) 📄 Offer letter ✓ Due diligence
Listing remarks MLS
Property sold as is; proof of funds/preapproval letter with all offers; response to offers may take several days; sq ft not warranted; buyer responsible for verifying all utilities.
Key facts
- Large closet
- Sliding barn door
- Split floor plan
Tags
Property features AI
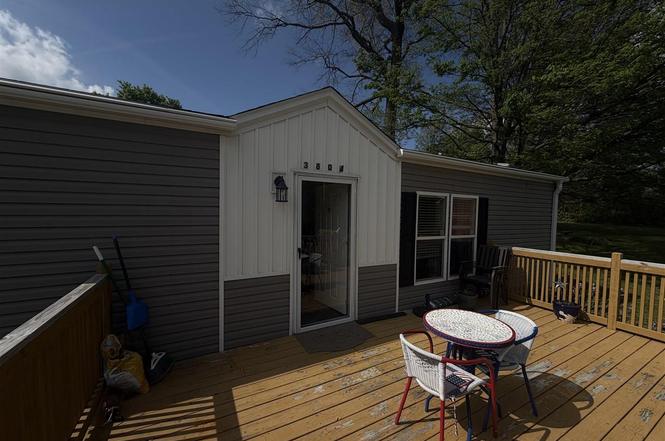
Exterior
- Parking: Gravel parking
- Security: Smoke detector(s)
- Utilities: Public sewer
- Home design: Manufactured single-family home; Residential property; Subdivision: Deerhaven Estates
- Construction: Vinyl siding; Shingle roof
- Exterior features: Deck; Porch; Storm door(s)
Interior
- Kitchen: Dishwasher; Disposal; Range; Oven; Refrigerator; Freezer; Pantry; Eat-in kitchen
- Bedrooms: Bedrooms info not specified
- Flooring: Laminate
- Bathrooms: 2 full bathrooms (both on the main level)
- Heating & cooling: Electric heating; Central air; Ceiling fan(s)
- Interior features: Walk-in closet(s); Eat-in kitchen; Pantry; Storm windows; Smoke detector(s); Accessible entrance; Accessible full bath
- Laundry & utility: Laundry room with washer and dryer; Electric water heater
Neighborhood map
What this means for you Summary
Snapshot
- This is a 3-bed/1.5-bath single-family listed at $185k.
Deal economics
- At list price, monthly cash flow is $238 ($3k/yr) — positive.
- The deal already cash-flows at list — no discount required.
- To meet the 1% rule (rent ≥ 1% of price), the offer needs to be $169k (8.8% below list).
- Recommended offer: $163k (12.0% below list) — sets the bar for market timing.
- Cap rate 7.8% vs local median 3.5% in Radcliff — top-decile yield for the area; either an underpriced asset or a hidden risk that comps aren't pricing in. Stress-test before assuming the spread holds.
Location & tenants
- Location reads 61/100 on livability (#367 in KY) — a middle-class / working-renter tenant base. Strengths: cost of living A+, housing A+, crime B; Watch: amenities F, commute F, employment F.
- Hardin County (suburban): math 30% / reading 43% proficiency, ranked #47 of 165 in KY (top 28%) — families likely to look elsewhere, expect single-tenant / working-renter base with shorter leases.
- Zoned schools: New Highland Elementary School (math 22% / reading 27%, grade F, #489 of 676 statewide, top 76%, 501 students, 62% FRL); Bluegrass Middle School (math 22% / reading 40%, grade F, #138 of 217 statewide, top 65%, 578 students, 52% FRL); John Hardin High School (math 27% / reading 42%, grade F, #76 of 254 statewide, top 34%, 790 students, 52% FRL).
- Market conditions: Rents rising (+3.3%/yr); 548 active listings in the ZIP; 946 units permitted in Hardin County in 2024 (464 in 5+ unit buildings).
Forward outlook
- Local home prices are declining (-3.0%/yr); year-one equity from $1k of loan paydown is wiped out by about $6k of value loss. Plan a longer hold.
- Hardin County population projected at -16% by 2050 — secular population decline; favor cash flow + early exit over multi-decade hold.
Negotiation context
- It's been on market 261 days — a 12% lower offer ($163k) is reasonable based on typical stale-listing flexibility.
- 4 sale attempts since 19y ago with the ask held roughly flat each time — persistent listings suggest the price (not the market) is what's stuck; bring a comps-based counter.
- Current owner paid $50k; list at $185k implies a 270% gain — meaningful room to come down on a strong offer.
Questions for the listing agent
- It's been on market 261 days. Have you received any prior offers? Is the seller open to a 12% concession, seller financing, or rate buy-down credit?
- Why hasn't it sold? Are there any deal-killer items the seller is aware of (foundation, flood, title, zoning, code violations)?
- Is there a deadline driving the sale (1031 exchange, divorce, estate, relocation)? That informs how much negotiation room exists.
- Schools are D-rated, which usually means shorter tenancies and higher turnover. Who's the typical renter profile here, and what's been the actual vacancy rate?
- What's the average days-on-market for RENTAL listings here right now (not sales)? A rising rental-DOM trend means longer vacancies and softer asking-rent achievability than the comps imply.
- What's the recent tenant-quality profile in this submarket — average credit score on applications, eviction rate, late-payment / NSF rate, and stable-employment percentage? A property-management company in the area should have these aggregated.
- How much new for-sale + rental construction is in the pipeline within 1–3 miles? Heavy new supply typically softens prices + rents 12–24 months out; constrained supply supports both.
Investment metrics
- 1% rule
- 0.91% ✗
- Cap rate
- 7.84%
- Cash-on-cash
- 5.51%
- DSCR
- 1.25
- GRM
- 9.1
CMA / ARV
- ARV (on-the-fly)
- $311,892
- Comps found
- 7
Show comp detail 7 sales within ~0.75 mi
| Address | Dist | Beds/Ba | Sqft | Sold | Price | $/sf | Match |
|---|---|---|---|---|---|---|---|
| 175 Shady Oaks Ct | 0.30mi | 4/2.0 (+1) | 1,980 (+0%) | 11mo | $438,500 | $221 | 69 |
| 106 Blenheim Blvd | 0.43mi | 3/2.5 | 1,920 (-3%) | 11mo | $309,000 | $161 | 62 |
| 101 Secluded Cir | 0.39mi | 3/2.5 | 2,150 (+9%) | 3mo | $475,000 | $221 | 61 |
| 298 Amy Ave | 0.68mi | 4/3.0 (+1) | 1,848 (-6%) | 13mo | $279,900 | $151 | 36 |
| 130 Westbourne Ct | 0.64mi | 4/2.5 (+1) | 1,812 (-8%) | 16mo | $210,000 | $116 | 34 |
| 132 Longsdale Ct | 0.65mi | 3/2.5 | 1,704 (-14%) | 15mo | $269,900 | $158 | 31 |
| 164 Portobello Rd | 0.68mi | 4/2.5 (+1) | 2,104 (+7%) | 22mo | $330,000 | $157 | 30 |
Match score weights: distance 35% · size 25% · config 20% · recency 20%. Top-matched comps best support the ARV.
Projected returns pro-forma
-3.0% appreciation · 3.32% rent growth · sell at horizon
- IRR
- -7.5%
- Equity multiple
- 0.72×
- Total profit
- $-14,360
- Equity at exit
- $27,584
- IRR
- 2.4%
- Equity multiple
- 1.17×
- Total profit
- $8,913
- Equity at exit
- $15,995
Cash invested: $51,800 (down + closing). Projections, not guarantees.
Landlord ↔ Tenant lean methodology
- Overall (STATE)
- 83 Strongly Landlord-Friendly
- State Kentucky
- 83 Strongly Landlord-Friendly · R+16
- County
- — inherits STATE
- City
- — inherits STATE
ZIP-level market 42701
- Home prices YoY
- -29.8%
- Rents YoY
- 3.3%
- Active inventory
- 548
- Price-to-rent
- 9.1×
Monthly cashflow live
- Estimated rent
- $1,687 medium interval (Pro) →
- Mortgage (P&I)
- −$970
- Tax from tax record
- −$48 /mo · $574/yr
- Insurance
- −$77
- HOA
- −$0
- Vacancy / Maint / Mgmt
- −$354
- Net cashflow
- $238
Break-even live
Sensitivity live
| Price | -10% $343 | -5% $290 | +0% $238 | +5% $186 | +10% $133 |
|---|---|---|---|---|---|
| Rent | -10% $105 | -5% $171 | +0% $238 | +5% $305 | +10% $371 |
| Rate | -1.0pp $331 | -0.5pp $285 | base $238 | +0.5pp $190 | +1.0pp $141 |
UW: 25.0% down · 7.5% · 30yr · 1.5% tax · 5.0% vac · 8.0% maint · 8.0% mgmt
Financing live
Cash to close
- Down payment
- $46,250
- Closing costs
- $5,550
- Reserves months
- —
- Total cash needed
- —
Loan-product check · same deal, 3 products live
Conventional
25% down · 7.5% · 30yr
- Down + closing
- —
- Monthly P&I
- —
- Monthly cashflow
- —
- DSCR
- —
- Eligible?
- —
Personal DTI + credit; lowest rate.
DSCR
20% down · 8.5% · 30yr
- Down + closing
- —
- Monthly P&I
- —
- Monthly cashflow
- —
- DSCR
- —
- Eligible?
- —
No personal income docs; deal must DSCR.
Hard money
10% down · 12.0% · 12mo
- Down + closing
- —
- Monthly P&I
- —
- Monthly cashflow
- —
- DSCR
- —
- Eligible?
- —
Short-term bridge; refi at stabilization.
Listing history 25 events
-
2026-06-22days on market $185,000 Active 261 DOM
-
2026-06-19days on market $185,000 Active 259 DOM
-
2026-06-18days on market $185,000 Active 258 DOM
-
2026-06-17days on market $185,000 Active 257 DOM
-
2026-06-16days on market $185,000 Active 256 DOM
-
2026-06-15days on market $185,000 Active 255 DOM
-
2026-06-14days on market $185,000 Active 253 DOM
-
2026-06-13days on market $185,000 Active 252 DOM
-
2026-06-10days on market $185,000 Active 250 DOM
-
2026-06-09days on market $185,000 Active 249 DOM
-
2026-06-08days on market $185,000 Active 248 DOM
-
2026-06-07days on market $185,000 Active 247 DOM
-
2026-06-03days on market $185,000 Active 243 DOM
-
2026-06-02days on market $185,000 Active 242 DOM
-
2026-06-01days on market $185,000 Active 241 DOM
-
2026-05-31days on market $185,000 Active 240 DOM
-
2026-05-30days on market $185,000 Active 239 DOM
-
2026-05-14price $185,000
-
2026-04-02status Active
-
2025-11-14price $189,000
-
2025-10-01$192,000 Active
-
2025-07-09historical
-
2025-01-08$194,900 Active
-
2007-09-14soldstatus $50,000 181-char remark
Show marketing remark (181 chars)
Property sold as is; proof of funds/preapproval letter with all offers; response to offers may take several days; sq ft not warranted; buyer responsible for verifying all utilities.
-
2007-06-11$53,500 181-char remark
Show marketing remark (181 chars)
Property sold as is; proof of funds/preapproval letter with all offers; response to offers may take several days; sq ft not warranted; buyer responsible for verifying all utilities.
ⓘ Source: listings_history table (triggers on properties + properties_extension) + one-shot
backfill from property_details.listing_events for pre-trigger history.
Tax reassessment forecast KY · Resets to sale price
- Current annual tax
- $574 · $48/mo
- Projected year-2 tax
- $1,591 · $133/mo
- Expected delta
- +$1,017/yr (+$85/mo · 177.1%)
ⓘ Screening estimate from a state-policy table — verify with the county assessor before closing.
Climate risk First Street
- Flood 1/10 Low FEMA zone X (unshaded) · 0% chance over 30 yrs
- Wildfire 4/10 Moderate
- Heat 4/10 Moderate 7 d/yr ≥104°F today · 19 d/yr by 30 yrs out
- Wind 2/10 Low 100% chance of damaging wind over 30 yrs
- Air quality 2/10 Low 0 unhealthy d/yr today · 2 by 30 yrs out
Nearby sold comps map
Loading sold comps map…
Walkable amenities ~0.75 mi
Loading nearby amenities…
Taxation est. · year 1
- Rental income
- $20,250
- − Mortgage interest
- −$10,363
- − Property taxes
- −$574
- − Insurance
- −$925
- − Repairs & maintenance
- −$1,620
- − Management
- −$1,620
- − Depreciation
- −$5,382
- Taxable loss
- −$234
- Est. tax savings @ 24.0%
- +$56
- After-tax cash flow
- $2,912/yr
For passive investors: Depreciation is non-cash, so a rental often shows a tax loss while cash-flowing — sheltering income. Rental losses are passive: they offset passive income freely, and up to $25,000/yr can offset ordinary (W-2) income if you actively participate and your MAGI is under $100k (phasing out to $0 by $150k); unused losses carry forward. On sale, claimed depreciation is recaptured at up to 25%, and gains may owe capital-gains tax (a 1031 exchange can defer both). Figures are a year-1 estimate at your 24.0% rate — not tax advice; consult a CPA.
Schools (NCES district)
- District
- Hardin County
- NCES district ID
- 2102490
- Math proficiency
- 30% ▼ -13.00%
- Reading proficiency
- 43% ▼ -10.00%
- Median HH income
- $50,728
- Composite
- 31.61/100
- National rank
- #5945
- State rank
- #47 of 165 in KY
Livability — Radcliff
- Score
- 61/100
- State rank
- #367
- US rank
- #17445
Category grades
Schools grade is shown separately in the Schools card above.
Census & demographics
- Census place
- Radcliff, KY
- County
- Hardin County · 77,611 people
- City population
- 23,624
- Metro
- Elizabethtown-Fort Knox, KY
- Population (ZIP)
- 53,987
- Household income
- $69,619
- Rent vs Own
- Severe rent burden
- 1663.0
Population outlook (Hardin County) Hauer SSP2
- Today (2025)
- 105,573 people
- By 2030
- 103,563 · -1.9%
- By 2040
- 97,077 · -8.0%
- By 2050
- 88,367 · -16.3%
- By 2075
- 65,405 · -38.0%
- By 2100
- 42,245 · -60.0%
Race, ethnicity, and origin ACS 2023
- Neighborhood character
- Predominantly White (79%)
- Race & ethnicity
- White 79% Black 9% Two or more races 6% Hispanic / Latino 5% Asian 2%
- Hispanic origin (detail)
- Mexican 3% Puerto Rican 1%
- Common ancestry
- Italian 3% Slovak 2% Romanian 2%
- Foreign-born
- 4% · Canada, South Korea
- Languages at home
- 94% English-only · Spanish 3% German/W. Germanic 1% Other Indo-European 1%
Political lean MEDSL · Hardin
- 2024 margin
- Strong R (+29.3) · D 34.5% · R 63.8% · Other 1.7%
- 2008→2024 swing
- -8.7pp toward R · 2008: -20.6pp · 2024: -29.3pp
- All cycles
- 2024: R+29.3 2020: R+24.0 2016: R+30.2 2012: R+20.8 2008: R+20.6
Not yet ingested
- Civics
- —
Market trends
- HPI YoY
- ▼ -96.94%
- Current HPI
- 228.7091
- Rent YoY
- ▲ 3.32%
- Metro
- Elizabethtown-Fort Knox, KY
- State GDP YoY
- ▲ 1.81%
- F500 in state
- 4
Industry mix (Fortune 500 HQ in KY)
| Industry | F500 HQs | Revenue |
|---|---|---|
| Healthcare | 1 | $118B |
|
||
| Food / Beverage | 1 | $7B |
|
||
Price history
+245.8% since first listed8 events — show timeline
- 2026-05-14 Price Changed $185,000 HKARMLS
- 2026-04-02 Relisted — HKARMLS
- 2025-11-14 Price Changed $189,000 HKARMLS
- 2025-10-01 Listed $192,000 HKARMLS
- 2025-07-09 Listing Removed — Metro Search MLS
- 2025-01-08 Listed $194,900 Metro Search MLS
- 2007-09-14 Sold (MLS) $50,000 Metro Search MLS
- 2007-06-11 Listed $53,500 Metro Search MLS
Property tax history
+1.4%/yrLatest (2025): $574 · -43.2% YoY. Source: county tax records.
Cash-flow waterfall
monthlySold comps — $/sqft
last 12 mo · ≤1 miLoading sold comps…