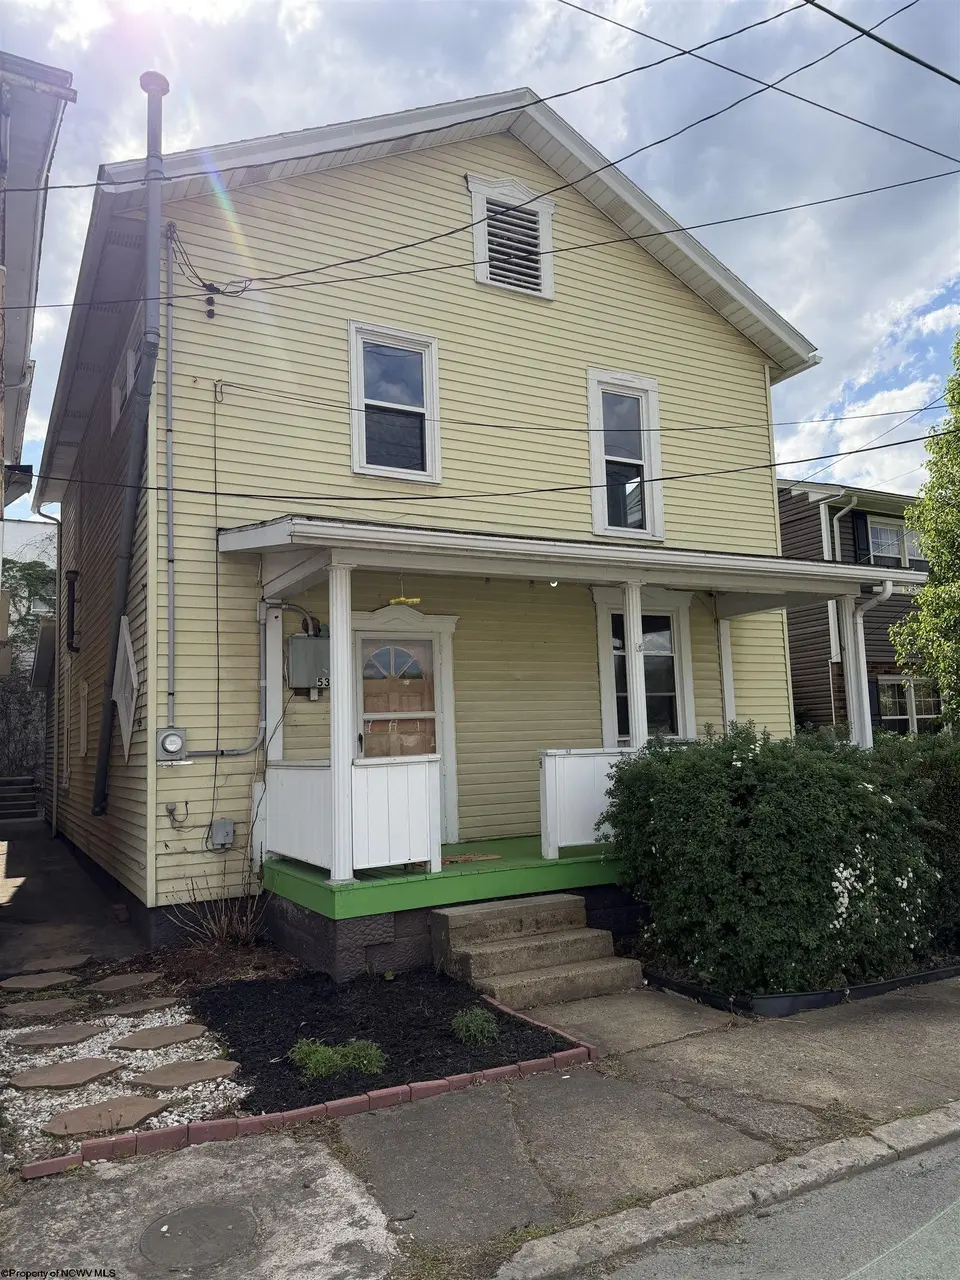
53 Rebecca · Shinnston, WV
Flood risk 3/10 · Minor
- FEMA flood zone
- X (unshaded)
- Chance of flooding over 30 yrs
- 0.17%
- Est. flood insurance / yr
- $507 – $1,088
Fire risk 3/10 · Minor
- Est. fire insurance / yr
- $787 – $1,461
Heat risk 5/10 · Moderate
- Hot days now (above 97°F)
- 8 days/yr
- Hot days in 30 yrs
- 22 days/yr
Wind risk 1/10 · Minimal
- Chance of severe wind over 30 yrs
- 0.0%
Air-quality risk 2/10 · Minimal
- Unhealthy air days now
- 1 days/yr
- Unhealthy air days in 30 yrs
- 1 days/yr
Risk factors via First Street. Map © Google.
Why this score? — see what drove the A- grade
The composite is a weighted blend of 9 inputs, each scored 0–100. Each bar is that input's sub-score; the figure is the points it added to the 100-point composite (weight × sub-score).
- Cash flow +30.0/30.0
- ARV discount +15.0/15.0
- DSCR +10.0/10.0
- 1% rule +9.9/10.0
- Appreciation +6.5/10.0
- Livability +4.0/5.0
- Schools +3.0/10.0
- Rent growth +2.5/5.0
- Condition / age +2.5/5.0
$84,900
🖨 Deal sheet (PDF) 📄 Offer letter ✓ Due diligence
Listing remarks
Tucked away in the heart of Shinnston, this property offers comfort, convenience and opportunity all in one. This three bedroom, two bath home features just over 1,600 square feet of living space, providing plenty of room to settle in and make it your own. Whether you're searching for a place to call home or looking to expand your investment portfolio, this property checks all the boxes. With low yard maintenance, a functional layout and inviting living spaces, it's easy to envision everyday living or long term rental potential. Don't miss your chance to own a versatile property in a convenient location--perfect for homeowners and investors. All taxes/measurements are approximate.
Key facts
- 1,960 sq ft lot
- Built 1900
- Listed 66 days
Property features AI
Exterior
- Parking: On-street parking
- Utilities: Public water; Public sewer
- Home design: Detached single-family residence; 2-story
- Construction: Block and vinyl siding construction; Shingle roof
- Exterior features: Level lot
Interior
- Flooring: Laminate; Vinyl
- Bathrooms: 2 full bathrooms
- Heating & cooling: Forced air heating; Window air conditioning units
- Interior features: Laminate and vinyl flooring; Six total rooms
Neighborhood map
What this means for you Summary
Snapshot
- This is a 3-bed/1.0-bath single-family listed at $85k.
Deal economics
- At list price, monthly cash flow is $417 ($5k/yr) — positive.
- The deal already cash-flows at list — no discount required.
- Meets the 1% rule at list price ($1k rent vs $85k).
- Recommended offer: $80k (6.0% below list) — sets the bar for market timing.
Location & tenants
- Location reads 80/100 on livability (#12 in WV, #1,712 nationally) — a professional / high-income tenant draw. Strengths: crime A+, cost of living A+, housing A+; Watch: amenities F.
- Harrison County Schools (town): math 29% / reading 43% proficiency, ranked #12 of 55 in WV (top 22%) — families likely to look elsewhere, expect single-tenant / working-renter base with shorter leases.
- Zoned schools: Big Elm Elementary School (math 33% / reading 29%, grade F, #215 of 377 statewide, top 57%, 624 students, 0% FRL); Lincoln Middle School (math 20% / reading 43%, grade F, #52 of 109 statewide, top 49%, 444 students, 0% FRL); Lincoln High School (math 17% / reading 37%, grade F, #79 of 110 statewide, top 78%, 548 students, 0% FRL) — zoned schools average 0% FRL vs 43% district-wide (43 pts lower); this property's tenant base skews higher-income than the district average.
- Market conditions: 14 active listings in the ZIP; 84 units permitted in Harrison County in 2024 (5 in 5+ unit buildings).
Forward outlook
- In year one you build about $3k of equity ($587 loan paydown + $3k appreciation (3.0% local appreciation)).
- Harrison County population projected at -11% by 2050 — secular population decline; favor cash flow + early exit over multi-decade hold.
- At projected returns (3.0% appreciation + 3.0% rent growth), your $24k cash investment doubles in ~3 years — after that, you're playing with house money.
Negotiation context
- It's been on market 66 days — a 6% lower offer ($80k) is reasonable based on typical stale-listing flexibility.
Risks & watch-outs
- Watch-outs: built in 1900 — expect roof / HVAC / electrical / plumbing capex.
- Climate carrying-cost: extreme-heat days projected 8→22/yr by 2055 (HVAC capex compounding) — expect insurance premiums to compound above CPI over the hold.
Questions for the listing agent
- It's been on market 66 days. Have you received any prior offers? Is the seller open to a 6% concession, seller financing, or rate buy-down credit?
- Built in 1900 — when were the roof, HVAC, electrical panel, plumbing, and water heater last replaced?
- Why hasn't it sold? Are there any deal-killer items the seller is aware of (foundation, flood, title, zoning, code violations)?
- Is there a deadline driving the sale (1031 exchange, divorce, estate, relocation)? That informs how much negotiation room exists.
- Schools are D-rated, which usually means shorter tenancies and higher turnover. Who's the typical renter profile here, and what's been the actual vacancy rate?
- What's the average days-on-market for RENTAL listings here right now (not sales)? A rising rental-DOM trend means longer vacancies and softer asking-rent achievability than the comps imply.
- What's the recent tenant-quality profile in this submarket — average credit score on applications, eviction rate, late-payment / NSF rate, and stable-employment percentage? A property-management company in the area should have these aggregated.
- How much new for-sale + rental construction is in the pipeline within 1–3 miles? Heavy new supply typically softens prices + rents 12–24 months out; constrained supply supports both.
Investment metrics
- 1% rule
- 1.49% ✓
- Cap rate
- 12.19%
- Cash-on-cash
- 21.04%
- DSCR
- 1.94
- GRM
- 5.6
CMA / ARV
- ARV (on-the-fly)
- $152,064
- Comps found
- 6
Show comp detail 6 sales within ~0.75 mi
| Address | Dist | Beds/Ba | Sqft | Sold | Price | $/sf | Match |
|---|---|---|---|---|---|---|---|
| 65 N Walnut St | 0.25mi | 3/1.0 | 1,568 (-9%) | 5mo | $149,300 | $95 | 68 |
| 20 Charles St | 0.21mi | 2/1.0 (-1) | 1,533 (-11%) | 14mo | $31,900 | $21 | 55 |
| 704 S Stewart | 0.45mi | 3/2.0 | 1,522 (-12%) | 3mo | $110,000 | $72 | 52 |
| 1045 E Pike St | 0.55mi | 3/1.0 | 1,671 (-3%) | 20mo | $189,000 | $113 | 52 |
| 618 Maple St | 0.24mi | 3/2.0 | 1,490 (-14%) | 18mo | $116,000 | $78 | 47 |
| 407 Howard St | 0.58mi | 3/2.5 | 1,983 (+15%) | 9mo | $175,000 | $88 | 35 |
Match score weights: distance 35% · size 25% · config 20% · recency 20%. Top-matched comps best support the ARV.
Projected returns pro-forma
2.95% appreciation · 3.0% rent growth · sell at horizon
- IRR
- 27.2%
- Equity multiple
- 2.54×
- Total profit
- $36,580
- Equity at exit
- $37,946
- IRR
- 27.9%
- Equity multiple
- 4.93×
- Total profit
- $93,315
- Equity at exit
- $58,301
Cash invested: $23,772 (down + closing). Projections, not guarantees.
Landlord ↔ Tenant lean methodology
- Overall (STATE)
- 83 Strongly Landlord-Friendly
- State West Virginia
- 83 Strongly Landlord-Friendly · R+22
- County
- — inherits STATE
- City
- — inherits STATE
ZIP-level market 26431
- Home prices YoY
- 1.8%
- Active inventory
- 14
- Price-to-rent
- 5.6×
Monthly cashflow live
- Estimated rent
- $1,265 medium interval (Pro) →
- Mortgage (P&I)
- −$445
- Tax from tax record
- −$102 /mo · $1,223/yr
- Insurance
- −$35
- HOA
- −$0
- Vacancy / Maint / Mgmt
- −$266
- Net cashflow
- $417
Break-even live
Sensitivity live
| Price | -10% $465 | -5% $441 | +0% $417 | +5% $393 | +10% $369 |
|---|---|---|---|---|---|
| Rent | -10% $317 | -5% $367 | +0% $417 | +5% $467 | +10% $517 |
| Rate | -1.0pp $460 | -0.5pp $438 | base $417 | +0.5pp $395 | +1.0pp $373 |
UW: 25.0% down · 7.5% · 30yr · 1.5% tax · 5.0% vac · 8.0% maint · 8.0% mgmt
Financing live
Cash to close
- Down payment
- $21,225
- Closing costs
- $2,547
- Reserves months
- —
- Total cash needed
- —
Loan-product check · same deal, 3 products live
Conventional
25% down · 7.5% · 30yr
- Down + closing
- —
- Monthly P&I
- —
- Monthly cashflow
- —
- DSCR
- —
- Eligible?
- —
Personal DTI + credit; lowest rate.
DSCR
20% down · 8.5% · 30yr
- Down + closing
- —
- Monthly P&I
- —
- Monthly cashflow
- —
- DSCR
- —
- Eligible?
- —
No personal income docs; deal must DSCR.
Hard money
10% down · 12.0% · 12mo
- Down + closing
- —
- Monthly P&I
- —
- Monthly cashflow
- —
- DSCR
- —
- Eligible?
- —
Short-term bridge; refi at stabilization.
Listing history 19 events
-
2026-06-22days on market $84,900 Active 66 DOM
-
2026-06-21days on market $84,900 Active 65 DOM
-
2026-06-19days on market $84,900 Active 63 DOM
-
2026-06-18days on market $84,900 Active 62 DOM
-
2026-06-17days on market $84,900 Active 61 DOM
-
2026-06-16days on market $84,900 Active 60 DOM
-
2026-06-15days on market $84,900 Active 59 DOM
-
2026-06-14days on market $84,900 Active 57 DOM
-
2026-06-12days on market $84,900 Active 56 DOM
-
2026-06-09days on market $84,900 Active 53 DOM
-
2026-06-08days on market $84,900 Active 52 DOM
-
2026-06-07days on market $84,900 Active 51 DOM
-
2026-06-05days on market $84,900 Active 48 DOM
-
2026-06-03days on market $84,900 Active 47 DOM
-
2026-06-02days on market $84,900 Active 46 DOM
-
2026-06-01days on market $84,900 Active 45 DOM
-
2026-05-31days on market $84,900 Active 44 DOM
-
2026-05-30days on market $84,900 Active 43 DOM
-
2026-04-17$84,900 Active
ⓘ Source: listings_history table (triggers on properties + properties_extension) + one-shot
backfill from property_details.listing_events for pre-trigger history.
Tax reassessment forecast WV · Resets to sale price
- Current annual tax
- $1,223 · $102/mo
- Projected year-2 tax
- $1,223 · $102/mo
- Expected delta
- $0/yr ($0/mo · 0.0%)
ⓘ Screening estimate from a state-policy table — verify with the county assessor before closing.
Climate risk First Street
- Flood 3/10 Moderate FEMA zone X (unshaded) · 17% chance over 30 yrs
- Wildfire 3/10 Moderate
- Heat 5/10 Major 8 d/yr ≥97°F today · 22 d/yr by 30 yrs out
- Wind 1/10 Low 0% chance of damaging wind over 30 yrs
- Air quality 2/10 Low 1 unhealthy d/yr today · 1 by 30 yrs out
Nearby sold comps map
Loading sold comps map…
Walkable amenities ~0.75 mi
Loading nearby amenities…
Taxation est. · year 1
- Rental income
- $15,181
- − Mortgage interest
- −$4,756
- − Property taxes
- −$1,223
- − Insurance
- −$424
- − Repairs & maintenance
- −$1,215
- − Management
- −$1,215
- − Depreciation
- −$2,470
- Taxable income
- $3,879
- Est. tax owed @ 24.0%
- −$931
- After-tax cash flow
- $4,072/yr
For passive investors: Depreciation is non-cash, so a rental often shows a tax loss while cash-flowing — sheltering income. Rental losses are passive: they offset passive income freely, and up to $25,000/yr can offset ordinary (W-2) income if you actively participate and your MAGI is under $100k (phasing out to $0 by $150k); unused losses carry forward. On sale, claimed depreciation is recaptured at up to 25%, and gains may owe capital-gains tax (a 1031 exchange can defer both). Figures are a year-1 estimate at your 24.0% rate — not tax advice; consult a CPA.
Schools (NCES district)
- District
- Harrison County Schools
- NCES district ID
- 5400510
- Math proficiency
- 29% ▼ -10.00%
- Reading proficiency
- 43% ▼ -3.00%
- Median HH income
- $43,269
- Composite
- 30.48/100
- National rank
- #6222
- State rank
- #12 of 55 in WV
Livability — Shinnston
- Score
- 80/100
- State rank
- #12
- US rank
- #1712
Category grades
Schools grade is shown separately in the Schools card above.
Census & demographics
- Census place
- Shinnston, WV
- Population (ZIP)
- 5,899
Population outlook (Harrison County) Hauer SSP2
- Today (2025)
- 67,273 people
- By 2030
- 65,963 · -1.9%
- By 2040
- 63,033 · -6.3%
- By 2050
- 59,999 · -10.8%
- By 2075
- 52,524 · -21.9%
- By 2100
- 42,654 · -36.6%
Race, ethnicity, and origin ACS 2023
- Neighborhood character
- Predominantly White (93%)
- Race & ethnicity
- White 93% Two or more races 5% Hispanic / Latino 2%
- Common ancestry
- Iranian 8% Lithuanian 2% Romanian 2%
- Foreign-born
- 1% · Canada, Vietnam
- Languages at home
- 98% English-only · Spanish 1%
Political lean MEDSL · Harrison
- 2024 margin
- Solid R (+41.0) · D 28.5% · R 69.4% · Other 2.1%
- 2008→2024 swing
- -27.6pp toward R · 2008: -13.3pp · 2024: -41.0pp
- All cycles
- 2024: R+41.0 2020: R+37.6 2016: R+39.5 2012: R+23.5 2008: R+13.3
Not yet ingested
- Civics
- —
Market trends
- HPI YoY
- ▲ 2.95%
- Current HPI
- 172.0039
- Rent YoY
- —
- Metro
- —
- State GDP YoY
- —
- F500 in state
- 0
Price history
1 event — show timeline
- 2026-04-17 Listed $84,900 NCWVREIN
Property tax history
+2.9%/yrLatest (2025): $1,223 · +8.0% YoY. Source: county tax records.
Cash-flow waterfall
monthlySold comps — $/sqft
last 12 mo · ≤1 miLoading sold comps…