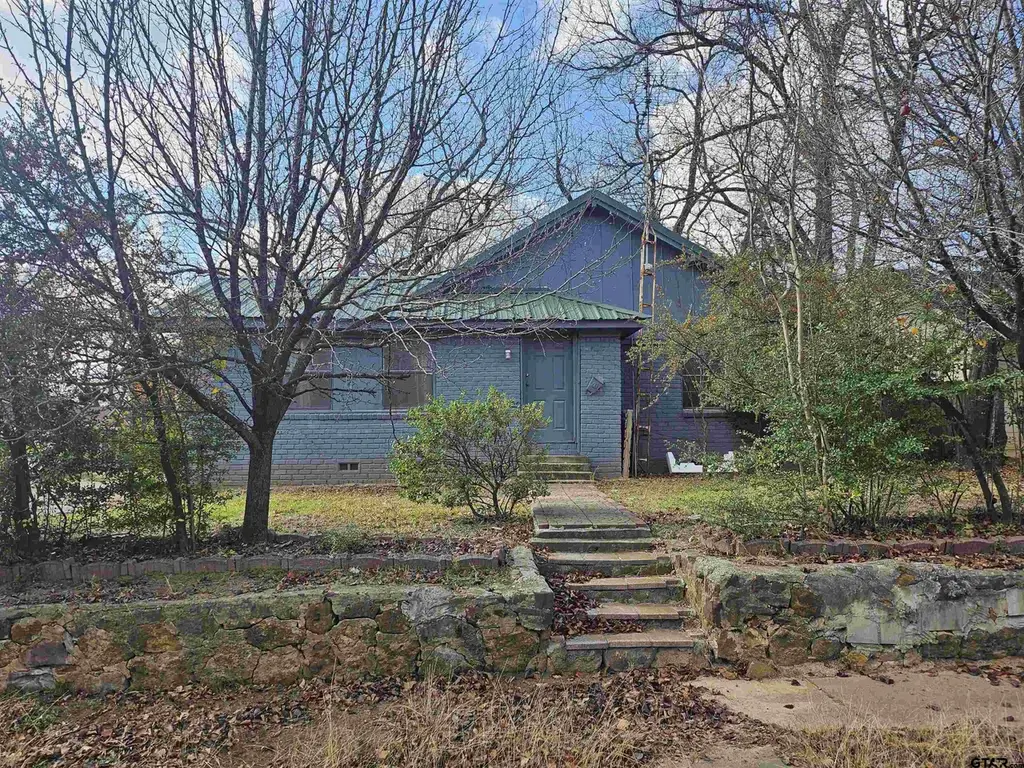
314 N Ross Ave · Tyler, TX
Flood risk 1/10 · Minimal
- FEMA flood zone
- X (unshaded)
- Chance of flooding over 30 yrs
- 0.0%
- Est. flood insurance / yr
- $507 – $1,088
Fire risk 1/10 · Minimal
- Est. fire insurance / yr
- $1,222 – $2,270
Heat risk 6/10 · Moderate
- Hot days now (above 109°F)
- 7 days/yr
- Hot days in 30 yrs
- 24 days/yr
Wind risk 6/10 · Moderate
- Chance of severe wind over 30 yrs
- 59.0%
Air-quality risk 2/10 · Minimal
- Unhealthy air days now
- 0 days/yr
- Unhealthy air days in 30 yrs
- 1 days/yr
Risk factors via First Street. Map © Google.
Why this score? — see what drove the B grade
The composite is a weighted blend of 9 inputs, each scored 0–100. Each bar is that input's sub-score; the figure is the points it added to the 100-point composite (weight × sub-score).
- Cash flow +29.6/30.0
- ARV discount +13.2/15.0
- DSCR +10.0/10.0
- 1% rule +8.3/10.0
- Livability +3.8/5.0
- Schools +3.3/10.0
- Rent growth +3.1/5.0
- Condition / age +2.5/5.0
- Appreciation +0.0/10.0
$135,000
🖨 Deal sheet (PDF) 📄 Offer letter ✓ Due diligence
Listing remarks MLS
Looking for a remodel? Here you go. This home could be the diamond you are wanting. Good sized home on a corner lot. Wake up everyday smell the fresh bread being baked nearby.
Key facts
- Built 1940
- Listed 167 days
Neighborhood map
What this means for you Summary
Snapshot
- This is a 3-bed/1.0-bath single-family listed at $135k.
Deal economics
- At list price, monthly cash flow is $485 ($6k/yr) — positive.
- The deal already cash-flows at list — no discount required.
- Meets the 1% rule at list price ($2k rent vs $135k).
- Recommended offer: $119k (12.0% below list) — sets the bar for market timing.
- Cap rate 10.6% vs local median 3.6% in Tyler — top-decile yield for the area; either an underpriced asset or a hidden risk that comps aren't pricing in. Stress-test before assuming the spread holds.
Location & tenants
- Location reads 75/100 on livability (#147 in TX, #4,181 nationally) — a middle-class / working-renter tenant base. Strengths: cost of living A+, housing A+, health & safety A+; Watch: employment C-, crime D+, commute F.
- Tyler ISD (urban): math 39% / reading 38% proficiency, ranked #449 of 826 in TX (top 54%) — families likely to look elsewhere, expect single-tenant / working-renter base with shorter leases; 66% free/reduced lunch — lower-income household profile, screen leases tightly.
- Zoned schools: Ramey El (math 34% / reading 24%, grade F, #2,668 of 4,322 statewide, top 63%, 541 students, 95% FRL); Boulter Middle (math 28% / reading 22%, grade F, #1,258 of 1,662 statewide, top 77%, 853 students, 93% FRL); Tyler Legacy H S (math 34% / reading 49%, grade F, #767 of 1,632 statewide, top 47%, 2,594 students, 58% FRL) — zoned schools average 82% FRL vs 66% district-wide (16 pts higher); higher-poverty schools than district average — tighter screening recommended.
- Market conditions: Rents rising (+2.3%/yr); 156 active listings in the ZIP; 26 comparable units currently listed for rent nearby; rentals at typical pace (median 23d on market — plan ~3-4 weeks tenant-placement turnaround); 42% of comp listings sitting > 30 days — soft ceiling on asking rent; 595 units permitted in Smith County in 2024 (45 in 5+ unit buildings).
- This rent runs 42% of the median local income ($52k/yr) — at the standard rent-burdened threshold; future hikes will face affordability resistance.
Forward outlook
- Local home prices are declining (-3.0%/yr); year-one equity from $933 of loan paydown is wiped out by about $4k of value loss. Plan a longer hold.
- Smith County population projected at +24% by 2050 — long-run rental-demand tailwind backs the buy-and-hold thesis.
- At projected returns (-3.0% appreciation + 2.3% rent growth), your $38k cash investment doubles in ~9 years — after that, you're playing with house money.
Negotiation context
- It's been on market 167 days — a 12% lower offer ($119k) is reasonable based on typical stale-listing flexibility.
- 2 sale attempts; this cycle's ask has dropped $10k (7%) from the opening price — seller is motivated, your offer sets the floor, not the list.
Risks & watch-outs
- Watch-outs: built in 1940 — expect roof / HVAC / electrical / plumbing capex.
- Climate carrying-cost: major wind risk, 59% chance of damaging wind over 30y; extreme-heat days projected 7→24/yr by 2055 (HVAC capex compounding) — expect insurance premiums to compound above CPI over the hold.
Questions for the listing agent
- It's been on market 167 days. Have you received any prior offers? Is the seller open to a 12% concession, seller financing, or rate buy-down credit?
- Built in 1940 — when were the roof, HVAC, electrical panel, plumbing, and water heater last replaced?
- Why hasn't it sold? Are there any deal-killer items the seller is aware of (foundation, flood, title, zoning, code violations)?
- Is there a deadline driving the sale (1031 exchange, divorce, estate, relocation)? That informs how much negotiation room exists.
- Schools are D-rated, which usually means shorter tenancies and higher turnover. Who's the typical renter profile here, and what's been the actual vacancy rate?
- Crime grade is D in this area — have there been break-ins, vandalism, or insurance claims at this property in the last 3 years? What carrier currently insures it and at what premium?
- What's the average days-on-market for RENTAL listings here right now (not sales)? A rising rental-DOM trend means longer vacancies and softer asking-rent achievability than the comps imply.
- What's the recent tenant-quality profile in this submarket — average credit score on applications, eviction rate, late-payment / NSF rate, and stable-employment percentage? A property-management company in the area should have these aggregated.
- How much new for-sale + rental construction is in the pipeline within 1–3 miles? Heavy new supply typically softens prices + rents 12–24 months out; constrained supply supports both.
Investment metrics
- 1% rule
- 1.33% ✓
- Cap rate
- 10.61%
- Cash-on-cash
- 15.41%
- DSCR
- 1.69
- GRM
- 6.2
CMA / ARV
- ARV (median comp)
- $154,417
- List price
- $135,000
- Delta
- -12.57%
- Verdict
- UNDERPRICED
- Comps
- 20 within 1.0 mi
Show comp detail 4 sales within ~0.75 mi
| Address | Dist | Beds/Ba | Sqft | Sold | Price | $/sf | Match |
|---|---|---|---|---|---|---|---|
| 1291 N Englewood | 0.65mi | 3/2.0 | 1,588 (-0%) | 14mo | $249,900 | $157 | 54 |
| 1523 W Lollar St | 0.26mi | 2/1.0 (-1) | 1,381 (-14%) | 24mo | $45,000 | $33 | 41 |
| 219 Bandera | 0.67mi | 3/1.0 | 1,400 (-12%) | 12mo | $215,000 | $154 | 39 |
| 602 N Bois D Arc Ave | 0.65mi | 3/2.0 | 1,365 (-14%) | 10mo | $233,500 | $171 | 33 |
Match score weights: distance 35% · size 25% · config 20% · recency 20%. Top-matched comps best support the ARV.
Projected returns pro-forma
-3.0% appreciation · 2.27% rent growth · sell at horizon
- IRR
- 5.3%
- Equity multiple
- 1.21×
- Total profit
- $7,753
- Equity at exit
- $20,129
- IRR
- 14.1%
- Equity multiple
- 2.09×
- Total profit
- $41,367
- Equity at exit
- $11,672
Cash invested: $37,800 (down + closing). Projections, not guarantees.
Landlord ↔ Tenant lean methodology
- Overall (STATE)
- 87 Strongly Landlord-Friendly
- State Texas
- 87 Strongly Landlord-Friendly · R+5
- County
- — inherits STATE
- City
- — inherits STATE
ZIP-level market 75702
- Home prices YoY
- -5.8%
- Rents YoY
- 2.3%
- Active inventory
- 156
- Price-to-rent
- 6.2×
Monthly cashflow live
- Estimated rent
- $1,801 high interval (Pro) →
- Mortgage (P&I)
- −$708
- Tax from tax record
- −$173 /mo · $2,075/yr
- Insurance
- −$56
- HOA
- −$0
- Vacancy / Maint / Mgmt
- −$378
- Net cashflow
- $485
Break-even live
Sensitivity live
| Price | -10% $562 | -5% $524 | +0% $485 | +5% $447 | +10% $409 |
|---|---|---|---|---|---|
| Rent | -10% $343 | -5% $414 | +0% $485 | +5% $556 | +10% $628 |
| Rate | -1.0pp $553 | -0.5pp $520 | base $485 | +0.5pp $450 | +1.0pp $415 |
UW: 25.0% down · 7.5% · 30yr · 1.5% tax · 5.0% vac · 8.0% maint · 8.0% mgmt
Financing live
Cash to close
- Down payment
- $33,750
- Closing costs
- $4,050
- Reserves months
- —
- Total cash needed
- —
Loan-product check · same deal, 3 products live
Conventional
25% down · 7.5% · 30yr
- Down + closing
- —
- Monthly P&I
- —
- Monthly cashflow
- —
- DSCR
- —
- Eligible?
- —
Personal DTI + credit; lowest rate.
DSCR
20% down · 8.5% · 30yr
- Down + closing
- —
- Monthly P&I
- —
- Monthly cashflow
- —
- DSCR
- —
- Eligible?
- —
No personal income docs; deal must DSCR.
Hard money
10% down · 12.0% · 12mo
- Down + closing
- —
- Monthly P&I
- —
- Monthly cashflow
- —
- DSCR
- —
- Eligible?
- —
Short-term bridge; refi at stabilization.
Rent comps 26 comps
| Address | Beds | Baths | Sqft | Rent | $/sqft | DOM | Units | Dist |
|---|---|---|---|---|---|---|---|---|
| 720 N Englewood Ave Tyler, TX | 3.0 | 1.0 | 1856 | $1,650 | $0.89 | 45d | 1 | 0.37mi |
| 1104 W Park St Tyler, TX | 3.0 | 2.0 | 1440 | $1,650 | $1.15 | 22d | 1 | 0.40mi |
| 556 W Erwin St Tyler, TX | 3.0 | 3.5 | 1956 | $2,550 | $1.30 | 22d | 1 | 0.46mi |
| 548 W Erwin St Tyler, TX | 3.0 | 3.5 | 1956 | $2,495 | $1.28 | 45d | 1 | 0.48mi |
| 548 W Erwin St Tyler, TX | 3.0 | 3.5 | 1956 | $2,295 | $1.17 | 22d | 1 | 0.48mi |
| 540 W Erwin St Tyler, TX | 3.0 | 3.5 | 1956 | $4,000 | $2.04 | 45d | 1 | 0.49mi |
| 2006 W Oakwood St Tyler, TX | 3.0 | 2.0 | 1344 | $1,895 | $1.41 | 15d | 1 | 0.54mi |
| 539 Williams Ct Tyler, TX | 2.0 | 1.0 | 1352 | $1,415 | $1.05 | 22d | 1 | 0.64mi |
| 526 S Bonner Ave Apt 4 Tyler, TX | 2.0 | 1.0 | 1120 | $1,175 | $1.05 | 22d | 1 | 0.78mi |
| 431 S College Ave Tyler, TX | 2.0 | 1.0 | 1380 | $1,650 | $1.20 | 22d | 1 | 0.86mi |
| 431 S College Ave Tyler, TX | 2.0 | 1.0 | 1380 | $1,750 | $1.27 | 45d | 1 | 0.86mi |
| 1523 N Englewood Ave Tyler, TX | 3.0 | 2.0 | 1542 | $1,650 | $1.07 | 45d | 1 | 0.89mi |
| 809 W Harmony St Tyler, TX | 3.0 | 2.0 | 1309 | $1,500 | $1.15 | 45d | 1 | 0.94mi |
| 826 W Franklin St Tyler, TX | 3.0 | 2.0 | 1273 | $1,550 | $1.22 | 15d | 1 | 0.94mi |
| 1538 N Hill Ave Tyler, TX | 3.0 | 2.0 | 1813 | $1,650 | $0.91 | 22d | 1 | 0.95mi |
| 1618 N Tenneha Ave Tyler, TX | 3.0 | 1.0 | 1587 | $1,400 | $0.88 | 15d | 1 | 1.01mi |
| 425 E Oakwood St Tyler, TX | 3.0 | 2.0 | 1298 | $1,540 | $1.19 | 45d | 1 | 1.04mi |
| 522 W Dobbs St Tyler, TX | 3.0 | 1.0 | 1127 | $1,395 | $1.24 | 15d | 1 | 1.06mi |
| 501 W Vance St Tyler, TX | 3.0 | 2.0 | 1160 | $1,350 | $1.16 | 45d | 1 | 1.10mi |
| 1500 Mockingbird Ln Tyler, TX | 3.0 | 2.0 | 1090 | $1,230 | $1.13 | 45d | 1 | 1.22mi |
| 1115 S Robertson Ave Tyler, TX | 2.0 | 1.0 | 1366 | $1,550 | $1.13 | 15d | 1 | 1.23mi |
| 132 Rowland Pl Unit b Tyler, TX | 2.0 | 1.0 | 1170 | $1,295 | $1.11 | 22d | 1 | 1.25mi |
| 328 Mockingbird Ln Tyler, TX | 2.0 | 1.0 | 1200 | $950 | $0.79 | 15d | 1 | 1.33mi |
| 1215 S Lenox St Tyler, TX | 3.0 | 2.0 | 1090 | $1,264 | $1.16 | 45d | 1 | 1.33mi |
| 305 E Lake St Tyler, TX | 2.0 | 1.5 | 1287 | $1,695 | $1.32 | 15d | 1 | 1.48mi |
| 324 S Saunders Ave Tyler, TX | 3.0 | 2.0 | 1650 | $2,100 | $1.27 | 45d | 1 | 1.48mi |
Listing history 23 events
-
2026-06-22days on market $135,000 Active 167 DOM
-
2026-06-19days on market $135,000 Active 165 DOM
-
2026-06-18days on market $135,000 Active 164 DOM
-
2026-06-17days on market $135,000 Active 163 DOM
-
2026-06-16days on market $135,000 Active 162 DOM
-
2026-06-15days on market $135,000 Active 161 DOM
-
2026-06-14days on market $135,000 Active 159 DOM
-
2026-06-13days on market $135,000 Active 158 DOM
-
2026-06-10days on market $135,000 Active 156 DOM
-
2026-06-09days on market $135,000 Active 155 DOM
-
2026-06-08days on market $135,000 Active 154 DOM
-
2026-06-07days on market $135,000 Active 153 DOM
-
2026-06-05days on market $135,000 Active 150 DOM
-
2026-06-02days on market $135,000 Active 148 DOM
-
2026-06-01days on market $135,000 Active 147 DOM
-
2026-05-31days on market $135,000 Active 146 DOM
-
2026-05-30days on market $135,000 Active 145 DOM
-
2026-05-13price $135,000 175-char remark
Show marketing remark (175 chars)
Looking for a remodel? Here you go. This home could be the diamond you are wanting. Good sized home on a corner lot. Wake up everyday smell the fresh bread being baked nearby.
-
2026-04-25status Active 175-char remark
Show marketing remark (175 chars)
Looking for a remodel? Here you go. This home could be the diamond you are wanting. Good sized home on a corner lot. Wake up everyday smell the fresh bread being baked nearby.
-
2026-04-20status Pending 175-char remark
Show marketing remark (175 chars)
Looking for a remodel? Here you go. This home could be the diamond you are wanting. Good sized home on a corner lot. Wake up everyday smell the fresh bread being baked nearby.
-
2025-12-31$145,000 Active 175-char remark
Show marketing remark (175 chars)
Looking for a remodel? Here you go. This home could be the diamond you are wanting. Good sized home on a corner lot. Wake up everyday smell the fresh bread being baked nearby.
-
2013-03-15soldstatus
-
2001-07-02soldstatus
ⓘ Source: listings_history table (triggers on properties + properties_extension) + one-shot
backfill from property_details.listing_events for pre-trigger history.
Tax reassessment forecast TX · Resets to sale price
- Current annual tax
- $2,075 · $173/mo
- Projected year-2 tax
- $2,470 · $206/mo
- Expected delta
- +$395/yr (+$33/mo · 19.1%)
ⓘ Screening estimate from a state-policy table — verify with the county assessor before closing.
Climate risk First Street
- Flood 1/10 Low FEMA zone X (unshaded) · 0% chance over 30 yrs
- Wildfire 1/10 Low
- Heat 6/10 Major 7 d/yr ≥109°F today · 24 d/yr by 30 yrs out
- Wind 6/10 Major 59% chance of damaging wind over 30 yrs
- Air quality 2/10 Low 0 unhealthy d/yr today · 1 by 30 yrs out
Nearby sold comps map
Loading sold comps map…
Walkable amenities ~0.75 mi
Loading nearby amenities…
Taxation est. · year 1
- Rental income
- $21,607
- − Mortgage interest
- −$7,562
- − Property taxes
- −$2,075
- − Insurance
- −$675
- − Repairs & maintenance
- −$1,729
- − Management
- −$1,729
- − Depreciation
- −$3,927
- Taxable income
- $3,911
- Est. tax owed @ 24.0%
- −$939
- After-tax cash flow
- $4,886/yr
For passive investors: Depreciation is non-cash, so a rental often shows a tax loss while cash-flowing — sheltering income. Rental losses are passive: they offset passive income freely, and up to $25,000/yr can offset ordinary (W-2) income if you actively participate and your MAGI is under $100k (phasing out to $0 by $150k); unused losses carry forward. On sale, claimed depreciation is recaptured at up to 25%, and gains may owe capital-gains tax (a 1031 exchange can defer both). Figures are a year-1 estimate at your 24.0% rate — not tax advice; consult a CPA.
Schools (NCES district)
- District
- Tyler ISD
- NCES district ID
- 4843470
- Math proficiency
- 39% ▼ -4.00%
- Reading proficiency
- 38% ▼ -1.00%
- Median HH income
- $44,090
- Composite
- 32.69/100
- National rank
- #5650
- State rank
- #449 of 826 in TX
Livability — Tyler
- Score
- 75/100
- State rank
- #147
- US rank
- #4181
Category grades
Schools grade is shown separately in the Schools card above.
Census & demographics
- Census place
- Tyler, TX
- County
- Smith County · 180,570 people
- City population
- 127,842
- Metro
- Tyler, TX
- Population (ZIP)
- 27,927
- Household income
- $51,564
- Rent vs Own
- Severe rent burden
- 803.0
Population outlook (Smith County) Hauer SSP2
- Today (2025)
- 248,890 people
- By 2030
- 261,665 · +5.1%
- By 2040
- 286,114 · +15.0%
- By 2050
- 308,006 · +23.8%
- By 2075
- 354,171 · +42.3%
- By 2100
- 372,828 · +49.8%
Race, ethnicity, and origin ACS 2023
- Neighborhood character
- Diverse neighborhood (Simpson 0.61)
- Race & ethnicity
- Hispanic / Latino 49% Black 37% White 12% Two or more races 11% Native American 1%
- Hispanic origin (detail)
- Mexican 47%
- Common ancestry
- Lithuanian 1%
- Foreign-born
- 20% · Canada
- Languages at home
- 56% English-only · Spanish 44%
Political lean MEDSL · Smith
- 2024 margin
- Solid R (+45.1) · D 27.0% · R 72.1%
- 2008→2024 swing
- -5.6pp toward R · 2008: -39.5pp · 2024: -45.1pp
- All cycles
- 2024: R+45.1 2020: R+39.4 2016: R+43.9 2012: R+46.9 2008: R+39.5
Not yet ingested
- Civics
- —
Market trends
- HPI YoY
- ▼ -12.63%
- Current HPI
- 207.1573
- Rent YoY
- ▲ 2.27%
- Metro
- Tyler, TX
- State GDP YoY
- ▲ 3.95%
- F500 in state
- 110
Industry mix (Fortune 500 HQ in TX)
| Industry | F500 HQs | Revenue |
|---|---|---|
| Energy | 16 | $1,198B |
|
||
| Technology | 5 | $198B |
|
||
| Engineering / Construction | 4 | $72B |
|
||
| Energy Services | 3 | $60B |
|
||
| Utilities | 3 | $41B |
|
||
| Healthcare | 2 | $330B |
|
||
Price history
-6.9% since first listed6 events — show timeline
- 2026-05-13 Price Changed $135,000 GTAR
- 2026-04-25 Relisted — GTAR
- 2026-04-20 Pending — GTAR
- 2025-12-31 Listed $145,000 GTAR
- 2013-03-15 Sold (Public Records) — Public Records
- 2001-07-02 Sold (Public Records) — Public Records
Property tax history
+10.3%/yrLatest (2024): $2,075 · +17.1% YoY. Source: county tax records.
Cash-flow waterfall
monthlySold comps — $/sqft
last 12 mo · ≤1 miLoading sold comps…