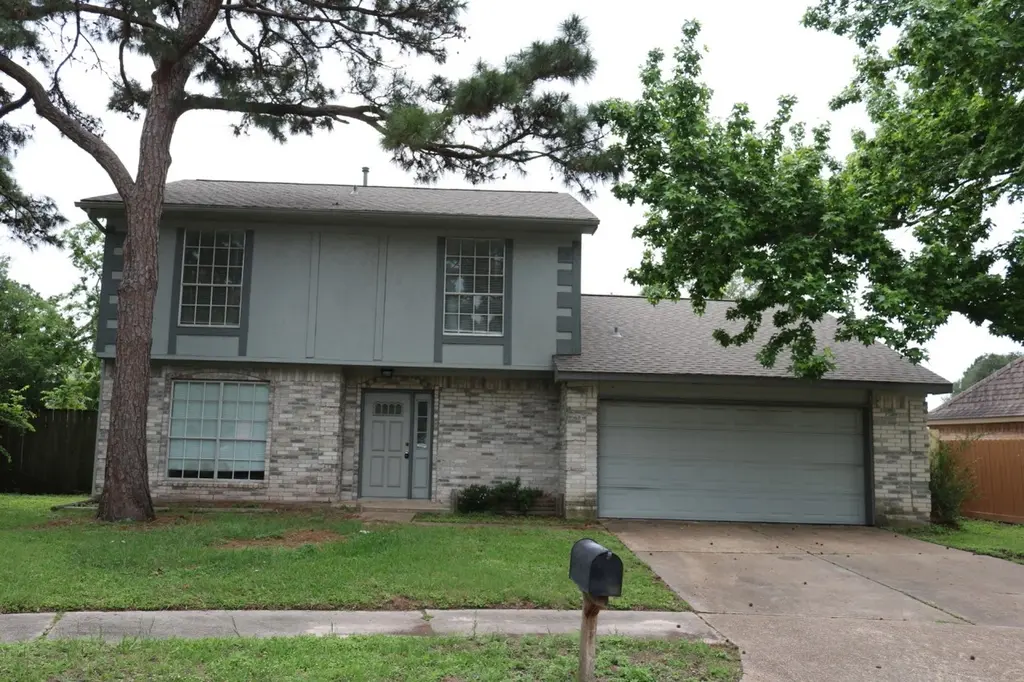
15511 Sungold Ct · Houston, TX
Flood risk 3/10 · Minor
- FEMA flood zone
- X (unshaded)
- Chance of flooding over 30 yrs
- 0.2%
- Est. flood insurance / yr
- $507 – $1,088
Fire risk 1/10 · Minimal
- Est. fire insurance / yr
- $1,222 – $2,270
Heat risk 9/10 · Severe
- Hot days now (above 110°F)
- 7 days/yr
- Hot days in 30 yrs
- 23 days/yr
Wind risk 8/10 · Major
- Chance of severe wind over 30 yrs
- 99.0%
Air-quality risk 3/10 · Minor
- Unhealthy air days now
- 2 days/yr
- Unhealthy air days in 30 yrs
- 3 days/yr
Risk factors via First Street. Map © Google.
Why this score? — see what drove the D+ grade
The composite is a weighted blend of 9 inputs, each scored 0–100. Each bar is that input's sub-score; the figure is the points it added to the 100-point composite (weight × sub-score).
- ARV discount +15.0/15.0
- Cash flow +9.7/30.0
- Appreciation +4.5/10.0
- Schools +4.4/10.0
- 1% rule +4.3/10.0
- Livability +3.7/5.0
- Rent growth +3.0/5.0
- DSCR +2.8/10.0
- Condition / age +2.5/5.0
$209,000
🖨 Deal sheet (PDF) 📄 Offer letter ✓ Due diligence
Listing remarks
Nestled on a quiet cul-de-sac in the highly desirable Copperfield Northmead Village subdivision, this lovely 2-story home offers 3 bedrooms and 2.5 baths with a layout designed for both comfort and flexibility. The main level is dedicated to shared living spaces, creating a natural flow from the formal dining room to the inviting living room, breakfast area and kitchen. Wet bar -- perfect for entertaining or relaxing evenings at home. All bedrooms are upstairs. Roof replaced Dec 2025. Enjoy the convenience of being within walking distance to the neighborhood park and pool, ideal for outdoor activities and leisure. With quick access to major highways, nearby schools, shopping, dining, and en
Key facts
- 7,731 sq ft lot
- 2 garage spots
- Built 1981
Property features AI
Finance
- HOA & community: Part of Northmead Village HOA; Annual association fee of $675
Exterior
- Parking: Attached garage with 2 spaces
- Utilities: Public water; Public sewer
- Home design: Residential property; Built in 1981; Slab foundation
- Construction: Brick construction; Composition roof
- Exterior features: Subdivision lot
Interior
- Kitchen: Dishwasher; Disposal; Breakfast nook (14 x 12)
- Bedrooms: Primary bedroom on second level (17 x 12); Second-level bedroom (12 x 11); Second-level bedroom (11 x 9)
- Bathrooms: 2 full bathrooms; 1 half bathroom
- Heating & cooling: Central heating (gas); Central electric air conditioning
- Interior features: One fireplace; 7 total rooms
Neighborhood map
What this means for you Summary
Snapshot
- This is a 3-bed/2.5-bath single-family listed at $209k.
Deal economics
- At list price, monthly cash flow is $-137 ($-2k/yr) — negative.
- To cash-flow at today's rent, offer at most $185k (11.6% below list).
- To meet the 1% rule (rent ≥ 1% of price), the offer needs to be $195k (6.8% below list).
- Recommended offer: $185k (11.6% below list) — sets the bar for cash-flow.
- Cap rate 5.5% vs local median 3.1% in Houston — top-decile yield for the area; either an underpriced asset or a hidden risk that comps aren't pricing in. Stress-test before assuming the spread holds.
Location & tenants
- Location reads 74/100 on livability (#184 in TX, #4,771 nationally) — a middle-class / working-renter tenant base. Strengths: amenities A+, cost of living A+, housing A+; Watch: crime F.
- Cypress-Fairbanks ISD (suburban): math 45% / reading 52% proficiency, ranked #161 of 826 in TX (top 20%) — families likely to look elsewhere, expect single-tenant / working-renter base with shorter leases.
- Zoned schools: Fiest El (math 28% / reading 39%, grade F, #2,174 of 4,322 statewide, top 51%, 862 students, 69% FRL); Labay Middle (math 46% / reading 47%, grade D+, #443 of 1,662 statewide, top 28%, 1,199 students, 70% FRL); Cypress-Fairbanks J J A E P (12 students, 0% FRL) — zoned schools at 46% FRL track the district average.
- Market conditions: Rents rising (+2.1%/yr); 335 active listings in the ZIP; 18 comparable units currently listed for rent nearby; rentals leasing fast (median 13d on market — plan ~1-2 weeks tenant-placement turnaround); solid renter incomes; 29,883 units permitted in Harris County in 2024 (8,621 in 5+ unit buildings).
Forward outlook
- Local home prices are declining (-0.9%/yr); year-one equity from $1k of loan paydown is wiped out by about $2k of value loss. Plan a longer hold.
- Harris County population projected at +47% by 2050 — long-run rental-demand tailwind backs the buy-and-hold thesis.
Negotiation context
- It's been on market 30 days — a 2% lower offer ($206k) is reasonable based on typical stale-listing flexibility.
- Current owner paid $78k; list at $209k implies a 168% gain — meaningful room to come down on a strong offer.
Risks & watch-outs
- Watch-outs: property tax is 2.5% of price.
- Climate carrying-cost: severe wind risk, 99% chance of damaging wind over 30y; extreme-heat days projected 7→23/yr by 2055 (HVAC capex compounding) — expect insurance premiums to compound above CPI over the hold.
Questions for the listing agent
- What do current leases actually rent for vs. the listed asking? Can we see a recent rent roll and the last 12 months of T-12 income?
- Property tax is high relative to price — has the assessment been appealed recently, and will the sale trigger a re-assessment?
- What does the HOA fee cover, when was the last increase, and are there any pending special assessments or reserve-fund shortfalls?
- Is there a deadline driving the sale (1031 exchange, divorce, estate, relocation)? That informs how much negotiation room exists.
- Schools are D-rated, which usually means shorter tenancies and higher turnover. Who's the typical renter profile here, and what's been the actual vacancy rate?
- Crime grade is F in this area — have there been break-ins, vandalism, or insurance claims at this property in the last 3 years? What carrier currently insures it and at what premium?
- The area grade is low — what's the realistic commute time and amenity access for the typical tenant pool here? Any planned neighborhood developments (good or bad) we should know about?
- What's the average days-on-market for RENTAL listings here right now (not sales)? A rising rental-DOM trend means longer vacancies and softer asking-rent achievability than the comps imply.
- What's the recent tenant-quality profile in this submarket — average credit score on applications, eviction rate, late-payment / NSF rate, and stable-employment percentage? A property-management company in the area should have these aggregated.
- How much new for-sale + rental construction is in the pipeline within 1–3 miles? Heavy new supply typically softens prices + rents 12–24 months out; constrained supply supports both.
Investment metrics
- 1% rule
- 0.93% ✗
- Cap rate
- 5.51%
- Cash-on-cash
- -2.80%
- DSCR
- 0.88
- GRM
- 8.9
CMA / ARV
- ARV (median comp)
- $257,730
- List price
- $209,000
- Delta
- -18.91%
- Verdict
- UNDERPRICED
- Comps
- 20 within 1.0 mi
Show comp detail 12 sales within ~0.75 mi
| Address | Dist | Beds/Ba | Sqft | Sold | Price | $/sf | Match |
|---|---|---|---|---|---|---|---|
| 15511 Sungold Ct | 0.00mi | 3/2.5 | 1,876 (0%) | 0mo | $209,000 | $111 | 100 |
| 15610 Manorford Ct | 0.35mi | 3/2.5 | 1,921 (+2%) | 1mo | $259,900 | $135 | 79 |
| 15611 Meadow Village Dr | 0.13mi | 3/2.0 | 1,732 (-8%) | 3mo | $239,900 | $139 | 76 |
| 15427 Pebble Lake Dr | 0.09mi | 3/2.0 | 1,666 (-11%) | 0mo | $270,000 | $162 | 75 |
| 8622 Sunny Ridge Dr | 0.21mi | 3/2.0 | 1,760 (-6%) | 3mo | $240,000 | $136 | 75 |
| 15802 Oak Mountain Dr | 0.42mi | 3/2.5 | 1,745 (-7%) | 1mo | $265,000 | $152 | 68 |
| 15907 Meadow Village Dr | 0.54mi | 3/2.0 | 1,828 (-3%) | 2mo | $275,000 | $150 | 67 |
| 15407 Glenwood Park Dr | 0.25mi | 3/2.0 | 2,068 (+10%) | 3mo | $299,999 | $145 | 67 |
| 15806 Oak Mountain Dr | 0.42mi | 3/2.5 | 2,045 (+9%) | 1mo | $295,000 | $144 | 64 |
| 8550 Sparkling Springs Dr | 0.68mi | 3/2.0 | 1,951 (+4%) | 2mo | $289,900 | $149 | 58 |
| 8115 Town Creek Dr | 0.45mi | 4/2.5 (+1) | 2,040 (+9%) | 4mo | $279,900 | $137 | 56 |
| 8655 Plum Lake Dr | 0.73mi | 4/2.5 (+1) | 2,076 (+11%) | 1mo | $360,000 | $173 | 42 |
Match score weights: distance 35% · size 25% · config 20% · recency 20%. Top-matched comps best support the ARV.
Projected returns pro-forma
-0.94% appreciation · 2.1% rent growth · sell at horizon
- IRR
- -10.1%
- Equity multiple
- 0.56×
- Total profit
- $-25,502
- Equity at exit
- $50,998
- IRR
- -4.2%
- Equity multiple
- 0.62×
- Total profit
- $-22,206
- Equity at exit
- $54,019
Cash invested: $58,520 (down + closing). Projections, not guarantees.
Landlord ↔ Tenant lean methodology
- Overall (STATE)
- 87 Strongly Landlord-Friendly
- State Texas
- 87 Strongly Landlord-Friendly · R+5
- County
- — inherits STATE
- City
- — inherits STATE
ZIP-level market 77095
- Home prices YoY
- -0.4%
- Rents YoY
- 2.1%
- Active inventory
- 335
- Price-to-rent
- 8.9×
Monthly cashflow live
- Estimated rent
- $1,948 high interval (Pro) →
- Mortgage (P&I)
- −$1,096
- Tax from tax record
- −$436 /mo · $5,236/yr
- Insurance
- −$87
- HOA
- −$56
- Vacancy / Maint / Mgmt
- −$409
- Net cashflow
- $-137
Break-even live
Sensitivity live
| Price | -10% $-18 | -5% $-77 | +0% $-137 | +5% $-196 | +10% $-255 |
|---|---|---|---|---|---|
| Rent | -10% $-291 | -5% $-214 | +0% $-137 | +5% $-60 | +10% $17 |
| Rate | -1.0pp $-31 | -0.5pp $-83 | base $-137 | +0.5pp $-191 | +1.0pp $-246 |
UW: 25.0% down · 7.5% · 30yr · 1.5% tax · 5.0% vac · 8.0% maint · 8.0% mgmt
Financing live
Cash to close
- Down payment
- $52,250
- Closing costs
- $6,270
- Reserves months
- —
- Total cash needed
- —
Loan-product check · same deal, 3 products live
Conventional
25% down · 7.5% · 30yr
- Down + closing
- —
- Monthly P&I
- —
- Monthly cashflow
- —
- DSCR
- —
- Eligible?
- —
Personal DTI + credit; lowest rate.
DSCR
20% down · 8.5% · 30yr
- Down + closing
- —
- Monthly P&I
- —
- Monthly cashflow
- —
- DSCR
- —
- Eligible?
- —
No personal income docs; deal must DSCR.
Hard money
10% down · 12.0% · 12mo
- Down + closing
- —
- Monthly P&I
- —
- Monthly cashflow
- —
- DSCR
- —
- Eligible?
- —
Short-term bridge; refi at stabilization.
Rent comps 18 comps
| Address | Beds | Baths | Sqft | Rent | $/sqft | DOM | Units | Dist |
|---|---|---|---|---|---|---|---|---|
| 15131 West Rd Houston, TX | 3.0 | 2.0 | 1295 | $1,885 | $1.46 | 24d | 1 | 0.38mi |
| 15131 West Rd Houston, TX | 3.0 | 2.0 | 1295 | $1,885 | $1.46 | 46d | 1 | 0.38mi |
| 15125 West Rd Houston, TX | 1.0–3.0 | 1.0–2.0 | 969 | $1,995 | $2.06 | 1d | 29 | 0.44mi |
| 8550 Easton Commons Dr Houston, TX | 3.0 | 2.0 | 1325 | $1,945 | $1.47 | 46d | 1 | 0.60mi |
| 8550 Easton Commons Dr Unit 8583 Houston, TX | 3.0 | 2.0 | 1325 | $1,837 | $1.39 | 19d | 1 | 0.60mi |
| 14818 Chetland Place Dr Unit CHEP18-1 Houston, TX | 3.0 | 2.5 | 2490 | $2,100 | $0.84 | 46d | 1 | 0.62mi |
| 8559 Spring Green Dr Houston, TX | 3.0 | 2.0 | 1751 | $1,749 | $1.00 | 5d | 1 | 0.67mi |
| 9140 Highway 6 N Houston, TX | 1.0–3.0 | 1.0–3.0 | 1083 | $2,008 | $1.85 | 1d | 36 | 0.77mi |
| 15511 Tuckerton Rd Houston, TX | 1.0–3.0 | 1.0–2.0 | 1069 | $1,799 | $1.68 | 5d | 1 | 0.80mi |
| 8335 Columbia Forest Dr Houston, TX | 3.0 | 3.0 | 1767 | $2,000 | $1.13 | 46d | 1 | 0.80mi |
| 9125 Highway 6 N Houston, TX | 1.0–3.0 | 1.0–2.0 | 990 | $1,956 | $1.97 | 0d | 118 | 0.81mi |
| 15517 Tuckerton Rd Houston, TX | 3.0 | 2.0 | 1312 | $1,600 | $1.22 | 46d | 1 | 0.81mi |
| 15715 Tuckerton Rd Unit 510 Houston, TX | 3.0 | 2.0 | 1527 | $1,725 | $1.13 | 0d | 1 | 0.86mi |
| 14811 West Rd Unit 14844 Houston, TX | 3.0 | 2.0 | 1570 | $2,172 | $1.38 | 12d | 1 | 0.91mi |
| 14811 West Rd Unit 3148 Houston, TX | 3.0 | 2.0 | 1570 | $2,183 | $1.39 | 0d | 1 | 0.91mi |
| 15050 Copper Grove Blvd Houston, TX | 1.0–3.0 | 1.0–2.5 | 1134 | $2,028 | $1.79 | 0d | 31 | 0.96mi |
| 7415 Broken Ridge Dr Houston, TX | 3.0 | 2.5 | 2416 | $2,245 | $0.93 | 46d | 1 | 1.28mi |
| 16303 Hickory Point Rd Houston, TX | 4.0 | 2.5 | 2556 | $2,400 | $0.94 | 5d | 1 | 1.46mi |
HOA detail
- Monthly dues
- $56 · $672/yr
- Likely covers
- pool
Listing history 3 events
-
2026-05-14price $209,000 842-char remark
-
2026-04-27$219,000 Active 842-char remark
-
1990-04-01soldstatus $78,000
ⓘ Source: listings_history table (triggers on properties + properties_extension) + one-shot
backfill from property_details.listing_events for pre-trigger history.
Tax reassessment forecast TX · Resets to sale price
- Current annual tax
- $5,236 · $436/mo
- Projected year-2 tax
- $5,236 · $436/mo
- Expected delta
- $0/yr ($0/mo · 0.0%)
ⓘ Screening estimate from a state-policy table — verify with the county assessor before closing.
Climate risk First Street
- Flood 3/10 Moderate FEMA zone X (unshaded) · 20% chance over 30 yrs
- Wildfire 1/10 Low
- Heat 9/10 Extreme 7 d/yr ≥110°F today · 23 d/yr by 30 yrs out
- Wind 8/10 Severe 99% chance of damaging wind over 30 yrs
- Air quality 3/10 Moderate 2 unhealthy d/yr today · 3 by 30 yrs out
Nearby sold comps map
Loading sold comps map…
Walkable amenities ~0.75 mi
Loading nearby amenities…
Taxation est. · year 1
- Rental income
- $23,375
- − Mortgage interest
- −$11,707
- − Property taxes
- −$5,236
- − Insurance
- −$1,045
- − Repairs & maintenance
- −$1,870
- − Management
- −$1,870
- − HOA
- −$672
- − Depreciation
- −$6,080
- Taxable loss
- −$5,106
- Est. tax savings @ 24.0%
- +$1,225
- After-tax cash flow
- $-414/yr
For passive investors: Depreciation is non-cash, so a rental often shows a tax loss while cash-flowing — sheltering income. Rental losses are passive: they offset passive income freely, and up to $25,000/yr can offset ordinary (W-2) income if you actively participate and your MAGI is under $100k (phasing out to $0 by $150k); unused losses carry forward. On sale, claimed depreciation is recaptured at up to 25%, and gains may owe capital-gains tax (a 1031 exchange can defer both). Figures are a year-1 estimate at your 24.0% rate — not tax advice; consult a CPA.
Schools (NCES district)
- District
- Cypress-Fairbanks ISD
- NCES district ID
- 4816110
- Math proficiency
- 45% ▼ -12.00%
- Reading proficiency
- 52% ▼ -2.00%
- Median HH income
- $72,025
- Composite
- 43.63/100
- National rank
- #2968
- State rank
- #161 of 826 in TX
Livability — Houston
- Score
- 74/100
- State rank
- #184
- US rank
- #4771
Category grades
Schools grade is shown separately in the Schools card above.
Census & demographics
- County
- Harris County · 4,702,590 people
- City population
- 3,226,434
- Metro
- Houston-The Woodlands-Sugar Land, TX
- Population (ZIP)
- 69,767
- Household income
- $91,594
- Rent vs Own
- Severe rent burden
- 1870.0
Population outlook (Harris County) Hauer SSP2
- Today (2025)
- 5,571,493 people
- By 2030
- 6,089,821 · +9.3%
- By 2040
- 7,142,806 · +28.2%
- By 2050
- 8,185,864 · +46.9%
- By 2075
- 10,574,329 · +89.8%
- By 2100
- 12,109,958 · +117.4%
Race, ethnicity, and origin ACS 2023
- Neighborhood character
- Highly diverse neighborhood (Simpson 0.73)
- Race & ethnicity
- White 39% Hispanic / Latino 28% Two or more races 18% Black 16% Asian 12%
- Hispanic origin (detail)
- Mexican 16% Cuban 2%
- Common ancestry
- Italian 2% Romanian 2% Lithuanian 1%
- Foreign-born
- 25% · Canada, Vietnam, Jamaica
- Languages at home
- 66% English-only · Spanish 19% Vietnamese 5% Arabic 3%
Political lean MEDSL · Harris
- 2024 margin
- Lean D (+5.5) · D 52.0% · R 46.4% · Other 1.6%
- 2008→2024 swing
- +3.9pp toward D · 2008: 1.6pp · 2024: 5.5pp
- All cycles
- 2024: D+5.5 2020: D+13.3 2016: D+12.4 2012: D+0.1 2008: D+1.6
Not yet ingested
- Civics
- —
Market trends
- HPI YoY
- ▼ -0.94%
- Current HPI
- 236.0249
- Rent YoY
- ▲ 2.10%
- Metro
- Houston-The Woodlands-Sugar Land, TX
- State GDP YoY
- ▲ 3.95%
- F500 in state
- 110
Industry mix (Fortune 500 HQ in TX)
| Industry | F500 HQs | Revenue |
|---|---|---|
| Energy | 16 | $1,198B |
|
||
| Technology | 5 | $198B |
|
||
| Engineering / Construction | 4 | $72B |
|
||
| Energy Services | 3 | $60B |
|
||
| Utilities | 3 | $41B |
|
||
| Healthcare | 2 | $330B |
|
||
Price history
+167.9% since first listed6 events — show timeline
- 2026-06-17 Sold (MLS) — HARMLS
- 2026-05-27 Pending — HARMLS
- 2026-05-22 Pending — HARMLS
- 2026-05-14 Price Changed $209,000 HARMLS
- 2026-04-27 Listed $219,000 HARMLS
- 1990-04-01 Sold (Public Records) $78,000 Public Records
Property tax history
+6.7%/yrLatest (2025): $5,236 · +4.7% YoY. Source: county tax records.
Cash-flow waterfall
monthlySold comps — $/sqft
last 12 mo · ≤1 miLoading sold comps…