 🏷️ Likely Rental
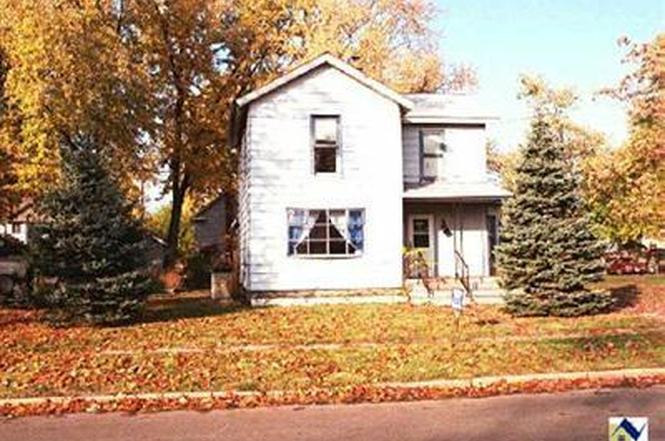
847 W 50th St · Ashtabula, OH
Flood risk 1/10 · Minimal
- FEMA flood zone
- X (unshaded)
- Chance of flooding over 30 yrs
- 0.0%
- Est. flood insurance / yr
- $473 – $860
Fire risk 1/10 · Minimal
- Est. fire insurance / yr
- $713 – $1,323
Heat risk 3/10 · Minor
- Hot days now (above 93°F)
- 7 days/yr
- Hot days in 30 yrs
- 18 days/yr
Wind risk 1/10 · Minimal
- Chance of severe wind over 30 yrs
- —
Air-quality risk 3/10 · Minor
- Unhealthy air days now
- 2 days/yr
- Unhealthy air days in 30 yrs
- 5 days/yr
Risk factors via First Street. Map © Google.
Why this score? — see what drove the B- grade
The composite is a weighted blend of 9 inputs, each scored 0–100. Each bar is that input's sub-score; the figure is the points it added to the 100-point composite (weight × sub-score).
- Cash flow +30.0/30.0
- 1% rule +10.0/10.0
- DSCR +10.0/10.0
- ARV discount +7.5/15.0
- Livability +3.6/5.0
- Rent growth +2.5/5.0
- Condition / age +2.5/5.0
- Schools +2.4/10.0
- Appreciation +0.0/10.0
$49,900
🖨 Deal sheet 📄 Offer letter ✓ Due diligence
Listing remarks
3 bedroom 1 bath home tenant occupied. Subject to probate court approval.
Key facts
- 8,712 sq ft lot
- Parking
- Built 1890
Neighborhood map
What this means for you Summary
Snapshot
- This is a 3-bed/1.5-bath single-family listed at $50k.
Deal economics
- At list price, monthly cash flow is $794 ($10k/yr) — positive.
- The deal already cash-flows at list — no discount required.
- Meets the 1% rule at list price ($1k rent vs $50k).
- Recommended offer: $49k (1.5% below list) — sets the bar for market timing.
- Cap rate 25.4% vs local median 8.2% in Ashtabula — top-decile yield for the area; either an underpriced asset or a hidden risk that comps aren't pricing in. Stress-test before assuming the spread holds.
Location & tenants
- Location reads 71/100 on livability (#420 in OH) — a middle-class / working-renter tenant base. Strengths: cost of living A+, health & safety A+, housing A; Watch: schools C-, amenities F, commute F.
- Ashtabula Area City (town): math 24% / reading 35% proficiency, ranked #588 of 656 in OH (top 90%) — low school quality limits family demand, transient renter base, plan for 1-2y turnover; 63% free/reduced lunch — lower-income household profile, screen leases tightly.
- Market conditions: 162 active listings in the ZIP; 155 units permitted in Ashtabula County in 2024 (0 in 5+ unit buildings).
- This rent runs 35% of the median local income ($50k/yr) — at the standard rent-burdened threshold; future hikes will face affordability resistance.
Forward outlook
- Local home prices are declining (-3.0%/yr); year-one equity from $345 of loan paydown is wiped out by about $1k of value loss. Plan a longer hold.
- Ashtabula County population projected at -22% by 2050 — secular population decline; favor cash flow + early exit over multi-decade hold.
- At projected returns (-3.0% appreciation + 3.0% rent growth), your $14k cash investment doubles in ~2 years — after that, you're playing with house money.
Negotiation context
- It's been on market 20 days — a 2% lower offer ($49k) is reasonable based on typical stale-listing flexibility.
- 5 sale attempts since 27y ago with the ask held roughly flat each time — persistent listings suggest the price (not the market) is what's stuck; bring a comps-based counter.
- Current owner paid $15k; list at $50k implies a 233% gain — meaningful room to come down on a strong offer.
Risks & watch-outs
- Watch-outs: built in 1890 — expect roof / HVAC / electrical / plumbing capex.
Questions for the listing agent
- Built in 1890 — when were the roof, HVAC, electrical panel, plumbing, and water heater last replaced?
- Is there a deadline driving the sale (1031 exchange, divorce, estate, relocation)? That informs how much negotiation room exists.
- What's the average days-on-market for RENTAL listings here right now (not sales)? A rising rental-DOM trend means longer vacancies and softer asking-rent achievability than the comps imply.
- What's the recent tenant-quality profile in this submarket — average credit score on applications, eviction rate, late-payment / NSF rate, and stable-employment percentage? A property-management company in the area should have these aggregated.
- How much new for-sale + rental construction is in the pipeline within 1–3 miles? Heavy new supply typically softens prices + rents 12–24 months out; constrained supply supports both.
Investment metrics
- 1% rule
- 2.87% ✓
- Cap rate
- 25.38%
- Cash-on-cash
- 68.16%
- DSCR
- 4.03
- GRM
- 2.9
CMA / ARV
- ARV (on-the-fly)
- $112,180
- Comps found
- 12
Show comp detail 12 sales within ~0.75 mi
| Address | Dist | Beds/Ba | Sqft | Sold | Price | $/sf | Match |
|---|---|---|---|---|---|---|---|
| 5508 Adams Ave | 0.34mi | 3/1.5 | 1,396 (-2%) | 8mo | $144,000 | $103 | 75 |
| 922 W 37th St | 0.45mi | 3/2.0 | 1,486 (+5%) | 2mo | $35,000 | $24 | 68 |
| 4601 West Ave | 0.26mi | 3/1.0 | 1,296 (-9%) | 7mo | $20,000 | $15 | 65 |
| 5705 Poplar | 0.45mi | 3/1.0 | 1,326 (-7%) | 1mo | $45,000 | $34 | 65 |
| 622 W 35th St | 0.67mi | 3/1.0 | 1,440 (+1%) | 1mo | $20,000 | $14 | 63 |
| 1022 W 51st St | 0.16mi | 4/1.0 (+1) | 1,584 (+12%) | 9mo | $146,000 | $92 | 59 |
| 933 W 37th St | 0.48mi | 4/1.5 (+1) | 1,296 (-9%) | 3mo | $103,000 | $79 | 56 |
| 5725 Main Ave | 0.59mi | 3/1.0 | 1,572 (+11%) | 1mo | $30,000 | $19 | 52 |
| 616 W 39th St | 0.56mi | 3/2.0 | 1,288 (-9%) | 8mo | $145,000 | $113 | 50 |
| 5730 West Ave | 0.49mi | 3/1.0 | 1,238 (-13%) | 6mo | $99,900 | $81 | 49 |
| 507 Bunker Hill Rd | 0.67mi | 3/1.5 | 1,232 (-13%) | 2mo | $65,000 | $53 | 45 |
| 112 Grove Dr | 0.64mi | 2/1.5 (-1) | 1,264 (-11%) | 5mo | $140,000 | $111 | 43 |
Match score weights: distance 35% · size 25% · config 20% · recency 20%. Top-matched comps best support the ARV.
Projected returns pro-forma
-3.0% appreciation · 3.0% rent growth · sell at horizon
- IRR
- 67.6%
- Equity multiple
- 4.04×
- Total profit
- $42,479
- Equity at exit
- $7,440
- IRR
- 71.7%
- Equity multiple
- 8.31×
- Total profit
- $102,151
- Equity at exit
- $4,314
Cash invested: $13,972 (down + closing). Projections, not guarantees.
Landlord ↔ Tenant lean methodology
- Overall (STATE)
- 73 Landlord-Friendly
- State Ohio
- 73 Landlord-Friendly · R+6
- County
- — inherits STATE
- City
- — inherits STATE
ZIP-level market 44004
- Home prices YoY
- -30.5%
- Active inventory
- 162
- Price-to-rent
- 2.9×
Monthly cashflow live
- Estimated rent
- $1,434 medium interval (Pro) →
- Mortgage (P&I)
- −$262
- Tax from tax record
- −$57 /mo · $682/yr
- Insurance
- −$21
- HOA
- −$0
- Vacancy / Maint / Mgmt
- −$301
- Net cashflow
- $794
Break-even live
UW: 25.0% down · 7.5% · 30yr · 1.5% tax · 5.0% vac · 8.0% maint · 8.0% mgmt
Financing live
Cash to close
- Down payment
- $12,475
- Closing costs
- $1,497
- Reserves months
- —
- Total cash needed
- —
Loan-product check · same deal, 3 products live
Conventional
25% down · 7.5% · 30yr
- Down + closing
- —
- Monthly P&I
- —
- Monthly cashflow
- —
- DSCR
- —
- Eligible?
- —
Personal DTI + credit; lowest rate.
DSCR
20% down · 8.5% · 30yr
- Down + closing
- —
- Monthly P&I
- —
- Monthly cashflow
- —
- DSCR
- —
- Eligible?
- —
No personal income docs; deal must DSCR.
Hard money
10% down · 12.0% · 12mo
- Down + closing
- —
- Monthly P&I
- —
- Monthly cashflow
- —
- DSCR
- —
- Eligible?
- —
Short-term bridge; refi at stabilization.
Listing history 17 events
-
2026-01-30status Pending
-
2026-01-08$49,900 Active
-
2018-03-30soldstatus $15,000
-
2011-02-09historical
-
2010-11-09$39,900
-
2010-10-30historical
-
2010-04-30$39,900
-
2003-02-06soldstatus $33,000
-
2003-02-05soldstatus $33,000
-
2003-02-03historical
-
2002-12-20soldstatus $30,000
-
2002-11-04$39,900
-
2000-05-26soldstatus $53,000
-
1999-07-09historical
-
1999-01-09$57,900
-
1995-09-11soldstatus $17,000
-
1991-09-03soldstatus $20,500
ⓘ Source: listings_history table (triggers on properties + properties_extension) + one-shot
backfill from property_details.listing_events for pre-trigger history.
Tax reassessment forecast OH · Partial reset (capped growth)
- Current annual tax
- $682 · $57/mo
- Projected year-2 tax
- $730 · $61/mo
- Expected delta
- +$48/yr (+$4/mo · 7.1%)
ⓘ Screening estimate from a state-policy table — verify with the county assessor before closing.
Climate risk First Street
- Flood 1/10 Low FEMA zone X (unshaded) · 0% chance over 30 yrs
- Wildfire 1/10 Low
- Heat 3/10 Moderate 7 d/yr ≥93°F today · 18 d/yr by 30 yrs out
- Wind 1/10 Low
- Air quality 3/10 Moderate 2 unhealthy d/yr today · 5 by 30 yrs out
Nearby sold comps map
Loading sold comps map…
Walkable amenities ~0.75 mi
Loading nearby amenities…
Taxation est. · year 1
- Rental income
- $17,209
- − Mortgage interest
- −$2,795
- − Property taxes
- −$682
- − Insurance
- −$250
- − Repairs & maintenance
- −$1,377
- − Management
- −$1,377
- − Depreciation
- −$1,452
- Taxable income
- $9,277
- Est. tax owed @ 24.0%
- −$2,227
- After-tax cash flow
- $7,297/yr
For passive investors: Depreciation is non-cash, so a rental often shows a tax loss while cash-flowing — sheltering income. Rental losses are passive: they offset passive income freely, and up to $25,000/yr can offset ordinary (W-2) income if you actively participate and your MAGI is under $100k (phasing out to $0 by $150k); unused losses carry forward. On sale, claimed depreciation is recaptured at up to 25%, and gains may owe capital-gains tax (a 1031 exchange can defer both). Figures are a year-1 estimate at your 24.0% rate — not tax advice; consult a CPA.
Schools (NCES district)
- District
- Ashtabula Area City
- NCES district ID
- 3904351
- Math proficiency
- 24% ▼ -27.00%
- Reading proficiency
- 35% ▼ -13.00%
- Median HH income
- $34,812
- Composite
- 24.3/100
- National rank
- #7712
- State rank
- #588 of 656 in OH
Livability — Ashtabula
- Score
- 71/100
- State rank
- #420
- US rank
- #6883
Category grades
Schools grade is shown separately in the Schools card above.
Census & demographics
- Census place
- Ashtabula, OH
- County
- Ashtabula · 97,617 people
- City population
- 31,076
- Metro
- Cleveland, OH
- Population (ZIP)
- 31,076
- Household income
- $49,507
- Rent vs Own
- Severe rent burden
- 14.1
Population outlook (Ashtabula County) Hauer SSP2
- Today (2025)
- 92,950 people
- By 2030
- 89,146 · -4.1%
- By 2040
- 80,715 · -13.2%
- By 2050
- 72,270 · -22.2%
- By 2075
- 55,780 · -40.0%
- By 2100
- 40,928 · -56.0%
Race, ethnicity, and origin ACS 2023
- Neighborhood character
- Predominantly White (79%)
- Race & ethnicity
- White 79% Hispanic / Latino 9% Two or more races 7% Black 6%
- Hispanic origin (detail)
- Mexican 3% Puerto Rican 5%
- Common ancestry
- Romanian 4% Iranian 2% Slovak 1%
- Foreign-born
- 3% · Canada
- Languages at home
- 94% English-only · Spanish 4%
Political lean MEDSL · Ashtabula
- 2024 margin
- Strong R (+28.4) · D 35.4% · R 63.8%
- 2008→2024 swing
- -41.9pp toward R · 2008: 13.5pp · 2024: -28.4pp
- All cycles
- 2024: R+28.4 2020: R+23.5 2016: R+19.0 2012: D+12.1 2008: D+13.5
Not yet ingested
- Civics
- —
Market trends
- HPI YoY
- ▼ -114.51%
- Current HPI
- 260.7146
- Rent YoY
- —
- Metro
- —
- State GDP YoY
- ▲ 1.98%
- F500 in state
- 48
Industry mix (Fortune 500 HQ in OH)
| Industry | F500 HQs | Revenue |
|---|---|---|
| Insurance | 3 | $145B |
|
||
| Industrial Machinery | 3 | $49B |
|
||
| Financial Services | 3 | $24B |
|
||
| Consumer Goods | 2 | $93B |
|
||
| Aerospace / Defense | 2 | $47B |
|
||
| Utilities | 2 | $33B |
|
||
Price history
+143.4% since first listed17 events — show timeline
- 2026-01-30 Pending — MLSNOW
- 2026-01-08 Listed $49,900 MLSNOW
- 2018-03-30 Sold (Public Records) $15,000 Public Records
- 2011-02-09 Listing Removed — MLSNOW
- 2010-11-09 Listed $39,900 MLSNOW
- 2010-10-30 Listing Removed — MLSNOW
- 2010-04-30 Listed $39,900 MLSNOW
- 2003-02-06 Sold (MLS) $33,000 MLSNOW
- 2003-02-05 Sold (Public Records) $33,000 Public Records
- 2003-02-03 Listing Removed — MLSNOW
- 2002-12-20 Sold (Public Records) $30,000 Public Records
- 2002-11-04 Listed $39,900 MLSNOW
- 2000-05-26 Sold (Public Records) $53,000 Public Records
- 1999-07-09 Listing Removed — MLSNOW
- 1999-01-09 Listed $57,900 MLSNOW
- 1995-09-11 Sold (Public Records) $17,000 Public Records
- 1991-09-03 Sold (Public Records) $20,500 Public Records
Property tax history
-2.5%/yrLatest (2025): $682 · +22.2% YoY. Source: county tax records.
Cash-flow waterfall
monthlySold comps — $/sqft
last 12 mo · ≤1 miLoading sold comps…