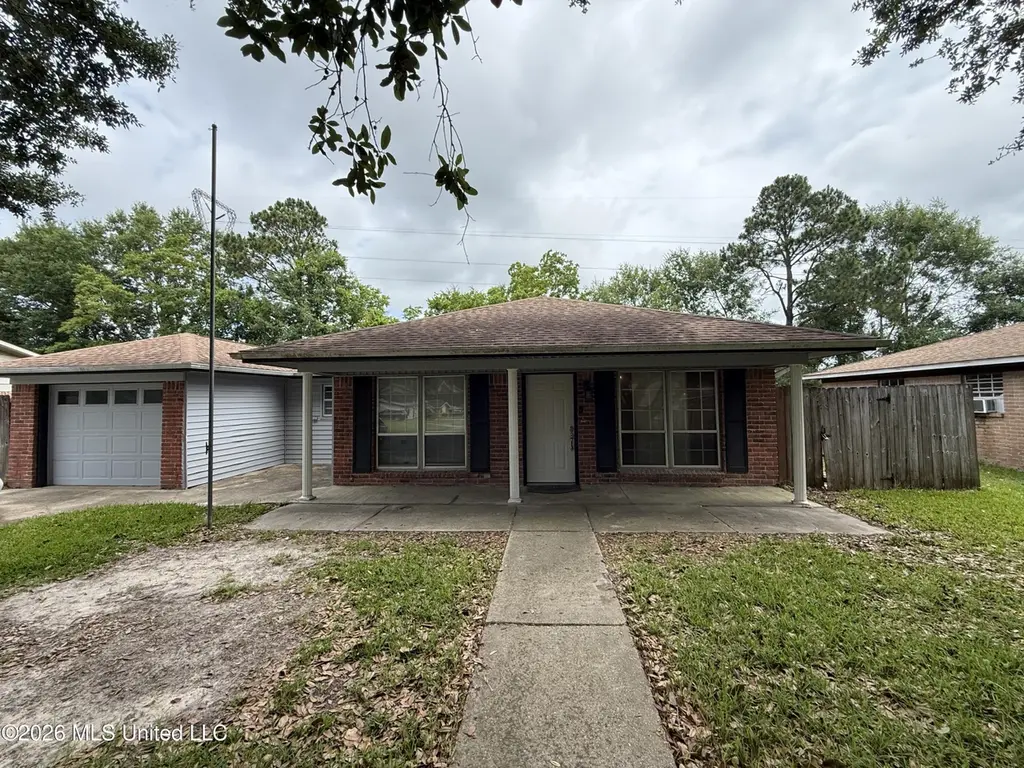
4307 Yosemite Dr · Ocean Springs, MS
Flood risk 1/10 · Minimal
- FEMA flood zone
- X (unshaded)
- Chance of flooding over 30 yrs
- 0.0%
- Est. flood insurance / yr
- $507 – $1,088
Fire risk 6/10 · Moderate
- Est. fire insurance / yr
- $1,241 – $2,305
Heat risk 10/10 · Severe
- Hot days now (above 107°F)
- 7 days/yr
- Hot days in 30 yrs
- 23 days/yr
Wind risk 9/10 · Severe
- Chance of severe wind over 30 yrs
- 99.0%
Air-quality risk 2/10 · Minimal
- Unhealthy air days now
- 1 days/yr
- Unhealthy air days in 30 yrs
- 2 days/yr
Risk factors via First Street. Map © Google.
Why this score? — see what drove the C+ grade
The composite is a weighted blend of 9 inputs, each scored 0–100. Each bar is that input's sub-score; the figure is the points it added to the 100-point composite (weight × sub-score).
- Cash flow +21.5/30.0
- ARV discount +15.0/15.0
- DSCR +6.9/10.0
- Schools +5.3/10.0
- 1% rule +5.2/10.0
- Livability +4.3/5.0
- Rent growth +2.8/5.0
- Condition / age +2.5/5.0
- Appreciation +0.0/10.0
$174,900
🖨 Deal sheet 📄 Offer letter ✓ Due diligence
Listing remarks
Affordable and adorable! This all brick home sits in the established Parktown East subdivision of Ocean Springs and needs minimal touchups to make your own. With three bedrooms and a functional layout that includes dining, living, and enclosed back patio/game room- see how this home is ideal for first time homeowners, rental enthusiasts, and those seeking affordable options with a home that requires no flood insurance. The home has back patio access from the master bedroom, covered front porch, and a small courtyard like area with access just off the dining room. Home features a two year old HVAC and a well maintained roof- leaving your costs dedicated to personal touches! Schedule your tou
Key facts
- Covered front porch
- Small courtyard area
- Brick home
Tags
Property features AI
Finance
- HOA & community: Playground; Sports fields
Exterior
- Parking: Garage (1 space)
- Utilities: Public water; Public sewer; Electricity connected; Natural gas connected
- Home design: Single family residence (house); One level
- Construction: Brick construction; Slab foundation; Architectural shingle roof; Built (year source: public records)
- Exterior features: Enclosed patio/porch; Shed(s)
Interior
- Kitchen: Dishwasher; Oven; Refrigerator
- Flooring: Tile
- Bathrooms: 1 full bathroom; Total bathrooms: 2 (1.75 recorded)
- Heating & cooling: Central heating; Central air conditioning
- Interior features: Dishwasher; Oven; Refrigerator; Tile flooring
Neighborhood map
What this means for you Summary
Snapshot
- This is a 3-bed/2.0-bath single-family listed at $175k.
Deal economics
- At list price, monthly cash flow is $262 ($3k/yr) — positive.
- The deal already cash-flows at list — no discount required.
- Meets the 1% rule at list price ($2k rent vs $175k).
- Recommended offer: $172k (1.5% below list) — sets the bar for market timing.
- Cap rate 8.1% vs local median 4.2% in Ocean Springs — top-decile yield for the area; either an underpriced asset or a hidden risk that comps aren't pricing in. Stress-test before assuming the spread holds.
Location & tenants
- Location reads 86/100 on livability (#2 in MS, #420 nationally) — a professional / high-income tenant draw. Strengths: crime A+, amenities A+, cost of living A+; Watch: commute F.
- Ocean Springs School District (suburban): math 64% / reading 59% proficiency, ranked #1 of 130 in MS (top 1%) — acceptable for families but not a draw, mixed tenant base, ~2y average lease.
- Market conditions: Rents rising (+1.3%/yr); 714 active listings in the ZIP; 9 comparable units currently listed for rent nearby; rentals at typical pace (median 21d on market — plan ~3-4 weeks tenant-placement turnaround); solid renter incomes; 516 units permitted in Jackson County in 2024 (6 in 5+ unit buildings).
Forward outlook
- Local home prices are declining (-3.0%/yr); year-one equity from $1k of loan paydown is wiped out by about $5k of value loss. Plan a longer hold.
Negotiation context
- It's been on market 17 days — a 2% lower offer ($172k) is reasonable based on typical stale-listing flexibility.
- 2 sale attempts since 2y ago with the ask held roughly flat each time — persistent listings suggest the price (not the market) is what's stuck; bring a comps-based counter.
Risks & watch-outs
- Climate carrying-cost: severe wind risk, 99% chance of damaging wind over 30y; major wildfire risk; extreme-heat days projected 7→23/yr by 2055 (HVAC capex compounding) — expect insurance premiums to compound above CPI over the hold.
Questions for the listing agent
- Built in 1973 — when were the roof, HVAC, electrical panel, plumbing, and water heater last replaced?
- Is there a deadline driving the sale (1031 exchange, divorce, estate, relocation)? That informs how much negotiation room exists.
- Schools are B-rated — typically a magnet for longer-tenancy family renters. What's the average tenant stay here, and is there a school-zone premium baked into asking?
- What's the average days-on-market for RENTAL listings here right now (not sales)? A rising rental-DOM trend means longer vacancies and softer asking-rent achievability than the comps imply.
- What's the recent tenant-quality profile in this submarket — average credit score on applications, eviction rate, late-payment / NSF rate, and stable-employment percentage? A property-management company in the area should have these aggregated.
- How much new for-sale + rental construction is in the pipeline within 1–3 miles? Heavy new supply typically softens prices + rents 12–24 months out; constrained supply supports both.
Investment metrics
- 1% rule
- 1.02% ✓
- Cap rate
- 8.09%
- Cash-on-cash
- 6.42%
- DSCR
- 1.29
- GRM
- 8.1
CMA / ARV
- ARV (on-the-fly)
- $212,148
- Comps found
- 12
Show comp detail 12 sales within ~0.75 mi
| Address | Dist | Beds/Ba | Sqft | Sold | Price | $/sf | Match |
|---|---|---|---|---|---|---|---|
| 4213 Yosemite Dr | 0.10mi | 3/1.5 | 1,247 (-2%) | 8mo | $175,000 | $140 | 83 |
| 1317 Chalmette Ave | 0.27mi | 3/2.0 | 1,300 (+2%) | 9mo | $180,000 | $138 | 77 |
| 103 Grand Teton Dr | 0.25mi | 4/1.2 (+1) | 1,235 (-3%) | 0mo | $199,900 | $162 | 74 |
| 115 Yellowstone Cir | 0.31mi | 3/2.0 | 1,291 (+1%) | 16mo | $214,500 | $166 | 70 |
| 120 Yellowstone Cir | 0.30mi | 3/1.5 | 1,200 (-6%) | 8mo | $199,800 | $167 | 67 |
| 207 April Ln | 0.59mi | 3/2.0 | 1,275 (-0%) | 6mo | $239,000 | $187 | 67 |
| 105 Gettysburg Cir | 0.36mi | 3/1.5 | 1,330 (+4%) | 13mo | $167,500 | $126 | 64 |
| 8813 Stonewall St | 0.54mi | 3/2.0 | 1,300 (+2%) | 11mo | $179,990 | $138 | 63 |
| 1310 Deana Rd | 0.61mi | 3/2.0 | 1,273 (-0%) | 12mo | $219,000 | $172 | 60 |
| 8708 Old Ccc Camp Rd | 0.30mi | 3/2.0 | 1,089 (-15%) | 2mo | $92,000 | $84 | 60 |
| 414 Woodward Dr | 0.50mi | 3/2.0 | 1,212 (-5%) | 11mo | $217,000 | $179 | 59 |
| 4110 Groveland Rd | 0.38mi | 3/2.0 | 1,141 (-11%) | 9mo | $189,500 | $166 | 57 |
Match score weights: distance 35% · size 25% · config 20% · recency 20%. Top-matched comps best support the ARV.
Projected returns pro-forma
-3.0% appreciation · 1.31% rent growth · sell at horizon
- IRR
- -8.3%
- Equity multiple
- 0.70×
- Total profit
- $-14,649
- Equity at exit
- $26,078
- IRR
- -1.0%
- Equity multiple
- 0.94×
- Total profit
- $-3,172
- Equity at exit
- $15,122
Cash invested: $48,972 (down + closing). Projections, not guarantees.
Landlord ↔ Tenant lean methodology
- Overall (STATE)
- 90 Strongly Landlord-Friendly
- State Mississippi
- 90 Strongly Landlord-Friendly · R+11
- County
- — inherits STATE
- City
- — inherits STATE
ZIP-level market 39564
- Home prices YoY
- -26.8%
- Rents YoY
- 1.3%
- Active inventory
- 714
- Price-to-rent
- 8.1×
Monthly cashflow live
- Estimated rent
- $1,792 high interval (Pro) →
- Mortgage (P&I)
- −$917
- Tax from tax record
- −$164 /mo · $1,965/yr
- Insurance
- −$73
- HOA
- −$0
- Vacancy / Maint / Mgmt
- −$376
- Net cashflow
- $262
Break-even live
UW: 25.0% down · 7.5% · 30yr · 1.5% tax · 5.0% vac · 8.0% maint · 8.0% mgmt
Financing live
Cash to close
- Down payment
- $43,725
- Closing costs
- $5,247
- Reserves months
- —
- Total cash needed
- —
Loan-product check · same deal, 3 products live
Conventional
25% down · 7.5% · 30yr
- Down + closing
- —
- Monthly P&I
- —
- Monthly cashflow
- —
- DSCR
- —
- Eligible?
- —
Personal DTI + credit; lowest rate.
DSCR
20% down · 8.5% · 30yr
- Down + closing
- —
- Monthly P&I
- —
- Monthly cashflow
- —
- DSCR
- —
- Eligible?
- —
No personal income docs; deal must DSCR.
Hard money
10% down · 12.0% · 12mo
- Down + closing
- —
- Monthly P&I
- —
- Monthly cashflow
- —
- DSCR
- —
- Eligible?
- —
Short-term bridge; refi at stabilization.
Rent comps 9 comps
| Address | Beds | Baths | Sqft | Rent | $/sqft | DOM | Units | Dist |
|---|---|---|---|---|---|---|---|---|
| 132 Gettysburg Cir Ocean Springs, MS | 4.0 | 3.0 | 1689 | $2,195 | $1.30 | 21d | 1 | 0.39mi |
| 3910 Yosemite Dr Ocean Springs, MS | 3.0 | 2.0 | 1070 | $1,595 | $1.49 | 44d | 1 | 0.51mi |
| 1200 Deana Rd Ocean Springs, MS | 2.0 | 2.0 | 1063 | $1,296 | $1.22 | 21d | 1 | 0.58mi |
| 1200 Deana Rd Ocean Springs, MS | 2.0 | 2.0 | 1063 | $1,337 | $1.26 | 44d | 1 | 0.58mi |
| 1200 Deana Rd Ocean Springs, MS | 2.0 | 2.0 | 1063 | $1,405 | $1.32 | 13d | 1 | 0.58mi |
| 4730 Gibson Rd Ocean Springs, MS | 2.0 | 1.0 | 1010 | $1,205 | $1.19 | 21d | 1 | 0.64mi |
| 3825 Timberlake Dr Ocean Springs, MS | 3.0 | 2.0 | 1640 | $2,200 | $1.34 | 21d | 1 | 0.78mi |
| 3500 Groveland Rd Ocean Springs, MS | 2.0–3.0 | 2.0 | 1173 | $1,750 | $1.49 | 13d | 1 | 1.27mi |
| 1221 King Henry Dr Ocean Springs, MS | 3.0 | 2.0 | 1599 | $1,800 | $1.13 | 44d | 1 | 1.43mi |
Listing history 12 events
-
2026-06-18days on market $174,900 Active 17 DOM
-
2026-06-17days on market $174,900 Active 16 DOM
-
2026-06-16days on market $174,900 Active 15 DOM
-
2026-06-15status $174,900 Active 14 DOM
-
2026-06-07statusdays on market $174,900 Pending 14 DOM
-
2026-06-02days on market $174,900 Active 11 DOM
-
2026-06-01days on market $174,900 Active 10 DOM
-
2026-05-31days on market $174,900 Active 9 DOM
-
2026-05-30pricedays on market $174,900 Active 8 DOM
-
2026-05-22$179,900 Active
-
2024-10-16historical $1,600
-
2024-09-24$1,600
ⓘ Source: listings_history table (triggers on properties + properties_extension) + one-shot
backfill from property_details.listing_events for pre-trigger history.
Tax reassessment forecast MS · Resets to sale price
- Current annual tax
- $1,965 · $164/mo
- Projected year-2 tax
- $1,965 · $164/mo
- Expected delta
- $0/yr ($0/mo · 0.0%)
ⓘ Screening estimate from a state-policy table — verify with the county assessor before closing.
Climate risk First Street
- Flood 1/10 Low FEMA zone X (unshaded) · 0% chance over 30 yrs
- Wildfire 6/10 Major
- Heat 10/10 Extreme 7 d/yr ≥107°F today · 23 d/yr by 30 yrs out
- Wind 9/10 Extreme 99% chance of damaging wind over 30 yrs
- Air quality 2/10 Low 1 unhealthy d/yr today · 2 by 30 yrs out
Nearby sold comps map
Loading sold comps map…
Walkable amenities ~0.75 mi
Loading nearby amenities…
Taxation est. · year 1
- Rental income
- $21,508
- − Mortgage interest
- −$9,797
- − Property taxes
- −$1,965
- − Insurance
- −$874
- − Repairs & maintenance
- −$1,721
- − Management
- −$1,721
- − Depreciation
- −$5,088
- Taxable income
- $343
- Est. tax owed @ 24.0%
- −$82
- After-tax cash flow
- $3,064/yr
For passive investors: Depreciation is non-cash, so a rental often shows a tax loss while cash-flowing — sheltering income. Rental losses are passive: they offset passive income freely, and up to $25,000/yr can offset ordinary (W-2) income if you actively participate and your MAGI is under $100k (phasing out to $0 by $150k); unused losses carry forward. On sale, claimed depreciation is recaptured at up to 25%, and gains may owe capital-gains tax (a 1031 exchange can defer both). Figures are a year-1 estimate at your 24.0% rate — not tax advice; consult a CPA.
Schools (NCES district)
- District
- Ocean Springs School District
- NCES district ID
- 2803360
- Math proficiency
- 64% ▼ -3.00%
- Reading proficiency
- 59% ▲ 1.00%
- Median HH income
- $60,485
- Composite
- 53.35/100
- National rank
- #1477
- State rank
- #1 of 130 in MS
Livability — Ocean Springs
- Score
- 86/100
- State rank
- #2
- US rank
- #420
Category grades
Schools grade is shown separately in the Schools card above.
Census & demographics
- Census place
- Ocean Springs, MS
- County
- Jackson County · 82,196 people
- City population
- 43,240
- Metro
- Gulfport-Biloxi, MS
- Population (ZIP)
- 43,240
- Household income
- $78,596
- Rent vs Own
- Severe rent burden
- 734.0
Population outlook (Jackson County) Hauer SSP2
- Today (2025)
- 146,926 people
- By 2030
- 148,442 · +1.0%
- By 2040
- 149,631 · +1.8%
- By 2050
- 148,723 · +1.2%
- By 2075
- 147,845 · +0.6%
- By 2100
- 144,510 · -1.6%
Race, ethnicity, and origin ACS 2023
- Neighborhood character
- Predominantly White (74%)
- Race & ethnicity
- White 74% Black 10% Hispanic / Latino 8% Two or more races 7% Asian 4%
- Hispanic origin (detail)
- Mexican 3% Puerto Rican 2%
- Common ancestry
- Lithuanian 5% Slovak 4% Romanian 2%
- Foreign-born
- 5% · Canada, South Korea, Vietnam
- Languages at home
- 93% English-only · Spanish 3% Vietnamese 2% Tagalog/Filipino 1%
Political lean MEDSL · Jackson
- 2024 margin
- Solid R (+39.9) · D 29.5% · R 69.4% · Other 1.1%
- 2008→2024 swing
- -6.4pp toward R · 2008: -33.5pp · 2024: -39.9pp
- All cycles
- 2024: R+39.9 2020: R+34.6 2016: R+39.9 2012: R+36.1 2008: R+33.5
Not yet ingested
- Civics
- —
Market trends
- HPI YoY
- ▼ -74.77%
- Current HPI
- 204.2244
- Rent YoY
- ▲ 1.31%
- Metro
- Gulfport-Biloxi, MS
- State GDP YoY
- —
- F500 in state
- 0
Price history
+11143.8% since first listed3 events — show timeline
- 2026-05-22 Listed $179,900 MLSU
- 2024-10-16 Rental Removed $1,600 MLSU
- 2024-09-24 Listed for Rent $1,600 MLSU
Property tax history
+12.0%/yrLatest (2025): $1,965 · +6.4% YoY. Source: county tax records.
Cash-flow waterfall
monthlySold comps — $/sqft
last 12 mo · ≤1 miLoading sold comps…