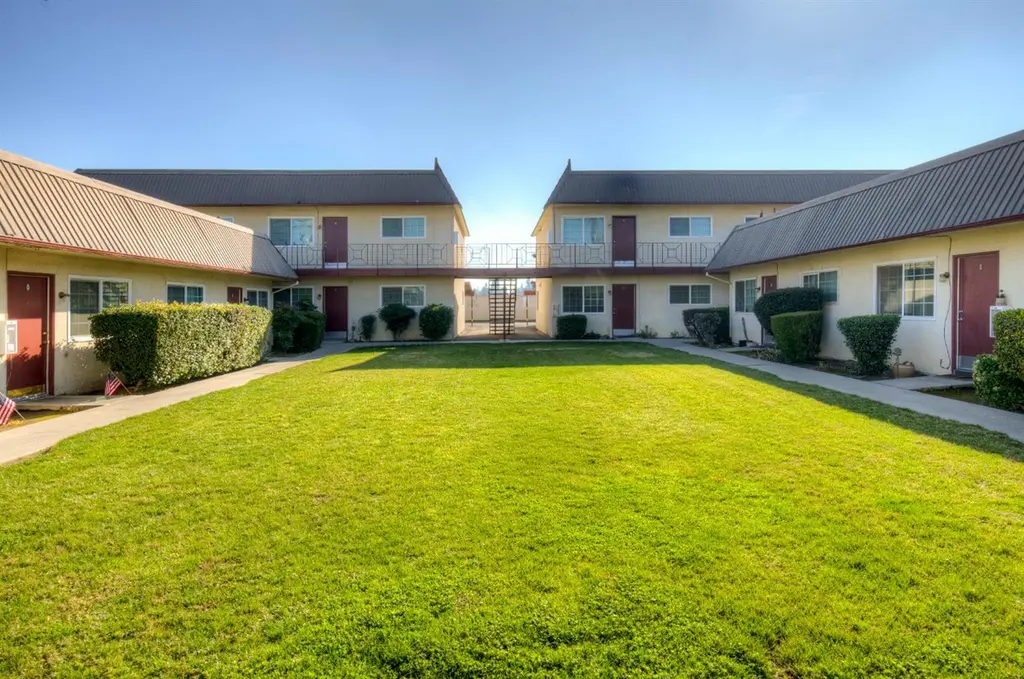
 16-Plex
1228 Jefferson Ave · Clovis, CA
Flood risk 1/10 · Minimal
- FEMA flood zone
- X (unshaded)
- Chance of flooding over 30 yrs
- 0.0%
- Est. flood insurance / yr
- $507 – $1,088
Fire risk 1/10 · Minimal
- Est. fire insurance / yr
- $659 – $1,223
Heat risk 8/10 · Major
- Hot days now (above 105°F)
- 7 days/yr
- Hot days in 30 yrs
- 17 days/yr
Wind risk 1/10 · Minimal
- Chance of severe wind over 30 yrs
- —
Air-quality risk 10/10 · Severe
- Unhealthy air days now
- 57 days/yr
- Unhealthy air days in 30 yrs
- 60 days/yr
Risk factors via First Street. Map © Google.
Why this score? — see what drove the D+ grade
The composite is a weighted blend of 9 inputs, each scored 0–100. Each bar is that input's sub-score; the figure is the points it added to the 100-point composite (weight × sub-score).
- Cash flow +17.7/30.0
- ARV discount +7.5/15.0
- Schools +5.9/10.0
- DSCR +5.5/10.0
- Livability +3.8/5.0
- 1% rule +3.7/10.0
- Rent growth +3.2/5.0
- Condition / age +2.5/5.0
- Appreciation +0.0/10.0
$2,995,000
🖨 Deal sheet (PDF) 📄 Offer letter ✓ Due diligence
Multi-family units
County records classify this as Multi-Family (5+ Unit). Listing-text estimate: 16 units. confirmed
5+ unit building — per-unit beds/baths from public records are typically unavailable; the breakdown below (if shown) is an estimate from the listing text.
Listing remarks MLS
This well-maintained 16-unit multifamily property, located in the highly sought-after city of Clovis, presents an exceptional investment opportunity with both strong in-place income and future upside. The property is currently generating approximately $16,572 per month in gross rents, with clear potential to increase income by aligning rents with current market rates.Comprised of sixteen spacious 2-bedroom, 1-bathroom unitseach approximately 750 square feetthe property is in turnkey condition, offering minimal maintenance needs and a smooth transition for new ownership. An on-site laundry facility provides added convenience for tenants and an additional income stream for the owner.Set in a prime location with high rental demand, this asset offers investors immediate cash flow along with the opportunity for long-term appreciation and value growth. Don't miss the chance to acquire a consistent, high-performing asset in one of the Central Valley's most desirable rental markets.
Key facts
- Multifamily property
- Turnkey condition
- High rental demand
Tags
Neighborhood map
What this means for you Summary
Snapshot
- This is a 16 × 2-bed/1.0-bath units multifamily listed at $3.00M.
Deal economics
- At list price, monthly cash flow is $2k ($29k/yr) — positive. Per door: $151/mo.
- The deal already cash-flows at list — no discount required.
- To meet the 1% rule (rent ≥ 1% of price), the offer needs to be $2.60M (13.2% below list).
- Recommended offer: $2.60M (13.2% below list) — sets the bar for 1% rule.
- Cap rate 7.3% vs local median 3.0% in Clovis — top-decile yield for the area; either an underpriced asset or a hidden risk that comps aren't pricing in. Stress-test before assuming the spread holds.
Location & tenants
- Location reads 76/100 on livability (#92 in CA, #3,307 nationally) — a middle-class / working-renter tenant base. Strengths: commute A+, housing A+, employment A; Watch: amenities C-, health & safety D, cost of living F.
- Clovis Unified (suburban): math 58% / reading 72% proficiency, ranked #152 of 1,400 in CA (top 11%) — acceptable for families but not a draw, mixed tenant base, ~2y average lease.
- Zoned schools: Jefferson Elementary (582 students, 73% FRL); Clark Intermediate (1,462 students, 61% FRL); Clovis High (2,905 students, 48% FRL) — zoned schools average 61% FRL vs 32% district-wide (29 pts higher); higher-poverty schools than district average — tighter screening recommended.
- Market conditions: Rents rising (+2.6%/yr); 86 active listings in the ZIP; 2,426 units permitted in Fresno County in 2024 (296 in 5+ unit buildings).
- At $26,010/mo this rent would consume 468% of the median local household income ($67k/yr) (locally 2487% of renters already pay >50% of income on rent) — very limited rent-growth headroom before tenants either downsize or default.
Forward outlook
- Local home prices are declining (-3.0%/yr); year-one equity from $21k of loan paydown is wiped out by about $90k of value loss. Plan a longer hold.
- Fresno County population projected at +11% by 2050 — modest demand growth; plan on rents tracking national, not racing it.
Negotiation context
- It's been on market 151 days — a 12% lower offer ($2.64M) is reasonable based on typical stale-listing flexibility.
- Current owner paid $1.02M; list at $3.00M implies a 192% gain — meaningful room to come down on a strong offer.
Risks & watch-outs
- Climate carrying-cost: extreme-heat days projected 7→17/yr by 2055 (HVAC capex compounding) — expect insurance premiums to compound above CPI over the hold.
Questions for the listing agent
- It's been on market 151 days. Have you received any prior offers? Is the seller open to a 13% concession, seller financing, or rate buy-down credit?
- Can we see the unit-by-unit rent roll, current vacancy, and any below-market leases? What's the average tenancy length?
- What capital expenditures (roof, boiler, parking lot, exteriors) have been made in the last 5 years, and what's planned in the next 2?
- Built in 1965 — when were the roof, HVAC, electrical panel, plumbing, and water heater last replaced?
- Why hasn't it sold? Are there any deal-killer items the seller is aware of (foundation, flood, title, zoning, code violations)?
- Is there a deadline driving the sale (1031 exchange, divorce, estate, relocation)? That informs how much negotiation room exists.
- Schools are B-rated — typically a magnet for longer-tenancy family renters. What's the average tenant stay here, and is there a school-zone premium baked into asking?
- The area grade is low — what's the realistic commute time and amenity access for the typical tenant pool here? Any planned neighborhood developments (good or bad) we should know about?
- What's the average days-on-market for RENTAL listings here right now (not sales)? A rising rental-DOM trend means longer vacancies and softer asking-rent achievability than the comps imply.
- What's the recent tenant-quality profile in this submarket — average credit score on applications, eviction rate, late-payment / NSF rate, and stable-employment percentage? A property-management company in the area should have these aggregated.
- How much new apartment / multifamily construction is in the pipeline within 1–3 miles? Heavy new supply (>2% of stock underway) typically softens rents 12–24 months out; light construction supports rent growth.
Investment metrics
- 1% rule
- 0.87% ✗
- Cap rate
- 7.26%
- Cash-on-cash
- 3.45%
- DSCR
- 1.15
- GRM
- 9.6
CMA / ARV
No comps found within radius.
Projected returns pro-forma
-3.0% appreciation · 2.65% rent growth · sell at horizon
- IRR
- -11.3%
- Equity multiple
- 0.59×
- Total profit
- $-342,125
- Equity at exit
- $446,564
- IRR
- -2.6%
- Equity multiple
- 0.83×
- Total profit
- $-142,246
- Equity at exit
- $258,953
Cash invested: $838,600 (down + closing). Projections, not guarantees.
Landlord ↔ Tenant lean methodology
- Overall (STATE)
- 18 Strongly Tenant-Friendly
- State California
- 18 Strongly Tenant-Friendly · D+13
- County
- — inherits STATE
- City
- — inherits STATE
ZIP-level market 93612
- Rents YoY
- 2.6%
- Active inventory
- 86
- Price-to-rent
- 153.5×
Monthly cashflow live
- Estimated rent
- $26,010 high interval (Pro) →
- Mortgage (P&I)
- −$15,706
- Tax from tax record
- −$1,184 /mo · $14,205/yr
- Insurance
- −$1,248
- HOA
- −$0
- Vacancy / Maint / Mgmt
- −$5,462
- Net cashflow
- $2,410
Break-even live
Sensitivity live
| Price | -10% $4,106 | -5% $3,258 | +0% $2,410 | +5% $1,562 | +10% $715 |
|---|---|---|---|---|---|
| Rent | -10% $355 | -5% $1,383 | +0% $2,410 | +5% $3,438 | +10% $4,465 |
| Rate | -1.0pp $3,918 | -0.5pp $3,172 | base $2,410 | +0.5pp $1,634 | +1.0pp $845 |
16-unit breakdown (identical units grouped — click to expand)
| Units | Beds | Baths | Est. rent |
|---|---|---|---|
| 16× units | 2 | 1 | $26,016 |
| #1 | 2 | 1 | $1,626 |
| #2 | 2 | 1 | $1,626 |
| #3 | 2 | 1 | $1,626 |
| #4 | 2 | 1 | $1,626 |
| #5 | 2 | 1 | $1,626 |
| #6 | 2 | 1 | $1,626 |
| #7 | 2 | 1 | $1,626 |
| #8 | 2 | 1 | $1,626 |
| #9 | 2 | 1 | $1,626 |
| #10 | 2 | 1 | $1,626 |
| #11 | 2 | 1 | $1,626 |
| #12 | 2 | 1 | $1,626 |
| #13 | 2 | 1 | $1,626 |
| #14 | 2 | 1 | $1,626 |
| #15 | 2 | 1 | $1,626 |
| #16 | 2 | 1 | $1,626 |
| Total (16 units) | $26,010 | ||
UW: 25.0% down · 7.5% · 30yr · 1.5% tax · 5.0% vac · 8.0% maint · 8.0% mgmt
Financing live
Cash to close
- Down payment
- $748,750
- Closing costs
- $89,850
- Reserves months
- —
- Total cash needed
- —
Loan-product check · same deal, 3 products live
Conventional
25% down · 7.5% · 30yr
- Down + closing
- —
- Monthly P&I
- —
- Monthly cashflow
- —
- DSCR
- —
- Eligible?
- —
Personal DTI + credit; lowest rate.
DSCR
20% down · 8.5% · 30yr
- Down + closing
- —
- Monthly P&I
- —
- Monthly cashflow
- —
- DSCR
- —
- Eligible?
- —
No personal income docs; deal must DSCR.
Hard money
10% down · 12.0% · 12mo
- Down + closing
- —
- Monthly P&I
- —
- Monthly cashflow
- —
- DSCR
- —
- Eligible?
- —
Short-term bridge; refi at stabilization.
Listing history 19 events
-
2026-06-21days on market $2,995,000 Active 151 DOM
-
2026-06-18days on market $2,995,000 Active 148 DOM
-
2026-06-17days on market $2,995,000 Active 147 DOM
-
2026-06-16days on market $2,995,000 Active 146 DOM
-
2026-06-15days on market $2,995,000 Active 145 DOM
-
2026-06-13days on market $2,995,000 Active 143 DOM
-
2026-06-13days on market $2,995,000 Active 142 DOM
-
2026-06-10days on market $2,995,000 Active 140 DOM
-
2026-06-09days on market $2,995,000 Active 139 DOM
-
2026-06-08days on market $2,995,000 Active 138 DOM
-
2026-06-07days on market $2,995,000 Active 137 DOM
-
2026-06-05days on market $2,995,000 Active 134 DOM
-
2026-06-03days on market $2,995,000 Active 133 DOM
-
2026-06-02days on market $2,995,000 Active 132 DOM
-
2026-06-01days on market $2,995,000 Active 131 DOM
-
2026-05-31days on market $2,995,000 Active 130 DOM
-
2026-01-21$2,995,000 Active 989-char remark
Show marketing remark (989 chars)
This well-maintained 16-unit multifamily property, located in the highly sought-after city of Clovis, presents an exceptional investment opportunity with both strong in-place income and future upside. The property is currently generating approximately $16,572 per month in gross rents, with clear potential to increase income by aligning rents with current market rates.Comprised of sixteen spacious 2-bedroom, 1-bathroom unitseach approximately 750 square feetthe property is in turnkey condition, offering minimal maintenance needs and a smooth transition for new ownership. An on-site laundry facility provides added convenience for tenants and an additional income stream for the owner.Set in a prime location with high rental demand, this asset offers investors immediate cash flow along with the opportunity for long-term appreciation and value growth. Don't miss the chance to acquire a consistent, high-performing asset in one of the Central Valley's most desirable rental markets.
-
2017-02-03soldstatus $1,025,000
-
1999-01-15soldstatus $409,250
ⓘ Source: listings_history table (triggers on properties + properties_extension) + one-shot
backfill from property_details.listing_events for pre-trigger history.
Tax reassessment forecast CA · Resets to sale price
- Current annual tax
- $14,205 · $1,184/mo
- Projected year-2 tax
- $22,762 · $1,897/mo
- Expected delta
- +$8,557/yr (+$713/mo · 60.2%)
ⓘ Screening estimate from a state-policy table — verify with the county assessor before closing.
Climate risk First Street
- Flood 1/10 Low FEMA zone X (unshaded) · 0% chance over 30 yrs
- Wildfire 1/10 Low
- Heat 8/10 Severe 7 d/yr ≥105°F today · 17 d/yr by 30 yrs out
- Wind 1/10 Low
- Air quality 10/10 Extreme 57 unhealthy d/yr today · 60 by 30 yrs out
Nearby sold comps map
Loading sold comps map…
Walkable amenities ~0.75 mi
Loading nearby amenities…
Taxation est. · year 1
- Rental income
- $312,120
- − Mortgage interest
- −$167,767
- − Property taxes
- −$14,205
- − Insurance
- −$14,975
- − Repairs & maintenance
- −$24,970
- − Management
- −$24,970
- − Depreciation
- −$87,127
- Taxable loss
- −$21,893
- Est. tax savings @ 24.0%
- +$5,254
- After-tax cash flow
- $34,176/yr
For passive investors: Depreciation is non-cash, so a rental often shows a tax loss while cash-flowing — sheltering income. Rental losses are passive: they offset passive income freely, and up to $25,000/yr can offset ordinary (W-2) income if you actively participate and your MAGI is under $100k (phasing out to $0 by $150k); unused losses carry forward. On sale, claimed depreciation is recaptured at up to 25%, and gains may owe capital-gains tax (a 1031 exchange can defer both). Figures are a year-1 estimate at your 24.0% rate — not tax advice; consult a CPA.
Schools (NCES district)
- District
- Clovis Unified
- NCES district ID
- 0609030
- Math proficiency
- 58% ▲ 1.00%
- Reading proficiency
- 72% ▲ 2.00%
- Median HH income
- $71,950
- Composite
- 58.7/100
- National rank
- #2003
- State rank
- #152 of 1400 in CA
Livability — Clovis
- Score
- 76/100
- State rank
- #92
- US rank
- #3307
Category grades
Schools grade is shown separately in the Schools card above.
Census & demographics
- Census place
- Clovis, CA
- County
- Fresno County · 834,801 people
- City population
- 139,989
- Metro
- Fresno, CA
- Population (ZIP)
- 37,755
- Household income
- $66,683
- Rent vs Own
- Severe rent burden
- 2487.0
Population outlook (Fresno County) Hauer SSP2
- Today (2025)
- 1,042,971 people
- By 2030
- 1,072,198 · +2.8%
- By 2040
- 1,122,408 · +7.6%
- By 2050
- 1,157,251 · +11.0%
- By 2075
- 1,182,575 · +13.4%
- By 2100
- 1,105,899 · +6.0%
Race, ethnicity, and origin ACS 2023
- Neighborhood character
- Diverse neighborhood (Simpson 0.65)
- Race & ethnicity
- Hispanic / Latino 41% White 41% Two or more races 18% Asian 12% Black 2% Native American 2%
- Hispanic origin (detail)
- Mexican 37%
- Common ancestry
- Slovak 2% Lithuanian 1% Italian 1%
- Foreign-born
- 12% · Canada, China, Vietnam
- Languages at home
- 73% English-only · Spanish 18% Other Asian/Pacific 4% Tagalog/Filipino 2%
Political lean MEDSL · Fresno
- 2024 margin
- Toss-up / Even · D 46.5% · R 50.9% · Other 2.6%
- 2008→2024 swing
- -6.5pp toward R · 2008: 2.1pp · 2024: -4.4pp
- All cycles
- 2024: R+4.4 2020: D+7.8 2016: D+3.9 2012: R+2.9 2008: D+2.1
Not yet ingested
- Civics
- —
Market trends
- HPI YoY
- ▼ -352.97%
- Current HPI
- 357.6089
- Rent YoY
- ▲ 2.65%
- Metro
- Fresno, CA
- State GDP YoY
- ▲ 3.21%
- F500 in state
- 116
Industry mix (Fortune 500 HQ in CA)
| Industry | F500 HQs | Revenue |
|---|---|---|
| Technology | 27 | $1,492B |
|
||
| Financial Services | 3 | $174B |
|
||
| Retail | 3 | $44B |
|
||
| Insurance | 3 | $26B |
|
||
| Media / Entertainment | 2 | $115B |
|
||
| Pharmaceuticals / Biotech | 2 | $62B |
|
||
Price history
+631.8% since first listed3 events — show timeline
- 2026-01-21 Listed $2,995,000 FRESNOMLS
- 2017-02-03 Sold (Public Records) $1,025,000 Public Records
- 1999-01-15 Sold (Public Records) $409,250 Public Records
Property tax history
+7.5%/yrLatest (2025): $14,205 · +1.9% YoY. Source: county tax records.
Cash-flow waterfall
monthlySold comps — $/sqft
last 12 mo · ≤1 miLoading sold comps…