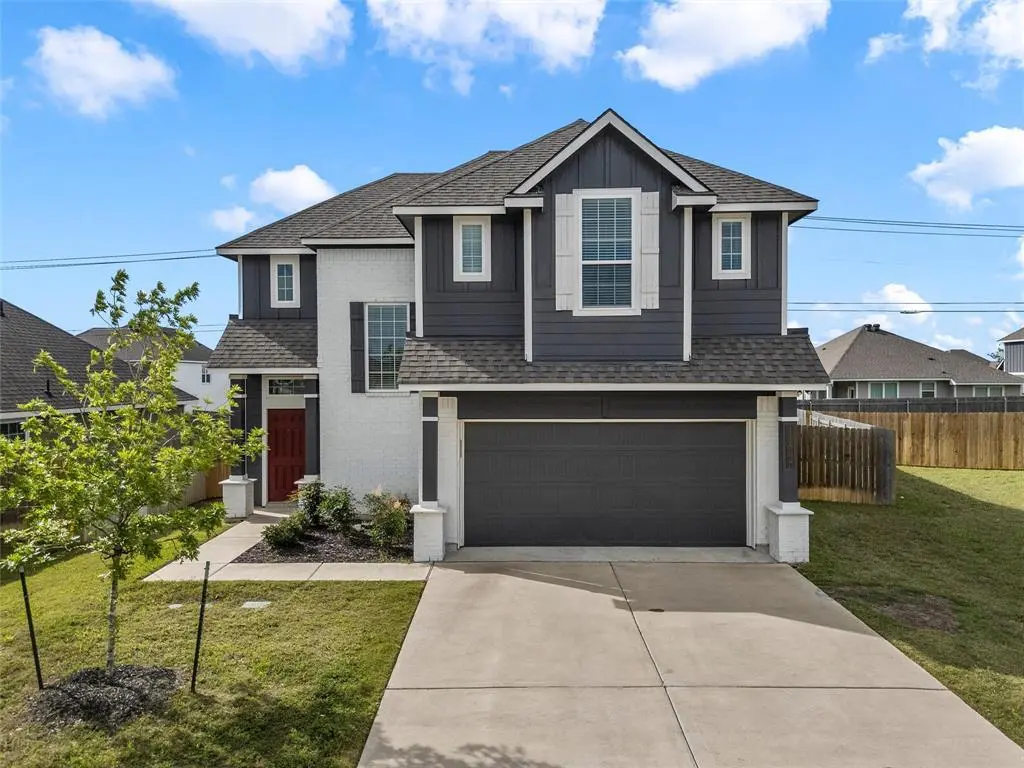
11508 Ullrich · Waco, TX
Flood risk 1/10 · Minimal
- FEMA flood zone
- X (unshaded)
- Chance of flooding over 30 yrs
- 0.0%
- Est. flood insurance / yr
- $507 – $1,088
Fire risk 5/10 · Moderate
- Est. fire insurance / yr
- $1,222 – $2,270
Heat risk 7/10 · Major
- Hot days now (above 108°F)
- 7 days/yr
- Hot days in 30 yrs
- 24 days/yr
Wind risk 6/10 · Moderate
- Chance of severe wind over 30 yrs
- 70.0%
Air-quality risk 2/10 · Minimal
- Unhealthy air days now
- 0 days/yr
- Unhealthy air days in 30 yrs
- 1 days/yr
Risk factors via First Street. Map © Google.
Why this score? — see what drove the D grade
The composite is a weighted blend of 9 inputs, each scored 0–100. Each bar is that input's sub-score; the figure is the points it added to the 100-point composite (weight × sub-score).
- Cash flow +11.0/30.0
- ARV discount +7.5/15.0
- Schools +5.2/10.0
- Condition / age +4.0/5.0
- Livability +3.7/5.0
- 1% rule +3.2/10.0
- DSCR +3.2/10.0
- Rent growth +2.5/5.0
- Appreciation +0.0/10.0
$309,900
🖨 Deal sheet 📄 Offer letter ✓ Due diligence
Listing remarks MLS
Welcome to this stunning two-story home located in one of the most desirable neighborhoods within Midway ISD. Designed for both comfort and functionality, this home offers a spacious and versatile layout perfect for modern living. Step inside to discover an inviting open-concept floor plan, where the kitchen truly serves as the heart of the home. Featuring a beautiful backsplash, ample cabinetry, and generous counter space, it seamlessly flows into the living and dining areas—ideal for entertaining or everyday gatherings. This home boasts 4 bedrooms and 3.5 bathrooms, including a flexible room that can easily serve as a home office, playroom, or guest space to suit your needs. The primary suite offers a private retreat, while the additional bedrooms provide plenty of space for family or visitors. Enjoy the convenience of a separate laundry room complete with washer and dryer hookups, adding ease to your daily routine. With its prime location, thoughtful design, and stylish finishes, this home combines elegance and practicality in a highly sought-after school district. Don’t miss your opportunity to make it yours!
Key facts
- Beautiful backsplash
- Ample cabinetry
- Flexible room
Tags
Neighborhood map
What this means for you Summary
Snapshot
- This is a 3-bed/2.5-bath single-family listed at $310k. Condition is rated good.
Deal economics
- At list price, monthly cash flow is $-132 ($-2k/yr) — negative.
- To cash-flow at today's rent, offer at most $287k (7.5% below list).
- To meet the 1% rule (rent ≥ 1% of price), the offer needs to be $254k (18.1% below list).
- Recommended offer: $254k (18.1% below list) — sets the bar for 1% rule.
- Cap rate 5.8% vs local median 3.9% in Waco — top-decile yield for the area; either an underpriced asset or a hidden risk that comps aren't pricing in. Stress-test before assuming the spread holds.
Location & tenants
- Location reads 74/100 on livability (#166 in TX, #4,378 nationally) — a middle-class / working-renter tenant base. Strengths: cost of living A+, housing A+, health & safety A+; Watch: schools D, crime D, commute F.
- Midway ISD (other): math 61% / reading 58% proficiency, ranked #56 of 826 in TX (top 7%) — acceptable for families but not a draw, mixed tenant base, ~2y average lease.
- Market conditions: 265 active listings in the ZIP; 8 comparable units currently listed for rent nearby; rentals lingering (median 44d on market — plan ~5-8 weeks vacancy on turnover, expect pricing pressure); 75% of comp listings sitting > 30 days — soft ceiling on asking rent; solid renter incomes; 1,014 units permitted in McLennan County in 2024 (200 in 5+ unit buildings).
- This rent runs 30% of the median local income ($100k/yr) — at the standard rent-burdened threshold; future hikes will face affordability resistance.
Forward outlook
- Local home prices are declining (-3.0%/yr); year-one equity from $2k of loan paydown is wiped out by about $9k of value loss. Plan a longer hold.
- McLennan County population projected at +17% by 2050 — long-run rental-demand tailwind backs the buy-and-hold thesis.
Negotiation context
- It's been on market 38 days — a 3% lower offer ($301k) is reasonable based on typical stale-listing flexibility.
- 2 sale attempts with the ask held roughly flat each time — persistent listings suggest the price (not the market) is what's stuck; bring a comps-based counter.
Risks & watch-outs
- Climate carrying-cost: major wind risk, 70% chance of damaging wind over 30y; moderate wildfire risk; extreme-heat days projected 7→24/yr by 2055 (HVAC capex compounding) — expect insurance premiums to compound above CPI over the hold.
Questions for the listing agent
- What do current leases actually rent for vs. the listed asking? Can we see a recent rent roll and the last 12 months of T-12 income?
- It's been on market 38 days. Have you received any prior offers? Is the seller open to a 18% concession, seller financing, or rate buy-down credit?
- What does the HOA fee cover, when was the last increase, and are there any pending special assessments or reserve-fund shortfalls?
- Is there a deadline driving the sale (1031 exchange, divorce, estate, relocation)? That informs how much negotiation room exists.
- Schools are D-rated, which usually means shorter tenancies and higher turnover. Who's the typical renter profile here, and what's been the actual vacancy rate?
- Crime grade is D in this area — have there been break-ins, vandalism, or insurance claims at this property in the last 3 years? What carrier currently insures it and at what premium?
- The area grade is low — what's the realistic commute time and amenity access for the typical tenant pool here? Any planned neighborhood developments (good or bad) we should know about?
- What's the average days-on-market for RENTAL listings here right now (not sales)? A rising rental-DOM trend means longer vacancies and softer asking-rent achievability than the comps imply.
- What's the recent tenant-quality profile in this submarket — average credit score on applications, eviction rate, late-payment / NSF rate, and stable-employment percentage? A property-management company in the area should have these aggregated.
- How much new for-sale + rental construction is in the pipeline within 1–3 miles? Heavy new supply typically softens prices + rents 12–24 months out; constrained supply supports both.
Investment metrics
- 1% rule
- 0.82% ✗
- Cap rate
- 5.78%
- Cash-on-cash
- -1.83%
- DSCR
- 0.92
- GRM
- 10.2
CMA / ARV
No comps found within radius.
Projected returns pro-forma
-3.0% appreciation · 3.0% rent growth · sell at horizon
- IRR
- -19.3%
- Equity multiple
- 0.32×
- Total profit
- $-58,605
- Equity at exit
- $46,207
- IRR
- -12.0%
- Equity multiple
- 0.29×
- Total profit
- $-61,732
- Equity at exit
- $26,794
Cash invested: $86,772 (down + closing). Projections, not guarantees.
Landlord ↔ Tenant lean methodology
- Overall (STATE)
- 87 Strongly Landlord-Friendly
- State Texas
- 87 Strongly Landlord-Friendly · R+5
- County
- — inherits STATE
- City
- — inherits STATE
ZIP-level market 76655
- Home prices YoY
- -31.3%
- Active inventory
- 265
- Price-to-rent
- 10.2×
Monthly cashflow live
- Estimated rent
- $2,539 high interval (Pro) →
- Mortgage (P&I)
- −$1,625
- Tax from tax record
- −$364 /mo · $4,370/yr
- Insurance
- −$129
- HOA
- −$20
- Vacancy / Maint / Mgmt
- −$533
- Net cashflow
- $-132
Break-even live
UW: 25.0% down · 7.5% · 30yr · 1.5% tax · 5.0% vac · 8.0% maint · 8.0% mgmt
Financing live
Cash to close
- Down payment
- $77,475
- Closing costs
- $9,297
- Reserves months
- —
- Total cash needed
- —
Loan-product check · same deal, 3 products live
Conventional
25% down · 7.5% · 30yr
- Down + closing
- —
- Monthly P&I
- —
- Monthly cashflow
- —
- DSCR
- —
- Eligible?
- —
Personal DTI + credit; lowest rate.
DSCR
20% down · 8.5% · 30yr
- Down + closing
- —
- Monthly P&I
- —
- Monthly cashflow
- —
- DSCR
- —
- Eligible?
- —
No personal income docs; deal must DSCR.
Hard money
10% down · 12.0% · 12mo
- Down + closing
- —
- Monthly P&I
- —
- Monthly cashflow
- —
- DSCR
- —
- Eligible?
- —
Short-term bridge; refi at stabilization.
Rent comps 8 comps
| Address | Beds | Baths | Sqft | Rent | $/sqft | DOM | Units | Dist |
|---|---|---|---|---|---|---|---|---|
| 3225 Marston Rd Lorena, TX | 4.0 | 2.0 | 1850 | $2,800 | $1.51 | 43d | 1 | 0.21mi |
| 3217 Jackal Dr Lorena, TX | 4.0 | 2.0 | 1840 | $2,400 | $1.30 | 20d | 1 | 0.29mi |
| 3128 Brosnan Rd Lorena, TX | 3.0 | 2.0 | 1717 | $2,350 | $1.37 | 43d | 1 | 0.31mi |
| 3117 Sherco Rd Lorena, TX | 3.0 | 2.0 | 1469 | $2,000 | $1.36 | 43d | 1 | 0.40mi |
| 2809 Keathley Dr Lorena, TX | 3.0 | 2.0 | 1565 | $2,100 | $1.34 | 43d | 1 | 0.49mi |
| 2813 Gilchrist Dr Lorena, TX | 3.0 | 2.0 | 1529 | $2,200 | $1.44 | 43d | 1 | 0.53mi |
| 2701 Skinner Dr Lorena, TX | 3.0 | 2.0 | 1573 | $2,400 | $1.53 | 43d | 1 | 0.68mi |
| 10312 Sierra West Dr Waco, TX | 3.0 | 2.0 | 1560 | $2,300 | $1.47 | 20d | 1 | 0.97mi |
HOA detail
- Monthly dues
- $20 · $240/yr
Listing history 16 events
-
2026-06-18days on market $309,900 Active 38 DOM
-
2026-06-17days on market $309,900 Active 37 DOM
-
2026-06-16days on market $309,900 Active 36 DOM
-
2026-06-15days on market $309,900 Active 35 DOM
-
2026-06-15days on market $309,900 Active 34 DOM
-
2026-06-13days on market $309,900 Active 33 DOM
-
2026-06-12days on market $309,900 Active 32 DOM
-
2026-06-10days on market $309,900 Active 29 DOM
-
2026-06-08days on market $309,900 Active 28 DOM
-
2026-06-08days on market $309,900 Active 27 DOM
-
2026-06-07days on market $309,900 Active 26 DOM
-
2026-06-03days on market $309,900 Active 23 DOM
-
2026-06-02days on market $309,900 Active 22 DOM
-
2026-06-01days on market $309,900 Active 21 DOM
-
2026-05-31remarks 693-char remark
-
2026-05-31$309,900 Active 20 DOM
ⓘ Source: listings_history table (triggers on properties + properties_extension) + one-shot
backfill from property_details.listing_events for pre-trigger history.
Tax reassessment forecast TX · Resets to sale price
- Current annual tax
- $4,370 · $364/mo
- Projected year-2 tax
- $5,671 · $473/mo
- Expected delta
- +$1,301/yr (+$108/mo · 29.8%)
ⓘ Screening estimate from a state-policy table — verify with the county assessor before closing.
Climate risk First Street
- Flood 1/10 Low FEMA zone X (unshaded) · 0% chance over 30 yrs
- Wildfire 5/10 Major
- Heat 7/10 Severe 7 d/yr ≥108°F today · 24 d/yr by 30 yrs out
- Wind 6/10 Major 70% chance of damaging wind over 30 yrs
- Air quality 2/10 Low 0 unhealthy d/yr today · 1 by 30 yrs out
Nearby sold comps map
Loading sold comps map…
Walkable amenities ~0.75 mi
Loading nearby amenities…
Taxation est. · year 1
- Rental income
- $30,474
- − Mortgage interest
- −$17,359
- − Property taxes
- −$4,370
- − Insurance
- −$1,550
- − Repairs & maintenance
- −$2,438
- − Management
- −$2,438
- − HOA
- −$240
- − Depreciation
- −$9,015
- Taxable loss
- −$6,936
- Est. tax savings @ 24.0%
- +$1,665
- After-tax cash flow
- $78/yr
For passive investors: Depreciation is non-cash, so a rental often shows a tax loss while cash-flowing — sheltering income. Rental losses are passive: they offset passive income freely, and up to $25,000/yr can offset ordinary (W-2) income if you actively participate and your MAGI is under $100k (phasing out to $0 by $150k); unused losses carry forward. On sale, claimed depreciation is recaptured at up to 25%, and gains may owe capital-gains tax (a 1031 exchange can defer both). Figures are a year-1 estimate at your 24.0% rate — not tax advice; consult a CPA.
Condition & rehab AI · 12 photos
This two-story home in a desirable Midway ISD neighborhood is in good condition with a good rehab level. It offers a spacious and versatile layout with modern finishes and a well-maintained exterior. Potential buyers will appreciate the home's curb appeal and interior aesthetics.
Value-add opportunities
- Both Painting the exterior and interior walls — Fresh paint can enhance curb appeal and interior aesthetics
- Both Landscaping improvements — Enhanced landscaping can boost curb appeal and attract more potential buyers
- Resale Upgrading the kitchen appliances — Modern appliances can increase the home's appeal to potential buyers
- Both Adding smart home features — Smart home features can increase the home's value and attract tech-savvy buyers
Renovation cost estimate screening
Value-add ROI direction
- Both Painting the exterior and interior walls — Fresh paint can enhance curb appeal and interior aesthetics ↑
- Both Landscaping improvements — Enhanced landscaping can boost curb appeal and attract more potential buyers ↑
- Resale Upgrading the kitchen appliances — Modern appliances can increase the home's appeal to potential buyers ↑
- Both Adding smart home features — Smart home features can increase the home's value and attract tech-savvy buyers ↑
ⓘ Cost ranges are severity-bucket heuristics (US national rule-of-thumb). Get contractor quotes + a written scope before underwriting a rehab budget.
Schools (NCES district)
- District
- Midway ISD
- NCES district ID
- 4830640
- Math proficiency
- 61% ▼ -8.00%
- Reading proficiency
- 58% ▼ -7.00%
- Median HH income
- $67,076
- Composite
- 52.32/100
- National rank
- #1593
- State rank
- #56 of 826 in TX
Livability — Waco
- Score
- 74/100
- State rank
- #166
- US rank
- #4378
Category grades
Schools grade is shown separately in the Schools card above.
Census & demographics
- Census place
- Waco, TX
- County
- McLennan County · 213,088 people
- City population
- 125,319
- Metro
- Waco, TX
- Population (ZIP)
- 10,603
- Household income
- $99,917
- Rent vs Own
- Severe rent burden
- 62.0
Population outlook (McLennan County) Hauer SSP2
- Today (2025)
- 264,191 people
- By 2030
- 273,578 · +3.6%
- By 2040
- 291,506 · +10.3%
- By 2050
- 308,044 · +16.6%
- By 2075
- 349,648 · +32.3%
- By 2100
- 364,779 · +38.1%
Race, ethnicity, and origin ACS 2023
- Neighborhood character
- Predominantly White (76%)
- Race & ethnicity
- White 76% Hispanic / Latino 17% Two or more races 12% Black 3%
- Hispanic origin (detail)
- Mexican 14%
- Common ancestry
- Lithuanian 3% Slovak 3% Serbian 2%
- Foreign-born
- 2% · Canada
- Languages at home
- 93% English-only · Spanish 5% Arabic 2%
Political lean MEDSL · McLennan
- 2024 margin
- Solid R (+30.9) · D 34.0% · R 64.9% · Other 1.0%
- 2008→2024 swing
- -7.0pp toward R · 2008: -23.9pp · 2024: -30.9pp
- All cycles
- 2024: R+30.9 2020: R+23.4 2016: R+27.1 2012: R+29.8 2008: R+23.9
Not yet ingested
- Civics
- —
Market trends
- HPI YoY
- ▼ -105.10%
- Current HPI
- 230.4333
- Rent YoY
- —
- Metro
- Waco, TX
- State GDP YoY
- ▲ 3.95%
- F500 in state
- 110
Industry mix (Fortune 500 HQ in TX)
| Industry | F500 HQs | Revenue |
|---|---|---|
| Energy | 16 | $1,198B |
|
||
| Technology | 5 | $198B |
|
||
| Engineering / Construction | 4 | $72B |
|
||
| Energy Services | 3 | $60B |
|
||
| Utilities | 3 | $41B |
|
||
| Healthcare | 2 | $330B |
|
||
Price history
+13673.3% since first listed3 events — show timeline
- 2026-05-11 Listed $309,900 NTREIS
- 2025-07-01 Rental Removed $2,250 RENTALBEAST
- 2025-03-20 Listed for Rent $2,250 RENTALBEAST
Property tax history
+9.7%/yrLatest (2025): $4,370 · +20.8% YoY. Source: county tax records.
Cash-flow waterfall
monthlySold comps — $/sqft
last 12 mo · ≤1 miLoading sold comps…