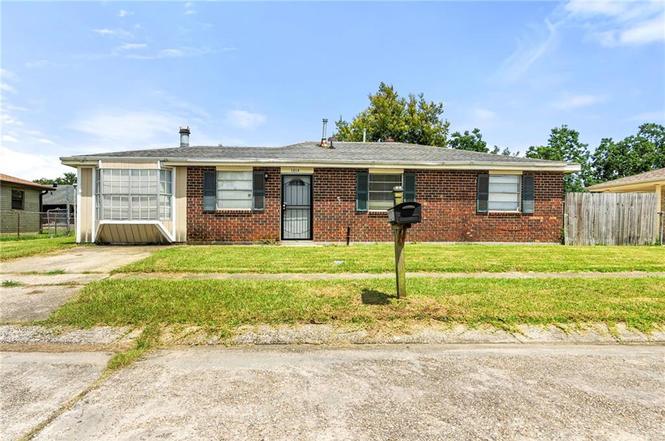
1213 Kenny Dr · Westwego, LA
Flood risk No data
- FEMA flood zone
- —
- Chance of flooding over 30 yrs
- —
- Est. flood insurance / yr
- —
Fire risk No data
- Est. fire insurance / yr
- —
Heat risk No data
- Hot days now (above threshold)
- —
- Hot days in 30 yrs
- —
Wind risk No data
- Chance of severe wind over 30 yrs
- —
Air-quality risk No data
- Unhealthy air days now
- —
- Unhealthy air days in 30 yrs
- —
Risk factors via First Street. Map © Google.
Why this score? — see what drove the D grade
The composite is a weighted blend of 9 inputs, each scored 0–100. Each bar is that input's sub-score; the figure is the points it added to the 100-point composite (weight × sub-score).
- Cash flow +15.0/30.0
- ARV discount +8.4/15.0
- DSCR +4.6/10.0
- Livability +3.4/5.0
- 1% rule +3.1/10.0
- Schools +2.5/10.0
- Condition / age +2.5/5.0
- Rent growth +2.3/5.0
- Appreciation +0.0/10.0
$205,000
🖨 Deal sheet (PDF) 📄 Offer letter ✓ Due diligence
Listing remarks
Welcome home to this well-maintained Westwego property offering comfort, functionality, and the perfect opportunity to make it uniquely your own. Inside, you'll find a welcoming layout with plenty of space to add your personal touches and create a home that reflects your style. Step outside and enjoy one of the property's standout features--a spacious 17' x 14' covered patio that extends your living space outdoors, making it ideal for morning coffee, weekend gatherings, or simply relaxing at the end of the day. The backyard also includes a generous 14' x 11' storage shed, providing ample room for tools, hobbies, lawn equipment, or additional storage. Whether you're a first-time buyer, downs
Key facts
- Near schools
- Near dining
- Near shopping
Tags
Property features AI
Finance
- Other: Property faces/borders West Bank Expressway (directions/landmark)
Exterior
- Utilities: Electric service: Entergy
- Home design: Single family residence
- Construction: Brick construction; Composition roof
- Exterior features: Chain link and partial fencing; Covered patio/porch; Workshop/other outbuilding
Interior
- Kitchen: Kitchen (appliances not specified)
- Bedrooms: Two bedrooms (Bedroom 1, Bedroom 2)
- Bathrooms: Two full bathrooms
- Heating & cooling: Central heating; Central air conditioning
- Interior features: Living room; Dining room; Kitchen; Bedroom 1; Bedroom 2; Wood-burning fireplace
Neighborhood map
What this means for you Summary
Snapshot
- This is a 3-bed/2.0-bath single-family listed at $205k.
Deal economics
- At list price, monthly cash flow is $65 ($786/yr) — positive.
- The deal already cash-flows at list — no discount required.
- To meet the 1% rule (rent ≥ 1% of price), the offer needs to be $166k (19.1% below list).
- Recommended offer: $166k (19.1% below list) — sets the bar for 1% rule.
Location & tenants
- Location reads 68/100 on livability (#97 in LA) — a middle-class / working-renter tenant base. Strengths: cost of living A+, health & safety A+; Watch: crime D, amenities D-, commute F.
- Jefferson Parish (suburban): math 24% / reading 34% proficiency, ranked #44 of 98 in LA (top 45%) — low school quality limits family demand, transient renter base, plan for 1-2y turnover; 70% free/reduced lunch — lower-income household profile, screen leases tightly.
- Zoned schools: Joshua Butler Elementary School (math 22% / reading 17%, grade F, #448 of 646 statewide, top 71%, 359 students, 80% FRL); Stella Worley Middle School (math 7% / reading 19%, grade F, #189 of 218 statewide, top 87%, 470 students, 80% FRL); L.W. Higgins High School (math 14% / reading 25%, grade F, #186 of 265 statewide, top 73%, 996 students, 70% FRL).
- Market conditions: Rents soft (-0.8%/yr); 188 active listings in the ZIP; 24 comparable units currently listed for rent nearby; rentals at typical pace (median 26d on market — plan ~3-4 weeks tenant-placement turnaround); 518 units permitted in Jefferson Parish in 2024 (43 in 5+ unit buildings).
- This rent runs 37% of the median local income ($54k/yr) — at the standard rent-burdened threshold; future hikes will face affordability resistance.
Forward outlook
- Local home prices are declining (-3.0%/yr); year-one equity from $1k of loan paydown is wiped out by about $6k of value loss. Plan a longer hold.
Negotiation context
- Only 6 days on market — expect competitive offers; lowballing is unlikely to land.
Questions for the listing agent
- Built in 1974 — when were the roof, HVAC, electrical panel, plumbing, and water heater last replaced?
- Is there a deadline driving the sale (1031 exchange, divorce, estate, relocation)? That informs how much negotiation room exists.
- Crime grade is D in this area — have there been break-ins, vandalism, or insurance claims at this property in the last 3 years? What carrier currently insures it and at what premium?
- The area grade is low — what's the realistic commute time and amenity access for the typical tenant pool here? Any planned neighborhood developments (good or bad) we should know about?
- What's the average days-on-market for RENTAL listings here right now (not sales)? A rising rental-DOM trend means longer vacancies and softer asking-rent achievability than the comps imply.
- What's the recent tenant-quality profile in this submarket — average credit score on applications, eviction rate, late-payment / NSF rate, and stable-employment percentage? A property-management company in the area should have these aggregated.
- How much new for-sale + rental construction is in the pipeline within 1–3 miles? Heavy new supply typically softens prices + rents 12–24 months out; constrained supply supports both.
Investment metrics
- 1% rule
- 0.81% ✗
- Cap rate
- 6.68%
- Cash-on-cash
- 1.37%
- DSCR
- 1.06
- GRM
- 10.3
CMA / ARV
- ARV (on-the-fly)
- $208,978
- Comps found
- 12
Show comp detail 12 sales within ~0.75 mi
| Address | Dist | Beds/Ba | Sqft | Sold | Price | $/sf | Match |
|---|---|---|---|---|---|---|---|
| 1130 Lecompte Dr | 0.06mi | 3/2.0 | 1,316 (+1%) | 12mo | $224,000 | $170 | 85 |
| 1105 Lecompte Dr | 0.15mi | 3/2.0 | 1,300 (+0%) | 15mo | $200,000 | $154 | 80 |
| 1201 East Dr | 0.23mi | 3/2.0 | 1,250 (-4%) | 13mo | $215,000 | $172 | 72 |
| 1000 Lee St | 0.26mi | 3/2.0 | 1,244 (-4%) | 16mo | $210,000 | $169 | 67 |
| 801 West Dr | 0.60mi | 2/1.0 (-1) | 1,307 (+1%) | 3mo | $189,000 | $145 | 59 |
| 1219 Central Ave | 0.28mi | 2/2.0 (-1) | 1,200 (-8%) | 15mo | $175,000 | $146 | 57 |
| 1229 Lee St | 0.29mi | 4/2.0 (+1) | 1,447 (+12%) | 16mo | $234,000 | $162 | 49 |
| 821 Barbe St | 0.46mi | 3/2.0 | 1,433 (+10%) | 18mo | $174,900 | $122 | 46 |
| 653 Vic A Pitre Dr | 0.61mi | 3/2.0 | 1,491 (+15%) | 1mo | $245,000 | $164 | 46 |
| 815 W Crystal Ct | 0.46mi | 3/2.0 | 1,486 (+14%) | 15mo | $239,900 | $161 | 42 |
| 1600 Lancaster Dr | 0.74mi | 3/2.0 | 1,479 (+14%) | 4mo | $175,000 | $118 | 39 |
| 705 Central Ave | 0.67mi | 3/1.0 | 1,115 (-14%) | 4mo | $172,500 | $155 | 38 |
Match score weights: distance 35% · size 25% · config 20% · recency 20%. Top-matched comps best support the ARV.
Projected returns pro-forma
-3.0% appreciation · 0.0% rent growth · sell at horizon
- IRR
- -17.2%
- Equity multiple
- 0.41×
- Total profit
- $-33,989
- Equity at exit
- $30,566
- IRR
- -15.1%
- Equity multiple
- 0.25×
- Total profit
- $-43,334
- Equity at exit
- $17,725
Cash invested: $57,400 (down + closing). Projections, not guarantees.
Landlord ↔ Tenant lean methodology
- Overall (STATE)
- 90 Strongly Landlord-Friendly
- State Louisiana
- 90 Strongly Landlord-Friendly · R+12
- County
- — inherits STATE
- City
- — inherits STATE
ZIP-level market 70094
- Rents YoY
- -0.8%
- Active inventory
- 188
- Price-to-rent
- 10.3×
Monthly cashflow live
- Estimated rent
- $1,658 high interval (Pro) →
- Mortgage (P&I)
- −$1,075
- Tax from tax record
- −$84 /mo · $1,006/yr
- Insurance
- −$85
- HOA
- −$0
- Vacancy / Maint / Mgmt
- −$348
- Net cashflow
- $65
Break-even live
Sensitivity live
| Price | -10% $182 | -5% $123 | +0% $65 | +5% $7 | +10% $-51 |
|---|---|---|---|---|---|
| Rent | -10% $-66 | -5% $0 | +0% $65 | +5% $131 | +10% $196 |
| Rate | -1.0pp $169 | -0.5pp $118 | base $65 | +0.5pp $12 | +1.0pp $-42 |
UW: 25.0% down · 7.5% · 30yr · 1.5% tax · 5.0% vac · 8.0% maint · 8.0% mgmt
Financing live
Cash to close
- Down payment
- $51,250
- Closing costs
- $6,150
- Reserves months
- —
- Total cash needed
- —
Loan-product check · same deal, 3 products live
Conventional
25% down · 7.5% · 30yr
- Down + closing
- —
- Monthly P&I
- —
- Monthly cashflow
- —
- DSCR
- —
- Eligible?
- —
Personal DTI + credit; lowest rate.
DSCR
20% down · 8.5% · 30yr
- Down + closing
- —
- Monthly P&I
- —
- Monthly cashflow
- —
- DSCR
- —
- Eligible?
- —
No personal income docs; deal must DSCR.
Hard money
10% down · 12.0% · 12mo
- Down + closing
- —
- Monthly P&I
- —
- Monthly cashflow
- —
- DSCR
- —
- Eligible?
- —
Short-term bridge; refi at stabilization.
Rent comps 24 comps
| Address | Beds | Baths | Sqft | Rent | $/sqft | DOM | Units | Dist |
|---|---|---|---|---|---|---|---|---|
| 1226 Kenny Dr Westwego, LA | 4.0 | 2.0 | 1300 | $1,650 | $1.27 | 25d | 1 | 0.06mi |
| 1029 Joyce St Marrero, LA | 3.0 | 2.0 | 1300 | $1,650 | $1.27 | 16d | 1 | 0.21mi |
| 1233 Central Ave Westwego, LA | 3.0 | 1.5 | 1357 | $1,500 | $1.11 | 25d | 1 | 0.27mi |
| 1413 Central Ave Unit C Westwego, LA | 2.0 | 1.5 | 1000 | $1,200 | $1.20 | 45d | 1 | 0.39mi |
| 1300 Tanglewood Dr Westwego, LA | 1.0–3.0 | 1.0–1.5 | 781 | $1,310 | $1.68 | 4d | 14 | 0.48mi |
| 653 Vic a Pitre Dr Westwego, LA | 3.0 | 2.0 | 1491 | $2,000 | $1.34 | 0d | 1 | 0.60mi |
| 1501 Somerset Pl Marrero, LA | 3.0 | 2.0 | 1697 | $1,850 | $1.09 | 45d | 1 | 0.66mi |
| 1501 Somerset Pl Marrero, LA | 3.0 | 2.0 | 1697 | $1,850 | $1.09 | 25d | 1 | 0.66mi |
| 710 West Dr Westwego, LA | 2.0 | 1.0 | 941 | $1,500 | $1.59 | 6d | 1 | 0.68mi |
| 7429 Pritchard St Marrero, LA | 2.0 | 1.0 | 925 | $1,150 | $1.24 | 16d | 1 | 0.72mi |
| 569 Magnolia Dr Marrero, LA | 2.0 | 1.5 | 1450 | $1,500 | $1.03 | 45d | 1 | 0.74mi |
| 958 Avenue B Westwego, LA | 2.0 | 1.0 | 1018 | $1,500 | $1.47 | 45d | 1 | 0.79mi |
| 520 Bellina Ln Marrero, LA | 2.0 | 1.0 | 1200 | $1,200 | $1.00 | 45d | 1 | 0.80mi |
| 900 Avenue H Unit D Westwego, LA | 2.0 | 1.5 | 992 | $1,300 | $1.31 | 22d | 1 | 0.81mi |
| 517 Bellina Ln Marrero, LA | 2.0 | 1.0 | 1200 | $1,400 | $1.17 | 45d | 1 | 0.81mi |
| 1060 Avenue B Unit A Westwego, LA | 3.0 | 2.0 | 1124 | $1,550 | $1.38 | 25d | 1 | 0.92mi |
| 524 Bertucci St Marrero, LA | 2.0 | 1.0 | 960 | $1,300 | $1.35 | 16d | 1 | 1.01mi |
| 1510 Javez St Marrero, LA | 3.0 | 2.0 | 1578 | $2,200 | $1.39 | 25d | 1 | 1.13mi |
| 1917 Gladstone Dr Marrero, LA | 3.0 | 2.0 | 1090 | $1,600 | $1.47 | 25d | 1 | 1.20mi |
| 181 Louisiana St Westwego, LA | 4.0 | 2.0 | 1500 | $1,550 | $1.03 | 45d | 1 | 1.22mi |
| 412 Avenue A Westwego, LA | 2.0 | 1.0 | 1103 | $1,500 | $1.36 | 45d | 1 | 1.43mi |
| 1836 Plaza Dr Unit C Marrero, LA | 3.0 | 1.0 | 1040 | $1,700 | $1.63 | 6d | 1 | 1.48mi |
| 1836 Plaza Dr Unit A Marrero, LA | 3.0 | 1.0 | 1040 | $1,700 | $1.63 | 45d | 1 | 1.48mi |
| 525 Emile Ave Westwego, LA | 3.0 | 2.0 | 1329 | $800 | $0.60 | 25d | 1 | 1.48mi |
Listing history 6 events
-
2026-06-21days on market $205,000 Active 6 DOM
-
2026-06-18days on market $205,000 Active 3 DOM
-
2026-06-17days on market $205,000 Active 2 DOM
-
2026-06-16days on market $205,000 Active 1 DOM
-
2026-06-15remarks 699-char remark
-
2026-06-15$205,000 Active 2 DOM
ⓘ Source: listings_history table (triggers on properties + properties_extension) + one-shot
backfill from property_details.listing_events for pre-trigger history.
Tax reassessment forecast LA · Resets to sale price
- Current annual tax
- $1,006 · $84/mo
- Projected year-2 tax
- $1,128 · $94/mo
- Expected delta
- +$122/yr (+$10/mo · 12.1%)
ⓘ Screening estimate from a state-policy table — verify with the county assessor before closing.
Nearby sold comps map
Loading sold comps map…
Walkable amenities ~0.75 mi
Loading nearby amenities…
Taxation est. · year 1
- Rental income
- $19,894
- − Mortgage interest
- −$11,483
- − Property taxes
- −$1,006
- − Insurance
- −$1,025
- − Repairs & maintenance
- −$1,592
- − Management
- −$1,592
- − Depreciation
- −$5,964
- Taxable loss
- −$2,766
- Est. tax savings @ 24.0%
- +$664
- After-tax cash flow
- $1,449/yr
For passive investors: Depreciation is non-cash, so a rental often shows a tax loss while cash-flowing — sheltering income. Rental losses are passive: they offset passive income freely, and up to $25,000/yr can offset ordinary (W-2) income if you actively participate and your MAGI is under $100k (phasing out to $0 by $150k); unused losses carry forward. On sale, claimed depreciation is recaptured at up to 25%, and gains may owe capital-gains tax (a 1031 exchange can defer both). Figures are a year-1 estimate at your 24.0% rate — not tax advice; consult a CPA.
Schools (NCES district)
- District
- Jefferson Parish
- NCES district ID
- 2200840
- Math proficiency
- 24% ▼ -36.00%
- Reading proficiency
- 34% ▼ -30.00%
- Median HH income
- $48,421
- Composite
- 25.19/100
- National rank
- #7511
- State rank
- #44 of 98 in LA
Livability — Westwego
- Score
- 68/100
- State rank
- #97
- US rank
- #9851
Category grades
Schools grade is shown separately in the Schools card above.
Census & demographics
- Census place
- Westwego, LA
- County
- Jefferson Parish · 426,999 people
- City population
- 32,130
- Metro
- New Orleans-Metairie, LA
- Population (ZIP)
- 32,130
- Household income
- $53,597
- Rent vs Own
- Severe rent burden
- 1457.0
Population outlook (Jefferson County) Hauer SSP2
- Today (2025)
- 451,696 people
- By 2030
- 455,451 · +0.8%
- By 2040
- 458,308 · +1.5%
- By 2050
- 461,031 · +2.1%
- By 2075
- 476,351 · +5.5%
- By 2100
- 499,377 · +10.6%
Race, ethnicity, and origin ACS 2023
- Neighborhood character
- Diverse neighborhood (Simpson 0.65)
- Race & ethnicity
- Black 46% White 36% Hispanic / Latino 13% Two or more races 6% Asian 2%
- Hispanic origin (detail)
- Mexican 2% Dominican 2%
- Common ancestry
- Lithuanian 9% Scottish 1%
- Foreign-born
- 8% · Canada, Vietnam
- Languages at home
- 86% English-only · Spanish 11% Vietnamese 2% French/Haitian/Cajun 1%
Political lean MEDSL · Jefferson
- 2024 margin
- R (+12.9) · D 42.5% · R 55.5% · Other 2.1%
- 2008→2024 swing
- +13.6pp toward D · 2008: -26.6pp · 2024: -12.9pp
- All cycles
- 2024: R+12.9 2020: R+11.1 2016: R+14.8 2012: R+18.4 2008: R+26.6
Not yet ingested
- Civics
- —
Market trends
- HPI YoY
- ▼ -111.56%
- Current HPI
- 102.9992
- Rent YoY
- ▼ -0.80%
- Metro
- New Orleans-Metairie, LA
- State GDP YoY
- ▲ 3.29%
- F500 in state
- 10
Industry mix (Fortune 500 HQ in LA)
| Industry | F500 HQs | Revenue |
|---|---|---|
| Telecommunications | 2 | $23B |
|
||
| Utilities | 1 | $12B |
|
||
| Wholesale / Distribution | 1 | $5B |
|
||
| Advertising | 1 | $2B |
|
||
Price history
2 events — show timeline
- 2026-06-13 Listed $205,000 AcadianaMLS
- 2002-08-01 Sold (Public Records) — Public Records
Property tax history
+2.7%/yrLatest (2025): $1,006 · -0.2% YoY. Source: county tax records.
Cash-flow waterfall
monthlySold comps — $/sqft
last 12 mo · ≤1 miLoading sold comps…