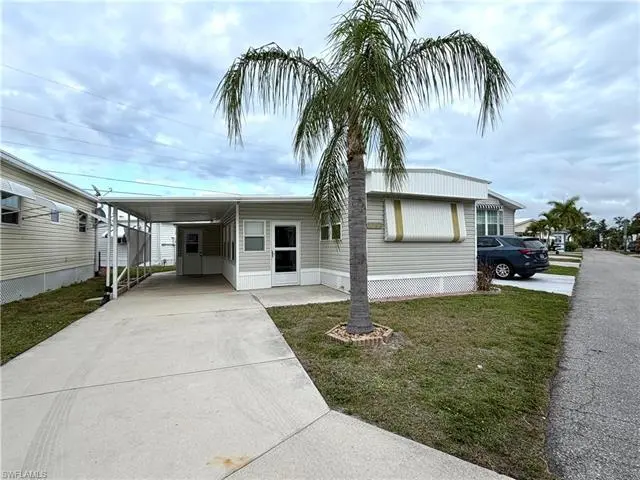
20581 River Dr · Estero, FL
Flood risk 8/10 · Major
- FEMA flood zone
- AE
- Chance of flooding over 30 yrs
- 0.96%
- Est. flood insurance / yr
- $1,737 – $8,500
Fire risk 3/10 · Minor
- Est. fire insurance / yr
- $947 – $1,759
Heat risk 10/10 · Severe
- Hot days now (above 107°F)
- 6 days/yr
- Hot days in 30 yrs
- 25 days/yr
Wind risk 10/10 · Severe
- Chance of severe wind over 30 yrs
- 99.0%
Air-quality risk 3/10 · Minor
- Unhealthy air days now
- 2 days/yr
- Unhealthy air days in 30 yrs
- 2 days/yr
Risk factors via First Street. Map © Google.
Why this score? — see what drove the C+ grade
The composite is a weighted blend of 9 inputs, each scored 0–100. Each bar is that input's sub-score; the figure is the points it added to the 100-point composite (weight × sub-score).
- Cash flow +30.0/30.0
- DSCR +10.0/10.0
- 1% rule +9.2/10.0
- Schools +4.1/10.0
- Livability +4.0/5.0
- Condition / age +2.5/5.0
- Rent growth +2.1/5.0
- ARV discount +0.0/15.0
- Appreciation +0.0/10.0
$139,000
🖨 Deal sheet 📄 Offer letter ✓ Due diligence
Listing remarks
Welcome to your dream cottage retreat, nestled in a vibrant mobile home community where you own the land! This beautifully updated mobile home has new flooring throughout, creating an inviting ambiance that welcomes you. Two living areas and nice open kitchen. Just down the hall is the primary bedroom with lots of closets and a full bath with a large walk in shower. This cozy residence features two comfortable bedrooms and one and a half baths, perfect for accommodating family or guests. The double-hung windows provide abundant natural light while enhancing energy efficiency. Enjoy the convenience of an attached storage shed for all your outdoor gear and personal items. Your new home also i
Key facts
- Nice pool
- Boat slips
- Covered carport
Tags
Property features AI
Finance
- Other: Located in a community of approximately 240 units; Subdivision/lot unit restrictions include architectural controls, deeded rules, limited number of vehicles and no commercial use
- HOA & community: Mandatory HOA with monthly fee of $151; Professional management; HOA maintenance covers laundry facilities, legal/accounting, sewer and water; Community amenities include pool, community room, boat dock/ramps/slips/lifts, fishing pier, fish cleaning station, basketball, pickleball, shuffleboard, billiards, library, internet access and streetlights; Community type: boating, mobile/manufactured, non-gated; Total annual recurring HOA fees: $1,812; Total one-time fees: $3,650
Exterior
- Parking: Attached 2-space carport
- Utilities: Central water; Central sewer; Cable available
- Home design: Manufactured residential home; Single-story (1 floor); Located in Mariners Cove
- Construction: Manufactured construction; Built in 1971; Rolled roofing; Vinyl exterior
- Exterior features: Vinyl siding; Double-hung windows; Manual storm shutters; Rolled roof; Boat ramp access; Regular lot; public road access; Rear exposure to the east; View: see remarks
Interior
- Kitchen: Microwave; Refrigerator/freezer; Eat-in kitchen with pantry
- Bedrooms: 2 bedrooms (split bedroom floor plan)
- Flooring: Vinyl flooring
- Bathrooms: 1 full bathroom; 1 half bathroom; Master bath has shower only
- Heating & cooling: Central electric heat; Central electric cooling
- Interior features: High-speed internet available; Pantry; Eat-in kitchen; Turnkey
- Laundry & utility: Washer and dryer included; Laundry in residence
Neighborhood map
What this means for you Summary
Snapshot
- This is a 2-bed/1.0-bath manufactured listed at $139k.
Deal economics
- At list price, monthly cash flow is $95 ($1k/yr) — positive.
- The deal already cash-flows at list — no discount required.
- Meets the 1% rule at list price ($2k rent vs $139k).
- Recommended offer: $135k (3.0% below list) — sets the bar for market timing.
- Cap rate 10.8% vs local median 3.4% in Estero — top-decile yield for the area; either an underpriced asset or a hidden risk that comps aren't pricing in. Stress-test before assuming the spread holds.
Location & tenants
- Location reads 79/100 on livability (#149 in FL, #2,242 nationally) — a middle-class / working-renter tenant base. Strengths: crime A+, employment A+, housing A+; Watch: amenities F, commute F, cost of living D-.
- Lee (suburban): math 47% / reading 50% proficiency, ranked #42 of 73 in FL (top 58%) — families likely to look elsewhere, expect single-tenant / working-renter base with shorter leases.
- Market conditions: Rents soft (-1.4%/yr); 668 active listings in the ZIP; 6 comparable units currently listed for rent nearby; rentals at typical pace (median 24d on market — plan ~3-4 weeks tenant-placement turnaround); solid renter incomes; 15,411 units permitted in Lee County in 2024 (4,686 in 5+ unit buildings).
Forward outlook
- Local home prices are declining (-3.0%/yr); year-one equity from $961 of loan paydown is wiped out by about $4k of value loss. Plan a longer hold.
- Lee County population projected at +44% by 2050 — long-run rental-demand tailwind backs the buy-and-hold thesis.
Negotiation context
- It's been on market 45 days — a 3% lower offer ($135k) is reasonable based on typical stale-listing flexibility.
- Current owner paid $100k; 39% above their basis — modest negotiation headroom, anchor on the comps not their cost.
Risks & watch-outs
- Watch-outs: flood insurance adds $427/mo.
- Climate carrying-cost: in FEMA flood zone AE (mandatory federal flood insurance); severe wind risk, 99% chance of damaging wind over 30y; extreme-heat days projected 6→25/yr by 2055 (HVAC capex compounding) — expect insurance premiums to compound above CPI over the hold.
Questions for the listing agent
- It's been on market 45 days. Have you received any prior offers? Is the seller open to a 3% concession, seller financing, or rate buy-down credit?
- Built in 1971 — when were the roof, HVAC, electrical panel, plumbing, and water heater last replaced?
- What's the actual annual flood-insurance premium (NFIP or private), and is the property in a SFHA with mandatory coverage?
- What does the HOA fee cover, when was the last increase, and are there any pending special assessments or reserve-fund shortfalls?
- Is there a deadline driving the sale (1031 exchange, divorce, estate, relocation)? That informs how much negotiation room exists.
- Schools are A-rated — typically a magnet for longer-tenancy family renters. What's the average tenant stay here, and is there a school-zone premium baked into asking?
- What's the average days-on-market for RENTAL listings here right now (not sales)? A rising rental-DOM trend means longer vacancies and softer asking-rent achievability than the comps imply.
- What's the recent tenant-quality profile in this submarket — average credit score on applications, eviction rate, late-payment / NSF rate, and stable-employment percentage? A property-management company in the area should have these aggregated.
- How much new for-sale + rental construction is in the pipeline within 1–3 miles? Heavy new supply typically softens prices + rents 12–24 months out; constrained supply supports both.
Investment metrics
- 1% rule
- 1.42% ✓
- Cap rate
- 10.80%
- Cash-on-cash
- 16.09%
- DSCR
- 1.72
- GRM
- 5.9
CMA / ARV
- ARV (on-the-fly)
- $97,920
- Comps found
- 2
Show comp detail 2 sales within ~0.75 mi
| Address | Dist | Beds/Ba | Sqft | Sold | Price | $/sf | Match |
|---|---|---|---|---|---|---|---|
| 20541 Basin Dr | 0.04mi | 2/1.0 | 576 (0%) | 16mo | $90,000 | $156 | 84 |
| 20660 River Dr | 0.07mi | 1/1.5 (-1) | 528 (-8%) | 1mo | $90,000 | $170 | 75 |
Match score weights: distance 35% · size 25% · config 20% · recency 20%. Top-matched comps best support the ARV.
Projected returns pro-forma
-3.0% appreciation · 0.0% rent growth · sell at horizon
- IRR
- -16.6%
- Equity multiple
- 0.44×
- Total profit
- $-21,909
- Equity at exit
- $20,725
- IRR
- -19.7%
- Equity multiple
- 0.17×
- Total profit
- $-32,269
- Equity at exit
- $12,018
Cash invested: $38,920 (down + closing). Projections, not guarantees.
Landlord ↔ Tenant lean methodology
- Overall (STATE)
- 87 Strongly Landlord-Friendly
- State Florida
- 87 Strongly Landlord-Friendly · R+3
- County
- — inherits STATE
- City
- — inherits STATE
ZIP-level market 33928
- Rents YoY
- -1.4%
- Active inventory
- 668
- Price-to-rent
- 5.9×
Monthly cashflow live
- Estimated rent
- $1,977 high interval (Pro) →
- Mortgage (P&I)
- −$729
- Tax from tax record
- −$102 /mo · $1,223/yr
- Insurance
- −$58
- Flood insurance flood zone
- −$427 /mo · $5,118/yr
- HOA
- −$151
- Vacancy / Maint / Mgmt
- −$415
- Net cashflow
- $95
Break-even live
UW: 25.0% down · 7.5% · 30yr · 1.5% tax · 5.0% vac · 8.0% maint · 8.0% mgmt
Financing live
Cash to close
- Down payment
- $34,750
- Closing costs
- $4,170
- Reserves months
- —
- Total cash needed
- —
Loan-product check · same deal, 3 products live
Conventional
25% down · 7.5% · 30yr
- Down + closing
- —
- Monthly P&I
- —
- Monthly cashflow
- —
- DSCR
- —
- Eligible?
- —
Personal DTI + credit; lowest rate.
DSCR
20% down · 8.5% · 30yr
- Down + closing
- —
- Monthly P&I
- —
- Monthly cashflow
- —
- DSCR
- —
- Eligible?
- —
No personal income docs; deal must DSCR.
Hard money
10% down · 12.0% · 12mo
- Down + closing
- —
- Monthly P&I
- —
- Monthly cashflow
- —
- DSCR
- —
- Eligible?
- —
Short-term bridge; refi at stabilization.
Rent comps 6 comps
| Address | Beds | Baths | Sqft | Rent | $/sqft | DOM | Units | Dist |
|---|---|---|---|---|---|---|---|---|
| 20711 Port Dr Estero, FL | 1.0 | 1.0 | 430 | $1,800 | $4.19 | 23d | 1 | 0.14mi |
| 4751 Lafayette Ln W Estero, FL | 2.0 | 1.0 | 584 | $1,550 | $2.65 | 23d | 1 | 0.49mi |
| 19600 Veduro Cir Fort Myers, FL | 1.0–3.0 | 1.0–2.0 | 993 | $1,970 | $1.98 | 14d | 11 | 1.31mi |
| 7340 Stoney Grove CIR Fort Myers, FL | 1.0–3.0 | 1.0–2.0 | 1106 | $2,118 | $1.91 | 2d | 39 | 1.38mi |
| 19113 Holly Rd Fort Myers, FL | 2.0 | 1.0 | 676 | $1,550 | $2.29 | 21d | 1 | 1.43mi |
| 19091 Holly Rd Fort Myers, FL | 2.0 | 1.0 | 720 | $1,295 | $1.80 | 23d | 1 | 1.46mi |
HOA detail
- Monthly dues
- $151 · $1,812/yr
Listing history 17 events
-
2026-06-17days on market $139,000 Active 45 DOM
-
2026-06-16days on market $139,000 Active 44 DOM
-
2026-06-15days on market $139,000 Active 43 DOM
-
2026-06-13days on market $139,000 Active 41 DOM
-
2026-06-10days on market $139,000 Active 38 DOM
-
2026-06-09days on market $139,000 Active 37 DOM
-
2026-06-08days on market $139,000 Active 36 DOM
-
2026-06-07days on market $139,000 Active 35 DOM
-
2026-06-03days on market $139,000 Active 31 DOM
-
2026-06-02days on market $139,000 Active 30 DOM
-
2026-06-01days on market $139,000 Active 29 DOM
-
2026-05-31days on market $139,000 Active 28 DOM
-
2026-05-03$139,000 Active
-
2025-08-28soldstatus $100,000
-
2016-10-11soldstatus $70,000
-
2013-04-01soldstatus $55,000
-
1997-02-12soldstatus $15,000
ⓘ Source: listings_history table (triggers on properties + properties_extension) + one-shot
backfill from property_details.listing_events for pre-trigger history.
Tax reassessment forecast FL · Resets to sale price
- Current annual tax
- $1,223 · $102/mo
- Projected year-2 tax
- $1,223 · $102/mo
- Expected delta
- $0/yr ($0/mo · 0.0%)
ⓘ Screening estimate from a state-policy table — verify with the county assessor before closing.
Climate risk First Street
- Flood 8/10 Severe FEMA zone AE · 96% chance over 30 yrs
- Wildfire 3/10 Moderate
- Heat 10/10 Extreme 6 d/yr ≥107°F today · 25 d/yr by 30 yrs out
- Wind 10/10 Extreme 99% chance of damaging wind over 30 yrs
- Air quality 3/10 Moderate 2 unhealthy d/yr today · 2 by 30 yrs out
Nearby sold comps map
Loading sold comps map…
Walkable amenities ~0.75 mi
Loading nearby amenities…
Taxation est. · year 1
- Rental income
- $23,720
- − Mortgage interest
- −$7,786
- − Property taxes
- −$1,223
- − Insurance
- −$5,814
- − Repairs & maintenance
- −$1,898
- − Management
- −$1,898
- − HOA
- −$1,812
- − Depreciation
- −$4,044
- Taxable loss
- −$754
- Est. tax savings @ 24.0%
- +$181
- After-tax cash flow
- $1,324/yr
For passive investors: Depreciation is non-cash, so a rental often shows a tax loss while cash-flowing — sheltering income. Rental losses are passive: they offset passive income freely, and up to $25,000/yr can offset ordinary (W-2) income if you actively participate and your MAGI is under $100k (phasing out to $0 by $150k); unused losses carry forward. On sale, claimed depreciation is recaptured at up to 25%, and gains may owe capital-gains tax (a 1031 exchange can defer both). Figures are a year-1 estimate at your 24.0% rate — not tax advice; consult a CPA.
Schools (NCES district)
- District
- Lee
- NCES district ID
- 1201080
- Math proficiency
- 47% ▼ -11.00%
- Reading proficiency
- 50% ▼ -4.00%
- Median HH income
- $49,518
- Composite
- 41.49/100
- National rank
- #3458
- State rank
- #42 of 73 in FL
Livability — Estero
- Score
- 79/100
- State rank
- #149
- US rank
- #2242
Category grades
Schools grade is shown separately in the Schools card above.
Census & demographics
- Census place
- Estero, FL
- County
- Lee County · 788,662 people
- City population
- 31,926
- Metro
- Cape Coral-Fort Myers, FL
- Population (ZIP)
- 31,926
- Household income
- $102,624
- Rent vs Own
- Severe rent burden
- 606.0
Population outlook (Lee County) Hauer SSP2
- Today (2025)
- 871,946 people
- By 2030
- 955,468 · +9.6%
- By 2040
- 1,113,587 · +27.7%
- By 2050
- 1,256,891 · +44.1%
- By 2075
- 1,560,270 · +78.9%
- By 2100
- 1,726,848 · +98.0%
Race, ethnicity, and origin ACS 2023
- Neighborhood character
- Predominantly White (85%)
- Race & ethnicity
- White 85% Hispanic / Latino 8% Two or more races 7% Asian 3% Black 1%
- Hispanic origin (detail)
- Mexican 2% Puerto Rican 2% Cuban 1%
- Common ancestry
- Romanian 5% Lithuanian 3% Slovak 2%
- Foreign-born
- 11% · Canada, China, Jamaica
- Languages at home
- 90% English-only · Spanish 5% Other Indo-European 1% French/Haitian/Cajun 1%
Political lean MEDSL · Lee
- 2024 margin
- Strong R (+28.4) · D 35.5% · R 63.9%
- 2008→2024 swing
- -18.0pp toward R · 2008: -10.4pp · 2024: -28.4pp
- All cycles
- 2024: R+28.4 2020: R+19.2 2016: R+20.4 2012: R+16.6 2008: R+10.4
Not yet ingested
- Civics
- —
Market trends
- HPI YoY
- ▼ -109.49%
- Current HPI
- 197.5913
- Rent YoY
- ▼ -1.42%
- Metro
- Cape Coral-Fort Myers, FL
- State GDP YoY
- ▲ 3.28%
- F500 in state
- 36
Industry mix (Fortune 500 HQ in FL)
| Industry | F500 HQs | Revenue |
|---|---|---|
| Industrial Technology | 2 | $29B |
|
||
| Insurance | 2 | $17B |
|
||
| Retail | 1 | $60B |
|
||
| Technology Distribution | 1 | $58B |
|
||
| Homebuilding | 1 | $35B |
|
||
| Technology Manufacturing | 1 | $35B |
|
||
Price history
+826.7% since first listed5 events — show timeline
- 2026-05-03 Listed $139,000 BEARMLS
- 2025-08-28 Sold (Public Records) $100,000 Public Records
- 2016-10-11 Sold (Public Records) $70,000 Public Records
- 2013-04-01 Sold (Public Records) $55,000 Public Records
- 1997-02-12 Sold (Public Records) $15,000 Public Records
Property tax history
+4.3%/yrLatest (2025): $1,223 · +3.7% YoY. Source: county tax records.
Cash-flow waterfall
monthlySold comps — $/sqft
last 12 mo · ≤1 miLoading sold comps…