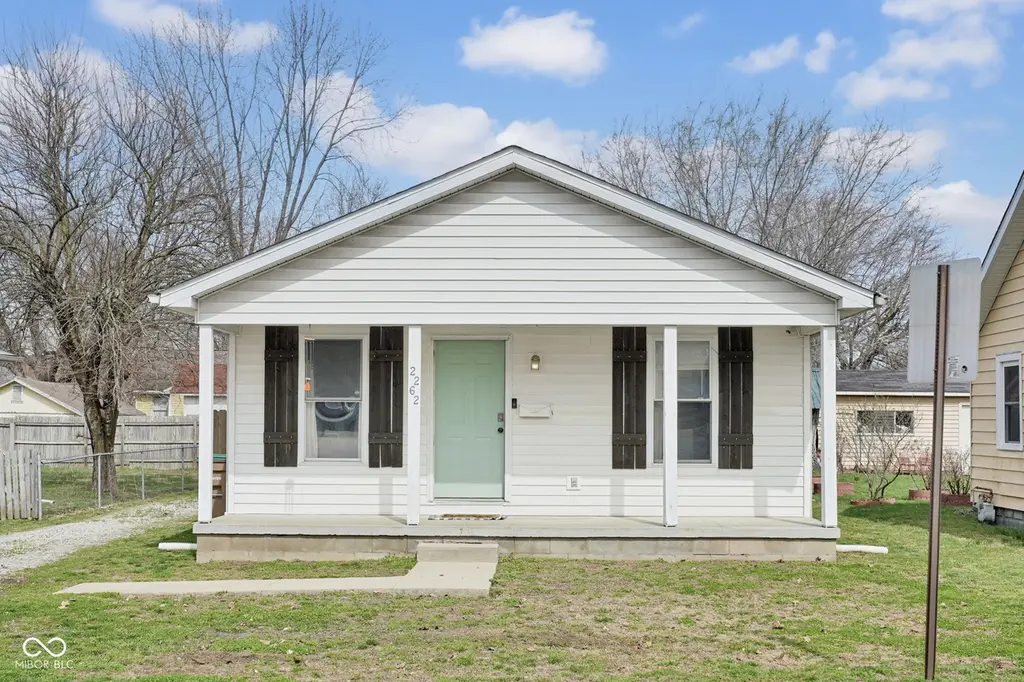
2262 Mckinley Ave · Columbus, IN
Flood risk 1/10 · Minimal
- FEMA flood zone
- X (unshaded)
- Chance of flooding over 30 yrs
- 0.0%
- Est. flood insurance / yr
- $507 – $1,088
Fire risk 1/10 · Minimal
- Est. fire insurance / yr
- $717 – $1,331
Heat risk 4/10 · Minor
- Hot days now (above 103°F)
- 7 days/yr
- Hot days in 30 yrs
- 19 days/yr
Wind risk 2/10 · Minimal
- Chance of severe wind over 30 yrs
- 1.0%
Air-quality risk 2/10 · Minimal
- Unhealthy air days now
- 1 days/yr
- Unhealthy air days in 30 yrs
- 2 days/yr
Risk factors via First Street. Map © Google.
Why this score? — see what drove the D- grade
The composite is a weighted blend of 9 inputs, each scored 0–100. Each bar is that input's sub-score; the figure is the points it added to the 100-point composite (weight × sub-score).
- Cash flow +13.8/30.0
- DSCR +4.2/10.0
- Livability +4.0/5.0
- Schools +3.6/10.0
- Rent growth +3.3/5.0
- 1% rule +2.9/10.0
- Condition / age +2.5/5.0
- ARV discount +2.3/15.0
- Appreciation +0.0/10.0
$199,000
🖨 Deal sheet (PDF) 📄 Offer letter ✓ Due diligence
Listing remarks MLS
YOU'LL ENJOY THIS NICE 3 BEDROOM HOME BUILT IN 1998! *INVITING FRONT PORCH *OPEN LIVING ROOM, KITCHEN AND DINING AREA WITH LAMINATE FLOORING QUALITY FEATURES INCLUDE TILT-IN THERMOPANE WINDOWS AND 6 PANEL DOORS *CONVENIENTLY LOCATED TO SHOPPING, RESTAURANTS AND DOWNTOWN ACTIVITIES.
Key facts
- New lvp flooring
- Major updates
- Move in ready
Tags
Neighborhood map
What this means for you Summary
Snapshot
- This is a 3-bed/1.0-bath single-family listed at $199k.
Deal economics
- At list price, monthly cash flow is $17 ($202/yr) — positive.
- The deal already cash-flows at list — no discount required.
- To meet the 1% rule (rent ≥ 1% of price), the offer needs to be $158k (20.8% below list).
- Recommended offer: $158k (20.8% below list) — sets the bar for 1% rule.
- Cap rate 6.4% vs local median 3.5% in Columbus — top-decile yield for the area; either an underpriced asset or a hidden risk that comps aren't pricing in. Stress-test before assuming the spread holds.
Location & tenants
- Location reads 79/100 on livability (#24 in IN, #1,978 nationally) — a middle-class / working-renter tenant base. Strengths: crime A+, cost of living A+, housing A+; Watch: amenities D+, commute F.
- Bartholomew Consolidated School Corporation (urban): math 38% / reading 45% proficiency, ranked #119 of 301 in IN (top 40%) — families likely to look elsewhere, expect single-tenant / working-renter base with shorter leases.
- Zoned schools: L F Smith Elementary (math 34% / reading 36%, grade F, #590 of 994 statewide, top 60%, 471 students, 62% FRL); Northside Middle School (math 32% / reading 49%, grade F, #117 of 330 statewide, top 36%, 904 students, 49% FRL); Columbus East High School (math 34% / reading 65%, grade D, #123 of 369 statewide, top 36%, 1,535 students, 39% FRL).
- Market conditions: Rents rising (+3.1%/yr); 345 active listings in the ZIP; 6 comparable units currently listed for rent nearby; rentals lingering (median 46d on market — plan ~5-8 weeks vacancy on turnover, expect pricing pressure); 83% of comp listings sitting > 30 days — soft ceiling on asking rent; solid renter incomes; 195 units permitted in Bartholomew County in 2024 (0 in 5+ unit buildings).
Forward outlook
- Local home prices are declining (-3.0%/yr); year-one equity from $1k of loan paydown is wiped out by about $6k of value loss. Plan a longer hold.
- Bartholomew County population projected at +22% by 2050 — long-run rental-demand tailwind backs the buy-and-hold thesis.
Negotiation context
- It's been on market 41 days — a 3% lower offer ($193k) is reasonable based on typical stale-listing flexibility.
- 3 sale attempts since 14y ago with the ask held roughly flat each time — persistent listings suggest the price (not the market) is what's stuck; bring a comps-based counter.
- Current owner paid $140k; 42% above their basis — modest negotiation headroom, anchor on the comps not their cost.
Questions for the listing agent
- It's been on market 41 days. Have you received any prior offers? Is the seller open to a 21% concession, seller financing, or rate buy-down credit?
- Is there a deadline driving the sale (1031 exchange, divorce, estate, relocation)? That informs how much negotiation room exists.
- Schools are B-rated — typically a magnet for longer-tenancy family renters. What's the average tenant stay here, and is there a school-zone premium baked into asking?
- The area grade is low — what's the realistic commute time and amenity access for the typical tenant pool here? Any planned neighborhood developments (good or bad) we should know about?
- What's the average days-on-market for RENTAL listings here right now (not sales)? A rising rental-DOM trend means longer vacancies and softer asking-rent achievability than the comps imply.
- What's the recent tenant-quality profile in this submarket — average credit score on applications, eviction rate, late-payment / NSF rate, and stable-employment percentage? A property-management company in the area should have these aggregated.
- How much new for-sale + rental construction is in the pipeline within 1–3 miles? Heavy new supply typically softens prices + rents 12–24 months out; constrained supply supports both.
Investment metrics
- 1% rule
- 0.79% ✗
- Cap rate
- 6.39%
- Cash-on-cash
- 0.36%
- DSCR
- 1.02
- GRM
- 10.5
CMA / ARV
- ARV (on-the-fly)
- $178,416
- Comps found
- 12
Show comp detail 12 sales within ~0.75 mi
| Address | Dist | Beds/Ba | Sqft | Sold | Price | $/sf | Match |
|---|---|---|---|---|---|---|---|
| 2262 Mckinley Ave | 0.00mi | 3/1.0 | 1,008 (0%) | 1mo | $185,000 | $184 | 99 |
| 2256 Mckinley Ave | 0.01mi | 2/1.0 (-1) | 1,092 (+8%) | 8mo | $172,500 | $158 | 74 |
| 200 Pence St | 0.46mi | 3/2.0 | 980 (-3%) | 8mo | $173,775 | $177 | 63 |
| 844 Cottage Ave | 0.61mi | 2/1.0 (-1) | 1,032 (+2%) | 0mo | $185,361 | $180 | 62 |
| 100 S Beatty Ln | 0.64mi | 3/1.0 | 960 (-5%) | 4mo | $165,000 | $172 | 59 |
| 2805 Kentucky Ave | 0.69mi | 3/1.0 | 936 (-7%) | 7mo | $172,000 | $184 | 50 |
| 1215 N Gladstone Ave | 0.73mi | 3/1.0 | 925 (-8%) | 4mo | $102,000 | $110 | 48 |
| 1782 Wallace Ave | 0.37mi | 3/1.5 | 1,152 (+14%) | 11mo | $134,900 | $117 | 48 |
| 2133 10th St | 0.48mi | 2/1.0 (-1) | 896 (-11%) | 10mo | $140,000 | $156 | 46 |
| 131 S Beatty St | 0.54mi | 2/1.0 (-1) | 1,114 (+10%) | 10mo | $177,500 | $159 | 44 |
| 1317 Court St | 0.74mi | 3/1.0 | 932 (-8%) | 11mo | $170,000 | $182 | 44 |
| 2905 Kentucky Ave | 0.72mi | 3/1.0 | 864 (-14%) | 4mo | $173,900 | $201 | 40 |
Match score weights: distance 35% · size 25% · config 20% · recency 20%. Top-matched comps best support the ARV.
Projected returns pro-forma
-3.0% appreciation · 3.15% rent growth · sell at horizon
- IRR
- -15.6%
- Equity multiple
- 0.44×
- Total profit
- $-31,005
- Equity at exit
- $29,672
- IRR
- -7.0%
- Equity multiple
- 0.55×
- Total profit
- $-24,912
- Equity at exit
- $17,206
Cash invested: $55,720 (down + closing). Projections, not guarantees.
Landlord ↔ Tenant lean methodology
- Overall (STATE)
- 90 Strongly Landlord-Friendly
- State Indiana
- 90 Strongly Landlord-Friendly · R+11
- County
- — inherits STATE
- City
- — inherits STATE
ZIP-level market 47201
- Rents YoY
- 3.1%
- Active inventory
- 345
- Price-to-rent
- 10.5×
Monthly cashflow live
- Estimated rent
- $1,576 high interval (Pro) →
- Mortgage (P&I)
- −$1,044
- Tax from tax record
- −$101 /mo · $1,217/yr
- Insurance
- −$83
- HOA
- −$0
- Vacancy / Maint / Mgmt
- −$331
- Net cashflow
- $17
Break-even live
Sensitivity live
| Price | -10% $129 | -5% $73 | +0% $17 | +5% $-40 | +10% $-96 |
|---|---|---|---|---|---|
| Rent | -10% $-108 | -5% $-45 | +0% $17 | +5% $79 | +10% $141 |
| Rate | -1.0pp $117 | -0.5pp $67 | base $17 | +0.5pp $-35 | +1.0pp $-87 |
UW: 25.0% down · 7.5% · 30yr · 1.5% tax · 5.0% vac · 8.0% maint · 8.0% mgmt
Financing live
Cash to close
- Down payment
- $49,750
- Closing costs
- $5,970
- Reserves months
- —
- Total cash needed
- —
Loan-product check · same deal, 3 products live
Conventional
25% down · 7.5% · 30yr
- Down + closing
- —
- Monthly P&I
- —
- Monthly cashflow
- —
- DSCR
- —
- Eligible?
- —
Personal DTI + credit; lowest rate.
DSCR
20% down · 8.5% · 30yr
- Down + closing
- —
- Monthly P&I
- —
- Monthly cashflow
- —
- DSCR
- —
- Eligible?
- —
No personal income docs; deal must DSCR.
Hard money
10% down · 12.0% · 12mo
- Down + closing
- —
- Monthly P&I
- —
- Monthly cashflow
- —
- DSCR
- —
- Eligible?
- —
Short-term bridge; refi at stabilization.
Rent comps 6 comps
| Address | Beds | Baths | Sqft | Rent | $/sqft | DOM | Units | Dist |
|---|---|---|---|---|---|---|---|---|
| 1182 Quail Run Dr Columbus, IN | 1.0–3.0 | 1.0–2.0 | 967 | $1,600 | $1.65 | 45d | 16 | 0.72mi |
| 420 Wint Ln Columbus, IN | 1.0–2.0 | 1.0–2.0 | 950 | $1,450 | $1.53 | 45d | 1 | 0.72mi |
| 275 N Marr Rd Columbus, IN | 1.0–2.0 | 1.0–2.0 | 897 | $1,540 | $1.72 | 45d | 4 | 0.78mi |
| 3393 Country Brook St Columbus, IN | 1.0–3.0 | 1.5 | 821 | $1,665 | $2.03 | 45d | 10 | 0.82mi |
| 725 Sycamore St Columbus, IN | 1.0–2.0 | 1.0–2.0 | 766 | $1,525 | $1.99 | 23d | 11 | 0.97mi |
| 782 Clifty Ln Columbus, IN | 1.0–2.0 | 1.0–2.0 | 999 | $1,360 | $1.36 | 45d | 1 | 1.07mi |
Listing history 7 events
-
2026-04-27status Pending
-
2026-03-17$199,000 Active
-
2023-09-26soldstatus $140,000 Closed 282-char remark
Show marketing remark (282 chars)
YOU'LL ENJOY THIS NICE 3 BEDROOM HOME BUILT IN 1998! *INVITING FRONT PORCH *OPEN LIVING ROOM, KITCHEN AND DINING AREA WITH LAMINATE FLOORING QUALITY FEATURES INCLUDE TILT-IN THERMOPANE WINDOWS AND 6 PANEL DOORS *CONVENIENTLY LOCATED TO SHOPPING, RESTAURANTS AND DOWNTOWN ACTIVITIES.
-
2023-08-16status Pending 282-char remark
Show marketing remark (282 chars)
YOU'LL ENJOY THIS NICE 3 BEDROOM HOME BUILT IN 1998! *INVITING FRONT PORCH *OPEN LIVING ROOM, KITCHEN AND DINING AREA WITH LAMINATE FLOORING QUALITY FEATURES INCLUDE TILT-IN THERMOPANE WINDOWS AND 6 PANEL DOORS *CONVENIENTLY LOCATED TO SHOPPING, RESTAURANTS AND DOWNTOWN ACTIVITIES.
-
2023-08-15$139,900 Active 282-char remark
Show marketing remark (282 chars)
YOU'LL ENJOY THIS NICE 3 BEDROOM HOME BUILT IN 1998! *INVITING FRONT PORCH *OPEN LIVING ROOM, KITCHEN AND DINING AREA WITH LAMINATE FLOORING QUALITY FEATURES INCLUDE TILT-IN THERMOPANE WINDOWS AND 6 PANEL DOORS *CONVENIENTLY LOCATED TO SHOPPING, RESTAURANTS AND DOWNTOWN ACTIVITIES.
-
2013-04-10soldstatus $48,500
-
2012-10-04$54,900 204-char remark
Show marketing remark (204 chars)
How fast can you move? This 3 bedroom, 1 full bath home features a kitchen, dining and living room open concept. It is located in the middle of town and is close to shopping centers. Immediate Possession!
ⓘ Source: listings_history table (triggers on properties + properties_extension) + one-shot
backfill from property_details.listing_events for pre-trigger history.
Tax reassessment forecast IN · Partial reset (capped growth)
- Current annual tax
- $1,217 · $101/mo
- Projected year-2 tax
- $1,454 · $121/mo
- Expected delta
- +$237/yr (+$20/mo · 19.5%)
ⓘ Screening estimate from a state-policy table — verify with the county assessor before closing.
Climate risk First Street
- Flood 1/10 Low FEMA zone X (unshaded) · 0% chance over 30 yrs
- Wildfire 1/10 Low
- Heat 4/10 Moderate 7 d/yr ≥103°F today · 19 d/yr by 30 yrs out
- Wind 2/10 Low 100% chance of damaging wind over 30 yrs
- Air quality 2/10 Low 1 unhealthy d/yr today · 2 by 30 yrs out
Nearby sold comps map
Loading sold comps map…
Walkable amenities ~0.75 mi
Loading nearby amenities…
Taxation est. · year 1
- Rental income
- $18,908
- − Mortgage interest
- −$11,147
- − Property taxes
- −$1,217
- − Insurance
- −$995
- − Repairs & maintenance
- −$1,513
- − Management
- −$1,513
- − Depreciation
- −$5,789
- Taxable loss
- −$3,266
- Est. tax savings @ 24.0%
- +$784
- After-tax cash flow
- $985/yr
For passive investors: Depreciation is non-cash, so a rental often shows a tax loss while cash-flowing — sheltering income. Rental losses are passive: they offset passive income freely, and up to $25,000/yr can offset ordinary (W-2) income if you actively participate and your MAGI is under $100k (phasing out to $0 by $150k); unused losses carry forward. On sale, claimed depreciation is recaptured at up to 25%, and gains may owe capital-gains tax (a 1031 exchange can defer both). Figures are a year-1 estimate at your 24.0% rate — not tax advice; consult a CPA.
Schools (NCES district)
- District
- Bartholomew Consolidated School Corporation
- NCES district ID
- 1800360
- Math proficiency
- 38% ▼ -11.00%
- Reading proficiency
- 45% ▼ -7.00%
- Median HH income
- $54,685
- Composite
- 36.16/100
- National rank
- #4736
- State rank
- #119 of 301 in IN
Livability — Columbus
- Score
- 79/100
- State rank
- #24
- US rank
- #1978
Category grades
Schools grade is shown separately in the Schools card above.
Census & demographics
- Census place
- Columbus, IN
- County
- Bartholomew County · 74,100 people
- City population
- 74,100
- Metro
- Columbus, IN
- Population (ZIP)
- 47,900
- Household income
- $83,958
- Rent vs Own
- Severe rent burden
- 1455.0
Population outlook (Bartholomew County) Hauer SSP2
- Today (2025)
- 90,162 people
- By 2030
- 94,432 · +4.7%
- By 2040
- 102,659 · +13.9%
- By 2050
- 109,794 · +21.8%
- By 2075
- 123,419 · +36.9%
- By 2100
- 121,047 · +34.3%
Race, ethnicity, and origin ACS 2023
- Neighborhood character
- Predominantly White (75%)
- Race & ethnicity
- White 75% Hispanic / Latino 10% Asian 9% Two or more races 6% Black 2%
- Hispanic origin (detail)
- Mexican 8% Puerto Rican 1%
- Common ancestry
- Italian 3% Slovak 2% Serbian 1%
- Foreign-born
- 14% · Canada, China
- Languages at home
- 83% English-only · Spanish 8% Other Indo-European 5% Other Asian/Pacific 2%
Political lean MEDSL · Bartholomew
- 2024 margin
- Strong R (+27.3) · D 35.3% · R 62.7% · Other 2.0%
- 2008→2024 swing
- -16.1pp toward R · 2008: -11.3pp · 2024: -27.3pp
- All cycles
- 2024: R+27.3 2020: R+26.2 2016: R+33.3 2012: R+25.4 2008: R+11.3
Not yet ingested
- Civics
- —
Market trends
- HPI YoY
- ▼ -204.94%
- Current HPI
- 150.2246
- Rent YoY
- ▲ 3.15%
- Metro
- Columbus, IN
- State GDP YoY
- ▲ 2.90%
- F500 in state
- 18
Industry mix (Fortune 500 HQ in IN)
| Industry | F500 HQs | Revenue |
|---|---|---|
| Industrial Machinery | 2 | $37B |
|
||
| Healthcare | 1 | $177B |
|
||
| Pharmaceuticals | 1 | $45B |
|
||
| Metals / Steel | 1 | $18B |
|
||
| Agriculture | 1 | $17B |
|
||
| Packaging | 1 | $12B |
|
||
Price history
+262.5% since first listed7 events — show timeline
- 2026-04-27 Pending — MIBOR as Distributed by MLS Grid
- 2026-03-17 Listed $199,000 MIBOR as Distributed by MLS Grid
- 2023-09-26 Sold (MLS) $140,000 MIBOR as Distributed by MLS Grid
- 2023-08-16 Pending — MIBOR as Distributed by MLS Grid
- 2023-08-15 Listed $139,900 MIBOR as Distributed by MLS Grid
- 2013-04-10 Sold (Public Records) $48,500 Public Records
- 2012-10-04 Listed $54,900 MIBOR as Distributed by MLS Grid
Property tax history
-3.2%/yrLatest (2024): $1,217 · +193.0% YoY. Source: county tax records.
Cash-flow waterfall
monthlySold comps — $/sqft
last 12 mo · ≤1 miLoading sold comps…