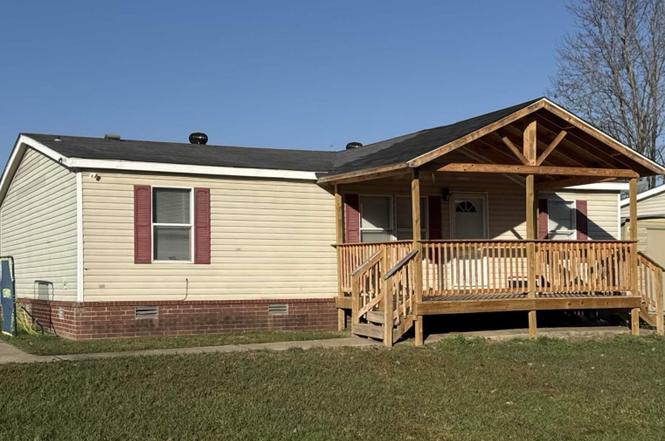
3490 Appomattox Dr · Conway, AR
Flood risk 1/10 · Minimal
- FEMA flood zone
- X (unshaded)
- Chance of flooding over 30 yrs
- 0.0%
- Est. flood insurance / yr
- $507 – $1,088
Fire risk 5/10 · Moderate
- Est. fire insurance / yr
- $1,499 – $2,785
Heat risk 7/10 · Major
- Hot days now (above 111°F)
- 7 days/yr
- Hot days in 30 yrs
- 20 days/yr
Wind risk 4/10 · Minor
- Chance of severe wind over 30 yrs
- 9.0%
Air-quality risk 2/10 · Minimal
- Unhealthy air days now
- 1 days/yr
- Unhealthy air days in 30 yrs
- 1 days/yr
Risk factors via First Street. Map © Google.
Why this score? — see what drove the B+ grade
The composite is a weighted blend of 9 inputs, each scored 0–100. Each bar is that input's sub-score; the figure is the points it added to the 100-point composite (weight × sub-score).
- Cash flow +30.0/30.0
- ARV discount +15.0/15.0
- DSCR +10.0/10.0
- 1% rule +8.5/10.0
- Schools +3.8/10.0
- Livability +3.5/5.0
- Rent growth +2.8/5.0
- Condition / age +2.5/5.0
- Appreciation +0.0/10.0
$106,000
🖨 Deal sheet 📄 Offer letter ✓ Due diligence
Listing remarks MLS
Nice 3 bed 2 bath mobile on a corner lot. New flooring and paint.
Key facts
- Covered front porch
- Storage shed
- Corner lot
Tags
Property features AI
Finance
- Financial info: Accepts VA, FHA, Conventional, Rural Development loans, or cash
Exterior
- Parking: Parking pads for 2 cars
- Utilities: Public water; Public sewer
- Home design: Manufactured single-wide home on a permanent foundation
- Construction: Metal or vinyl siding; Architectural shingle roof; Piers foundation
- Exterior features: Patio; Outside storage area; Paved road access; Level corner lot
Interior
- Kitchen: Free-standing stove; Electric range; Dishwasher
- Flooring: Tile flooring; Laminate flooring
- Bathrooms: 2 full bathrooms
- Heating & cooling: Central heat (electric); Central cooling (electric)
- Interior features: Washer and dryer connections (dryer electric); Ceiling fans
- Laundry & utility: Washer connection; Dryer connection (electric)
Neighborhood map
What this means for you Summary
Snapshot
- This is a 3-bed/2.0-bath single-family listed at $106k.
Deal economics
- At list price, monthly cash flow is $473 ($6k/yr) — positive.
- The deal already cash-flows at list — no discount required.
- Meets the 1% rule at list price ($1k rent vs $106k).
- Cap rate 11.6% vs local median 3.9% in Conway — top-decile yield for the area; either an underpriced asset or a hidden risk that comps aren't pricing in. Stress-test before assuming the spread holds.
Location & tenants
- Location reads 69/100 on livability (#71 in AR) — a middle-class / working-renter tenant base. Strengths: cost of living A+, housing A+, schools B; Watch: employment C-, crime F, amenities F.
- Conway School District (urban): math 43% / reading 47% proficiency, ranked #36 of 238 in AR (top 15%) — families likely to look elsewhere, expect single-tenant / working-renter base with shorter leases.
- Market conditions: Rents rising (+1.1%/yr); 187 active listings in the ZIP; 1 comparable units currently listed for rent nearby; 865 units permitted in Faulkner County in 2024 (451 in 5+ unit buildings).
Forward outlook
- Local home prices are declining (-3.0%/yr); year-one equity from $733 of loan paydown is wiped out by about $3k of value loss. Plan a longer hold.
- Faulkner County population projected at +32% by 2050 — long-run rental-demand tailwind backs the buy-and-hold thesis.
- At projected returns (-3.0% appreciation + 1.1% rent growth), your $30k cash investment doubles in ~8 years — after that, you're playing with house money.
Negotiation context
- Only 9 days on market — expect competitive offers; lowballing is unlikely to land.
- 4 sale attempts since 11y ago with the ask held roughly flat each time — persistent listings suggest the price (not the market) is what's stuck; bring a comps-based counter.
- Current owner paid $50k; list at $106k implies a 112% gain — meaningful room to come down on a strong offer.
Risks & watch-outs
- Climate carrying-cost: moderate wildfire risk; extreme-heat days projected 7→20/yr by 2055 (HVAC capex compounding) — expect insurance premiums to compound above CPI over the hold.
Questions for the listing agent
- Is there a deadline driving the sale (1031 exchange, divorce, estate, relocation)? That informs how much negotiation room exists.
- Schools are B-rated — typically a magnet for longer-tenancy family renters. What's the average tenant stay here, and is there a school-zone premium baked into asking?
- Crime grade is F in this area — have there been break-ins, vandalism, or insurance claims at this property in the last 3 years? What carrier currently insures it and at what premium?
- What's the average days-on-market for RENTAL listings here right now (not sales)? A rising rental-DOM trend means longer vacancies and softer asking-rent achievability than the comps imply.
- What's the recent tenant-quality profile in this submarket — average credit score on applications, eviction rate, late-payment / NSF rate, and stable-employment percentage? A property-management company in the area should have these aggregated.
- How much new for-sale + rental construction is in the pipeline within 1–3 miles? Heavy new supply typically softens prices + rents 12–24 months out; constrained supply supports both.
Investment metrics
- 1% rule
- 1.35% ✓
- Cap rate
- 11.65%
- Cash-on-cash
- 19.12%
- DSCR
- 1.85
- GRM
- 6.2
CMA / ARV
- ARV (on-the-fly)
- $197,160
- Comps found
- 12
Show comp detail 12 sales within ~0.75 mi
| Address | Dist | Beds/Ba | Sqft | Sold | Price | $/sf | Match |
|---|---|---|---|---|---|---|---|
| 3335 Homestead Rd | 0.34mi | 3/2.0 | 1,233 (-1%) | 3mo | $211,500 | $172 | 81 |
| 135 Shiloh Dr | 0.23mi | 3/2.0 | 1,178 (-5%) | 5mo | $194,000 | $165 | 77 |
| 3420 Bentonville Dr | 0.11mi | 3/2.0 | 1,127 (-9%) | 4mo | $158,000 | $140 | 76 |
| 3455 Appomattox Dr | 0.05mi | 3/2.0 | 1,110 (-10%) | 6mo | $134,000 | $121 | 75 |
| 164 Middle Rd | 0.19mi | 3/2.0 | 1,097 (-12%) | 3mo | $182,000 | $166 | 70 |
| 565 Jasper St | 0.30mi | 3/2.0 | 1,316 (+6%) | 9mo | $193,000 | $147 | 68 |
| 3320 Malvern Hill Dr | 0.18mi | 3/2.0 | 1,097 (-12%) | 6mo | $180,000 | $164 | 68 |
| 510 Jasper St | 0.22mi | 3/2.0 | 1,400 (+13%) | 1mo | $200,000 | $143 | 67 |
| 5 Eastwood Oaks | 0.52mi | 3/2.0 | 1,309 (+6%) | 3mo | $187,500 | $143 | 64 |
| 6 Eastwood Oaks St | 0.50mi | 3/2.0 | 1,151 (-7%) | 5mo | $183,000 | $159 | 60 |
| 2965 Beechwood Dr | 0.62mi | 3/2.0 | 1,331 (+7%) | 7mo | $180,000 | $135 | 53 |
| 2930 Alderwood Dr | 0.65mi | 3/2.0 | 1,422 (+15%) | 6mo | $227,000 | $160 | 40 |
Match score weights: distance 35% · size 25% · config 20% · recency 20%. Top-matched comps best support the ARV.
Projected returns pro-forma
-3.0% appreciation · 1.15% rent growth · sell at horizon
- IRR
- 9.0%
- Equity multiple
- 1.35×
- Total profit
- $10,297
- Equity at exit
- $15,805
- IRR
- 16.7%
- Equity multiple
- 2.26×
- Total profit
- $37,302
- Equity at exit
- $9,165
Cash invested: $29,680 (down + closing). Projections, not guarantees.
Landlord ↔ Tenant lean methodology
- Overall (STATE)
- 92 Strongly Landlord-Friendly
- State Arkansas
- 92 Strongly Landlord-Friendly · R+14
- County
- — inherits STATE
- City
- — inherits STATE
ZIP-level market 72032
- Home prices YoY
- -17.0%
- Rents YoY
- 1.1%
- Active inventory
- 187
- Price-to-rent
- 6.2×
Monthly cashflow live
- Estimated rent
- $1,431 medium interval (Pro) →
- Mortgage (P&I)
- −$556
- Tax from tax record
- −$58 /mo · $691/yr
- Insurance
- −$44
- HOA
- −$0
- Vacancy / Maint / Mgmt
- −$300
- Net cashflow
- $473
Break-even live
UW: 25.0% down · 7.5% · 30yr · 1.5% tax · 5.0% vac · 8.0% maint · 8.0% mgmt
Financing live
Cash to close
- Down payment
- $26,500
- Closing costs
- $3,180
- Reserves months
- —
- Total cash needed
- —
Loan-product check · same deal, 3 products live
Conventional
25% down · 7.5% · 30yr
- Down + closing
- —
- Monthly P&I
- —
- Monthly cashflow
- —
- DSCR
- —
- Eligible?
- —
Personal DTI + credit; lowest rate.
DSCR
20% down · 8.5% · 30yr
- Down + closing
- —
- Monthly P&I
- —
- Monthly cashflow
- —
- DSCR
- —
- Eligible?
- —
No personal income docs; deal must DSCR.
Hard money
10% down · 12.0% · 12mo
- Down + closing
- —
- Monthly P&I
- —
- Monthly cashflow
- —
- DSCR
- —
- Eligible?
- —
Short-term bridge; refi at stabilization.
Rent comps 1 comps
| Address | Beds | Baths | Sqft | Rent | $/sqft | DOM | Units | Dist |
|---|---|---|---|---|---|---|---|---|
| 10 Towering Oaks Dr Conway, AR | 3.0 | 1.0 | 1215 | $1,250 | $1.03 | 14d | 1 | 1.02mi |
Listing history 8 events
-
2026-06-18days on market $106,000 Active 9 DOM
-
2026-06-17days on market $106,000 Active 8 DOM
-
2026-06-16days on market $106,000 Active 7 DOM
-
2026-06-16status $106,000 Active 6 DOM
-
2026-06-15days on market $106,000 New Listing 6 DOM
-
2026-06-14days on market $106,000 New Listing 4 DOM
-
2026-06-10remarks 543-char remark
-
2026-06-10$106,000 New Listing 1 DOM
ⓘ Source: listings_history table (triggers on properties + properties_extension) + one-shot
backfill from property_details.listing_events for pre-trigger history.
Tax reassessment forecast AR · Resets to sale price
- Current annual tax
- $691 · $58/mo
- Projected year-2 tax
- $691 · $58/mo
- Expected delta
- $0/yr ($0/mo · 0.0%)
ⓘ Screening estimate from a state-policy table — verify with the county assessor before closing.
Climate risk First Street
- Flood 1/10 Low FEMA zone X (unshaded) · 0% chance over 30 yrs
- Wildfire 5/10 Major
- Heat 7/10 Severe 7 d/yr ≥111°F today · 20 d/yr by 30 yrs out
- Wind 4/10 Moderate 9% chance of damaging wind over 30 yrs
- Air quality 2/10 Low 1 unhealthy d/yr today · 1 by 30 yrs out
Nearby sold comps map
Loading sold comps map…
Walkable amenities ~0.75 mi
Loading nearby amenities…
Taxation est. · year 1
- Rental income
- $17,171
- − Mortgage interest
- −$5,938
- − Property taxes
- −$691
- − Insurance
- −$530
- − Repairs & maintenance
- −$1,374
- − Management
- −$1,374
- − Depreciation
- −$3,084
- Taxable income
- $4,181
- Est. tax owed @ 24.0%
- −$1,004
- After-tax cash flow
- $4,670/yr
For passive investors: Depreciation is non-cash, so a rental often shows a tax loss while cash-flowing — sheltering income. Rental losses are passive: they offset passive income freely, and up to $25,000/yr can offset ordinary (W-2) income if you actively participate and your MAGI is under $100k (phasing out to $0 by $150k); unused losses carry forward. On sale, claimed depreciation is recaptured at up to 25%, and gains may owe capital-gains tax (a 1031 exchange can defer both). Figures are a year-1 estimate at your 24.0% rate — not tax advice; consult a CPA.
Schools (NCES district)
- District
- Conway School District
- NCES district ID
- 0504590
- Math proficiency
- 43% ▼ -17.00%
- Reading proficiency
- 47% ▼ -9.00%
- Median HH income
- $46,270
- Composite
- 38.27/100
- National rank
- #4236
- State rank
- #36 of 238 in AR
Livability — Conway
- Score
- 69/100
- State rank
- #71
- US rank
- #8673
Category grades
Schools grade is shown separately in the Schools card above.
Census & demographics
- County
- Faulkner County · 103,634 people
- City population
- 84,754
- Metro
- Little Rock-North Little Rock-Conway, AR
- Population (ZIP)
- 34,469
- Household income
- $64,695
- Rent vs Own
- Severe rent burden
- 916.0
Population outlook (Faulkner County) Hauer SSP2
- Today (2025)
- 138,985 people
- By 2030
- 148,264 · +6.7%
- By 2040
- 166,010 · +19.4%
- By 2050
- 183,362 · +31.9%
- By 2075
- 224,593 · +61.6%
- By 2100
- 250,603 · +80.3%
Race, ethnicity, and origin ACS 2023
- Neighborhood character
- Predominantly White (72%)
- Race & ethnicity
- White 72% Black 15% Hispanic / Latino 8% Two or more races 4%
- Hispanic origin (detail)
- Mexican 5%
- Common ancestry
- Slovak 1% Serbian 1% Lithuanian 1%
- Foreign-born
- 5% · Canada
- Languages at home
- 93% English-only · Spanish 6%
Political lean MEDSL · Faulkner
- 2024 margin
- Solid R (+32.3) · D 32.6% · R 64.9% · Other 2.5%
- 2008→2024 swing
- -7.1pp toward R · 2008: -25.3pp · 2024: -32.3pp
- All cycles
- 2024: R+32.3 2020: R+29.5 2016: R+31.6 2012: R+31.7 2008: R+25.3
Not yet ingested
- Civics
- —
Market trends
- HPI YoY
- ▼ -48.15%
- Current HPI
- 234.6331
- Rent YoY
- ▲ 1.15%
- Metro
- Little Rock-North Little Rock-Conway, AR
- State GDP YoY
- ▲ 3.80%
- F500 in state
- 10
Industry mix (Fortune 500 HQ in AR)
| Industry | F500 HQs | Revenue |
|---|---|---|
| Retail | 1 | $681B |
|
||
| Food / Agriculture | 1 | $53B |
|
||
| Retail / Energy | 1 | $22B |
|
||
| Transportation / Logistics | 1 | $12B |
|
||
| Energy | 1 | $4B |
|
||
Price history
+76.7% since first listed13 events — show timeline
- 2026-06-09 Listed $106,000 CARMLS
- 2021-03-05 Sold (Public Records) $50,000 Public Records
- 2021-02-11 Sold (MLS) $50,000 CARMLS
- 2021-01-26 Listing Removed — CARMLS
- 2021-01-15 Pending — CARMLS
- 2020-12-15 Price Changed $60,000 CARMLS
- 2020-11-02 Listed $65,000 CARMLS
- 2016-10-09 Listing Removed — CARMLS
- 2016-02-09 Listed $49,900 CARMLS
- 2016-02-09 Listing Removed — CARMLS
- 2015-06-03 Listed $49,500 CARMLS
- 2009-11-16 Sold (Public Records) $46,000 Public Records
- 2005-04-20 Sold (Public Records) $60,000 Public Records
Property tax history
-0.2%/yrLatest (2025): $691 · +0.0% YoY. Source: county tax records.
Cash-flow waterfall
monthlySold comps — $/sqft
last 12 mo · ≤1 miLoading sold comps…