 Duplex
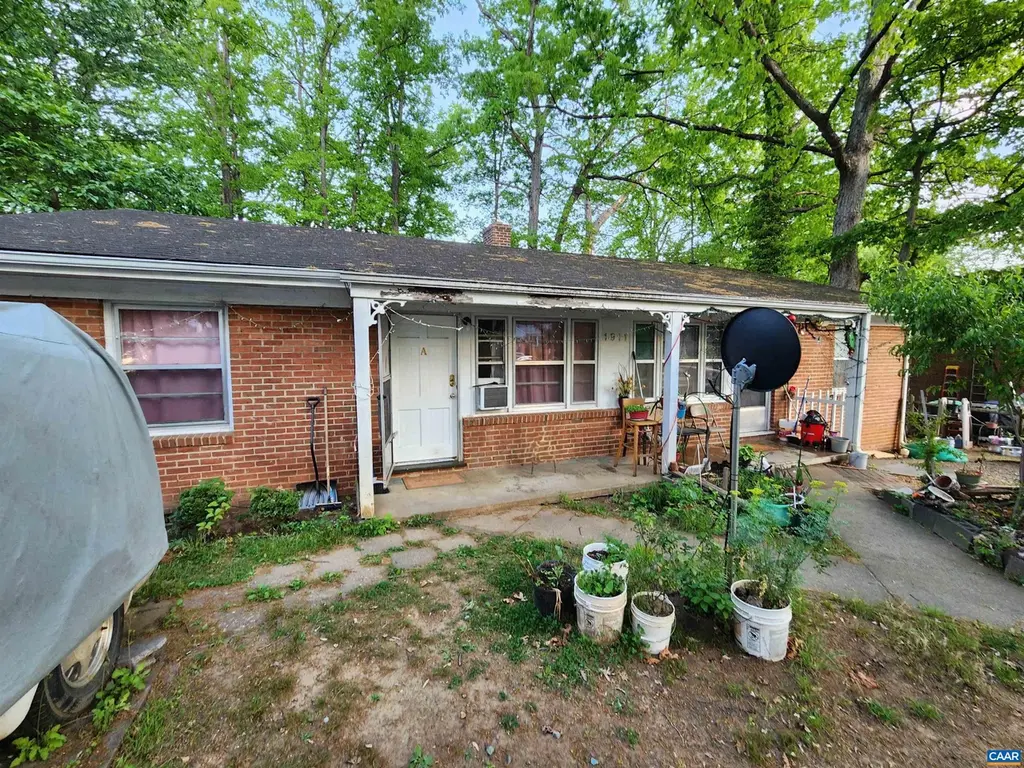
1911 Cedar Hill Rd · Charlottesville, VA
Flood risk 1/10 · Minimal
- FEMA flood zone
- X (unshaded)
- Chance of flooding over 30 yrs
- 0.0%
- Est. flood insurance / yr
- $473 – $860
Fire risk 2/10 · Minimal
- Est. fire insurance / yr
- $666 – $1,236
Heat risk 6/10 · Moderate
- Hot days now (above 103°F)
- 7 days/yr
- Hot days in 30 yrs
- 17 days/yr
Wind risk 2/10 · Minimal
- Chance of severe wind over 30 yrs
- 2.0%
Air-quality risk 1/10 · Minimal
- Unhealthy air days now
- 0 days/yr
- Unhealthy air days in 30 yrs
- 0 days/yr
Risk factors via First Street. Map © Google.
Why this score? — see what drove the D grade
The composite is a weighted blend of 9 inputs, each scored 0–100. Each bar is that input's sub-score; the figure is the points it added to the 100-point composite (weight × sub-score).
- Cash flow +14.3/30.0
- ARV discount +7.5/15.0
- DSCR +4.4/10.0
- Schools +4.4/10.0
- Livability +4.2/5.0
- 1% rule +3.5/10.0
- Rent growth +3.2/5.0
- Condition / age +2.5/5.0
- Appreciation +0.0/10.0
$399,000
🖨 Deal sheet (PDF) 📄 Offer letter ✓ Due diligence
Multi-family units
County records classify this as Multi-Family (2-4 Unit). Listing-text estimate: 2 units. confirmed
Listing remarks
Investor Opportunity or someone looking to house hack. This is a side-by-side duplex, one-level brick ranch. The property is in a prime location across the street from Stonefield Shopping, less than 15 min from UVA.
Key facts
- 0.29 acre lot
- Built 1963
- Listed 11 days
Property features AI
Finance
- Other: Total of 2 residential units
- Financial info: Owner pays insurance and property taxes; Tenants pay electricity, gas, sewer, trash collection, and water
Exterior
- Utilities: Public water; Public sewer; Other utilities
- Home design: Duplex (multi-family)
- Construction: Brick construction; Brick/mortar foundation; Composition shingle roof
- Exterior features: Public road frontage
Interior
- Bedrooms: Two 2-bedroom units
- Flooring: Laminate; Wood
- Bathrooms: Each unit has 1 bathroom
- Heating & cooling: Forced air heating; Central air conditioning
- Interior features: Laminate and wood flooring; Crawl space basement
Neighborhood map
What this means for you Summary
Snapshot
- This is a 2 × 2-bed/1.0-bath units multifamily listed at $399k.
Deal economics
- At list price, monthly cash flow is $75 ($906/yr) — positive. Per door: $38/mo.
- The deal already cash-flows at list — no discount required.
- To meet the 1% rule (rent ≥ 1% of price), the offer needs to be $339k (15.0% below list).
- Recommended offer: $339k (15.0% below list) — sets the bar for 1% rule.
- Cap rate 6.5% vs local median 2.9% in Charlottesville — top-decile yield for the area; either an underpriced asset or a hidden risk that comps aren't pricing in. Stress-test before assuming the spread holds.
Location & tenants
- Location reads 84/100 on livability (#27 in VA, #707 nationally) — a professional / high-income tenant draw. Strengths: amenities A+, commute A+, health & safety A+; Watch: cost of living D, crime D-.
- Charlottesville Cty Public School District (urban): math 42% / reading 61% proficiency, ranked #97 of 131 in VA (top 74%) — acceptable for families but not a draw, mixed tenant base, ~2y average lease.
- Zoned schools: Greenbrier Elementary (math 57% / reading 67%, grade B, #480 of 1,108 statewide, top 46%, 315 students, 43% FRL); Walker Upper Elementary (math 31% / reading 53%, grade D-, #295 of 342 statewide, top 87%, 616 students, 72% FRL); Charlottesville High (math 53% / reading 84%, grade B, #178 of 319 statewide, top 56%, 1,359 students, 72% FRL).
- Market conditions: Rents rising (+2.8%/yr); 388 active listings in the ZIP; 13 comparable units currently listed for rent nearby; rentals at typical pace (median 15d on market — plan ~3-4 weeks tenant-placement turnaround); solid renter incomes; 34 units permitted in Charlottesville city in 2024 (18 in 5+ unit buildings).
- This rent runs 44% of the median local income ($92k/yr) — at the standard rent-burdened threshold; future hikes will face affordability resistance.
Forward outlook
- Local home prices are declining (-3.0%/yr); year-one equity from $3k of loan paydown is wiped out by about $12k of value loss. Plan a longer hold.
- Charlottesville County population projected at +30% by 2050 — long-run rental-demand tailwind backs the buy-and-hold thesis.
Negotiation context
- Only 11 days on market — expect competitive offers; lowballing is unlikely to land.
- Current owner paid $50k; list at $399k implies a 698% gain — meaningful room to come down on a strong offer.
Risks & watch-outs
- Climate carrying-cost: extreme-heat days projected 7→17/yr by 2055 (HVAC capex compounding) — expect insurance premiums to compound above CPI over the hold.
Questions for the listing agent
- Can we see the unit-by-unit rent roll, current vacancy, and any below-market leases? What's the average tenancy length?
- What capital expenditures (roof, boiler, parking lot, exteriors) have been made in the last 5 years, and what's planned in the next 2?
- Built in 1963 — when were the roof, HVAC, electrical panel, plumbing, and water heater last replaced?
- Is there a deadline driving the sale (1031 exchange, divorce, estate, relocation)? That informs how much negotiation room exists.
- Schools are A-rated — typically a magnet for longer-tenancy family renters. What's the average tenant stay here, and is there a school-zone premium baked into asking?
- Crime grade is D in this area — have there been break-ins, vandalism, or insurance claims at this property in the last 3 years? What carrier currently insures it and at what premium?
- The area grade is low — what's the realistic commute time and amenity access for the typical tenant pool here? Any planned neighborhood developments (good or bad) we should know about?
- What's the average days-on-market for RENTAL listings here right now (not sales)? A rising rental-DOM trend means longer vacancies and softer asking-rent achievability than the comps imply.
- What's the recent tenant-quality profile in this submarket — average credit score on applications, eviction rate, late-payment / NSF rate, and stable-employment percentage? A property-management company in the area should have these aggregated.
- How much new apartment / multifamily construction is in the pipeline within 1–3 miles? Heavy new supply (>2% of stock underway) typically softens rents 12–24 months out; light construction supports rent growth.
Investment metrics
- 1% rule
- 0.85% ✗
- Cap rate
- 6.52%
- Cash-on-cash
- 0.81%
- DSCR
- 1.04
- GRM
- 9.8
CMA / ARV
No comps found within radius.
Projected returns pro-forma
-3.0% appreciation · 2.82% rent growth · sell at horizon
- IRR
- -15.2%
- Equity multiple
- 0.46×
- Total profit
- $-60,504
- Equity at exit
- $59,492
- IRR
- -7.0%
- Equity multiple
- 0.56×
- Total profit
- $-49,180
- Equity at exit
- $34,498
Cash invested: $111,720 (down + closing). Projections, not guarantees.
Landlord ↔ Tenant lean methodology
- Overall (STATE)
- 55 Moderately Landlord-Leaning
- State Virginia
- 55 Moderately Landlord-Leaning · D+2
- County
- — inherits STATE
- City
- — inherits STATE
ZIP-level market 22901
- Rents YoY
- 2.8%
- Active inventory
- 388
- Price-to-rent
- 19.6×
Monthly cashflow live
- Estimated rent
- $3,390 high interval (Pro) →
- Mortgage (P&I)
- −$2,092
- Tax from tax record
- −$344 /mo · $4,128/yr
- Insurance
- −$166
- HOA
- −$0
- Vacancy / Maint / Mgmt
- −$712
- Net cashflow
- $75
Break-even live
Sensitivity live
| Price | -10% $301 | -5% $188 | +0% $75 | +5% $-37 | +10% $-150 |
|---|---|---|---|---|---|
| Rent | -10% $-192 | -5% $-58 | +0% $75 | +5% $209 | +10% $343 |
| Rate | -1.0pp $276 | -0.5pp $177 | base $75 | +0.5pp $-28 | +1.0pp $-133 |
2-unit breakdown (identical units grouped — click to expand)
| Units | Beds | Baths | Est. rent |
|---|---|---|---|
| 2× units | 2 | 1 | $3,390 |
| #1 | 2 | 1 | $1,695 |
| #2 | 2 | 1 | $1,695 |
| Total (2 units) | $3,390 | ||
UW: 25.0% down · 7.5% · 30yr · 1.5% tax · 5.0% vac · 8.0% maint · 8.0% mgmt
Financing live
Cash to close
- Down payment
- $99,750
- Closing costs
- $11,970
- Reserves months
- —
- Total cash needed
- —
Loan-product check · same deal, 3 products live
Conventional
25% down · 7.5% · 30yr
- Down + closing
- —
- Monthly P&I
- —
- Monthly cashflow
- —
- DSCR
- —
- Eligible?
- —
Personal DTI + credit; lowest rate.
DSCR
20% down · 8.5% · 30yr
- Down + closing
- —
- Monthly P&I
- —
- Monthly cashflow
- —
- DSCR
- —
- Eligible?
- —
No personal income docs; deal must DSCR.
Hard money
10% down · 12.0% · 12mo
- Down + closing
- —
- Monthly P&I
- —
- Monthly cashflow
- —
- DSCR
- —
- Eligible?
- —
Short-term bridge; refi at stabilization.
Rent comps 13 comps
| Address | Beds | Baths | Sqft | Rent | $/sqft | DOM | Units | Dist |
|---|---|---|---|---|---|---|---|---|
| 2150 Bond St Charlottesville, VA | 3.0 | 3.5 | 1982 | $2,750 | $1.39 | 15d | 1 | 0.22mi |
| 3105 District Ave Charlottesville, VA | 1.0–3.0 | 1.0–2.0 | 1027 | $2,853 | $2.78 | 15d | 24 | 0.25mi |
| 1710 Solomon Rd Unit A Charlottesville, VA | 3.0 | 2.0 | 1664 | $2,195 | $1.32 | 15d | 1 | 0.39mi |
| 112 Brandywine Ct Charlottesville, VA | 3.0 | 2.5 | 1568 | $2,500 | $1.59 | 15d | 1 | 0.58mi |
| 2407 Peyton Dr Charlottesville, VA | 1.0–3.0 | 1.0–1.5 | 905 | $1,636 | $1.81 | 15d | 10 | 0.61mi |
| 7 Georgetown Grn Charlottesville, VA | 4.0 | 3.0 | 2079 | $2,750 | $1.32 | 23d | 1 | 0.72mi |
| 1406 Minor Ridge Ct Unit NA Charlottesville, VA | 3.0 | 1.5 | 1384 | $2,000 | $1.45 | 45d | 1 | 0.92mi |
| 1406 Minor Ridge Ct Charlottesville, VA | 3.0 | 1.5 | 1384 | $2,000 | $1.45 | 15d | 1 | 0.92mi |
| 1429 Gentry Ln Charlottesville, VA | 3.0 | 1.5 | 1438 | $2,300 | $1.60 | 15d | 1 | 0.93mi |
| 1515 Westfield Ct Unit 1 Charlottesville, VA | 3.0 | 2.5 | 1833 | $2,325 | $1.27 | 15d | 1 | 0.93mi |
| 255 Saponi Ln Charlottesville, VA | 3.0 | 1.0–2.5 | 817 | $1,965 | $2.40 | 15d | 21 | 0.98mi |
| 2210 Clubhouse Way Charlottesville, VA | 1.0–3.0 | 1.0–1.5 | 925 | $2,100 | $2.27 | 15d | 26 | 1.05mi |
| 118 Woodlake Dr Charlottesville, VA | 3.0 | 1.5 | 1428 | $2,500 | $1.75 | 45d | 1 | 1.33mi |
Listing history 3 events
-
2026-05-19status Pending
-
2026-05-08$399,000 Active
-
1978-09-05soldstatus $50,000
ⓘ Source: listings_history table (triggers on properties + properties_extension) + one-shot
backfill from property_details.listing_events for pre-trigger history.
Tax reassessment forecast VA · Resets to sale price
- Current annual tax
- $4,128 · $344/mo
- Projected year-2 tax
- $4,128 · $344/mo
- Expected delta
- $0/yr ($0/mo · 0.0%)
ⓘ Screening estimate from a state-policy table — verify with the county assessor before closing.
Climate risk First Street
- Flood 1/10 Low FEMA zone X (unshaded) · 0% chance over 30 yrs
- Wildfire 2/10 Low
- Heat 6/10 Major 7 d/yr ≥103°F today · 17 d/yr by 30 yrs out
- Wind 2/10 Low 2% chance of damaging wind over 30 yrs
- Air quality 1/10 Low 0 unhealthy d/yr today · 0 by 30 yrs out
Nearby sold comps map
Loading sold comps map…
Walkable amenities ~0.75 mi
Loading nearby amenities…
Taxation est. · year 1
- Rental income
- $40,680
- − Mortgage interest
- −$22,350
- − Property taxes
- −$4,128
- − Insurance
- −$1,995
- − Repairs & maintenance
- −$3,254
- − Management
- −$3,254
- − Depreciation
- −$11,607
- Taxable loss
- −$5,909
- Est. tax savings @ 24.0%
- +$1,418
- After-tax cash flow
- $2,324/yr
For passive investors: Depreciation is non-cash, so a rental often shows a tax loss while cash-flowing — sheltering income. Rental losses are passive: they offset passive income freely, and up to $25,000/yr can offset ordinary (W-2) income if you actively participate and your MAGI is under $100k (phasing out to $0 by $150k); unused losses carry forward. On sale, claimed depreciation is recaptured at up to 25%, and gains may owe capital-gains tax (a 1031 exchange can defer both). Figures are a year-1 estimate at your 24.0% rate — not tax advice; consult a CPA.
Schools (NCES district)
- District
- Charlottesville Cty Public School District
- NCES district ID
- 5100780
- Math proficiency
- 42% ▼ -30.00%
- Reading proficiency
- 61% ▼ -10.00%
- Median HH income
- $47,211
- Composite
- 43.68/100
- National rank
- #2957
- State rank
- #97 of 131 in VA
Livability — Charlottesville
- Score
- 84/100
- State rank
- #27
- US rank
- #707
Category grades
Schools grade is shown separately in the Schools card above.
Census & demographics
- Census place
- Charlottesville, VA
- County
- Albemarle County · 129,350 people
- City population
- 120,202
- Metro
- Charlottesville, VA
- Population (ZIP)
- 37,237
- Household income
- $92,145
- Rent vs Own
- Severe rent burden
- 2109.0
Population outlook (Charlottesville County) Hauer SSP2
- Today (2025)
- 53,816 people
- By 2030
- 57,857 · +7.5%
- By 2040
- 63,933 · +18.8%
- By 2050
- 69,676 · +29.5%
- By 2075
- 77,018 · +43.1%
- By 2100
- 82,078 · +52.5%
Race, ethnicity, and origin ACS 2023
- Neighborhood character
- Predominantly White (70%)
- Race & ethnicity
- White 70% Black 12% Hispanic / Latino 9% Two or more races 6% Asian 5%
- Hispanic origin (detail)
- Mexican 1%
- Common ancestry
- Romanian 3% Slovak 3% Lithuanian 2%
- Foreign-born
- 12% · Canada, China, South Korea
- Languages at home
- 84% English-only · Spanish 8% Other Indo-European 2% Other Asian/Pacific 1%
Political lean MEDSL · Charlottesville
- 2024 margin
- Solid D (+68.7) · D 83.4% · R 14.7% · Other 1.9%
- 2008→2024 swing
- +10.7pp toward D · 2008: 58.0pp · 2024: 68.7pp
- All cycles
- 2024: D+68.7 2020: D+72.7 2016: D+67.1 2012: D+53.4 2008: D+58.0
Not yet ingested
- Civics
- —
Market trends
- HPI YoY
- ▼ -341.65%
- Current HPI
- 279.3342
- Rent YoY
- ▲ 2.82%
- Metro
- Charlottesville, VA
- State GDP YoY
- ▲ 2.40%
- F500 in state
- 50
Industry mix (Fortune 500 HQ in VA)
| Industry | F500 HQs | Revenue |
|---|---|---|
| Aerospace / Defense | 4 | $236B |
|
||
| Technology / Defense | 3 | $32B |
|
||
| Financial Services | 2 | $176B |
|
||
| Utilities | 2 | $27B |
|
||
| Insurance | 2 | $25B |
|
||
| Technology | 2 | $15B |
|
||
Price history
+698.0% since first listed3 events — show timeline
- 2026-05-19 Pending — CAAR
- 2026-05-08 Listed $399,000 CAAR
- 1978-09-05 Sold (Public Records) $50,000 Public Records
Property tax history
+4.5%/yrLatest (2026): $4,128 · +2.1% YoY. Source: county tax records.
Cash-flow waterfall
monthlySold comps — $/sqft
last 12 mo · ≤1 miLoading sold comps…