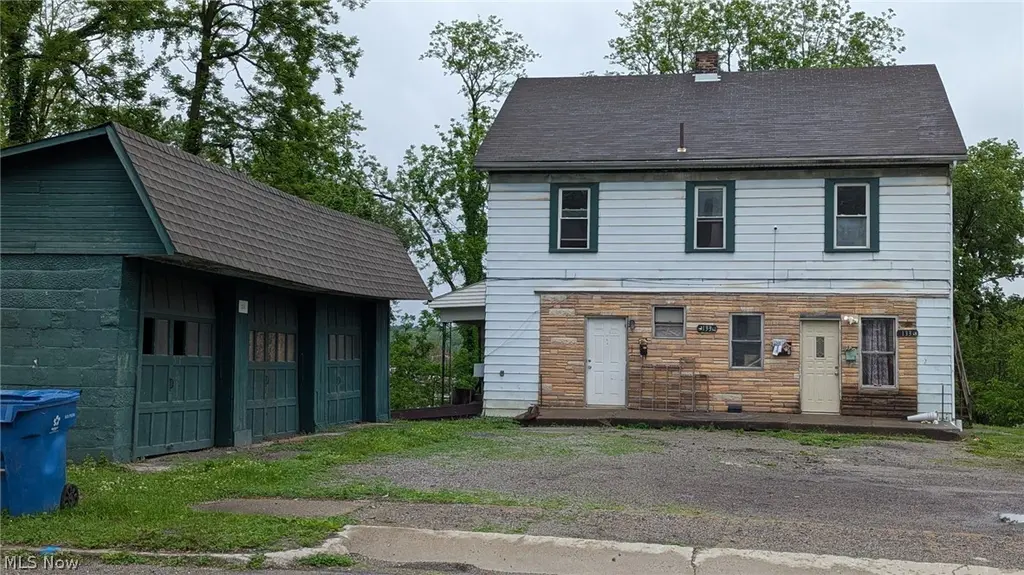
133 Parkway St · Struthers, OH
Flood risk 1/10 · Minimal
- FEMA flood zone
- X (unshaded)
- Chance of flooding over 30 yrs
- 0.0%
- Est. flood insurance / yr
- $473 – $860
Fire risk 1/10 · Minimal
- Est. fire insurance / yr
- $713 – $1,323
Heat risk 3/10 · Minor
- Hot days now (above 96°F)
- 7 days/yr
- Hot days in 30 yrs
- 17 days/yr
Wind risk 1/10 · Minimal
- Chance of severe wind over 30 yrs
- —
Air-quality risk 3/10 · Minor
- Unhealthy air days now
- 1 days/yr
- Unhealthy air days in 30 yrs
- 4 days/yr
Risk factors via First Street. Map © Google.
Why this score? — see what drove the C+ grade
The composite is a weighted blend of 9 inputs, each scored 0–100. Each bar is that input's sub-score; the figure is the points it added to the 100-point composite (weight × sub-score).
- Cash flow +21.9/30.0
- ARV discount +15.0/15.0
- DSCR +7.0/10.0
- 1% rule +4.8/10.0
- Schools +4.0/10.0
- Livability +3.6/5.0
- Appreciation +2.9/10.0
- Rent growth +2.5/5.0
- Condition / age +2.5/5.0
$144,500
🖨 Deal sheet (PDF) 📄 Offer letter ✓ Due diligence
Listing remarks MLS
Aluminium sided 2 1/2 story tri-plex. Up/down units including two two bedroom units plus efficiency unit. Owner pays all utilities. Fully occupied. Interior includes freshly painted plus new carpeting.
Key facts
- 0.68 acre lot
- 3 garage spots
- Built 1910
Property features AI
Finance
- Other: Below-grade finished area reported separately (finished lower level); Above-grade finished area reported separately
- Financial info: Gross rental income reported as $27,600; Unit rents: one 2-bed at $750/month and one efficiency at $700/month
Exterior
- Parking: Detached garage with 3 garage spaces
- Utilities: Public water; Public sewer
- Home design: Two-story building; One building on the lot
- Construction: Built per assessor records; Asphalt/fiberglass roof
- Exterior features: Lot approximately 0.679 acres; Stone veneer and aluminum siding exterior
Interior
- Bedrooms: Two-bedroom units (in multi-unit building); One-bedroom efficiency unit (in multi-unit building)
- Bathrooms: Three full bathrooms total; Each unit includes 1 bathroom
- Heating & cooling: Gas forced-air heating; Window cooling units
- Interior features: Partial finished basement; Total of 9 rooms
Neighborhood map
What this means for you Summary
Snapshot
- This is a 4-bed/2.5-bath single-family listed at $144k.
Deal economics
- At list price, monthly cash flow is $228 ($3k/yr) — positive.
- The deal already cash-flows at list — no discount required.
- To meet the 1% rule (rent ≥ 1% of price), the offer needs to be $141k (2.4% below list).
- Recommended offer: $141k (2.4% below list) — sets the bar for 1% rule.
- Cap rate 8.2% vs local median 6.4% in Struthers — meaningfully above typical; check what's discounted (condition, days-on-market, listing class) to confirm the premium yield is real.
Location & tenants
- Location reads 71/100 on livability (#418 in OH) — a middle-class / working-renter tenant base. Strengths: cost of living A+, housing A+, crime B; Watch: commute C-, amenities F, employment F.
- Struthers City (suburban): math 45% / reading 52% proficiency, ranked #475 of 656 in OH (top 72%) — families likely to look elsewhere, expect single-tenant / working-renter base with shorter leases.
- Market conditions: 66 active listings in the ZIP; 2 comparable units currently listed for rent nearby; 147 units permitted in Mahoning County in 2024 (0 in 5+ unit buildings).
- This rent runs 32% of the median local income ($53k/yr) — at the standard rent-burdened threshold; future hikes will face affordability resistance.
Forward outlook
- Local home prices are declining (-3.0%/yr); year-one equity from $999 of loan paydown is wiped out by about $4k of value loss. Plan a longer hold.
- Mahoning County population projected at -14% by 2050 — secular population decline; favor cash flow + early exit over multi-decade hold.
Negotiation context
- It's been on market 20 days — a 2% lower offer ($142k) is reasonable based on typical stale-listing flexibility.
- 2 sale attempts since 20y ago with the ask held roughly flat each time — persistent listings suggest the price (not the market) is what's stuck; bring a comps-based counter.
- Current owner paid $39k; list at $144k implies a 271% gain — meaningful room to come down on a strong offer.
Risks & watch-outs
- Watch-outs: built in 1910 — expect roof / HVAC / electrical / plumbing capex.
Questions for the listing agent
- Built in 1910 — when were the roof, HVAC, electrical panel, plumbing, and water heater last replaced?
- Is there a deadline driving the sale (1031 exchange, divorce, estate, relocation)? That informs how much negotiation room exists.
- Schools are B-rated — typically a magnet for longer-tenancy family renters. What's the average tenant stay here, and is there a school-zone premium baked into asking?
- What's the average days-on-market for RENTAL listings here right now (not sales)? A rising rental-DOM trend means longer vacancies and softer asking-rent achievability than the comps imply.
- What's the recent tenant-quality profile in this submarket — average credit score on applications, eviction rate, late-payment / NSF rate, and stable-employment percentage? A property-management company in the area should have these aggregated.
- How much new for-sale + rental construction is in the pipeline within 1–3 miles? Heavy new supply typically softens prices + rents 12–24 months out; constrained supply supports both.
Investment metrics
- 1% rule
- 0.98% ✗
- Cap rate
- 8.19%
- Cash-on-cash
- 6.77%
- DSCR
- 1.30
- GRM
- 8.5
CMA / ARV
- ARV (on-the-fly)
- $201,600
- Comps found
- 7
Show comp detail 7 sales within ~0.75 mi
| Address | Dist | Beds/Ba | Sqft | Sold | Price | $/sf | Match |
|---|---|---|---|---|---|---|---|
| 97 Overlook Blvd | 0.56mi | 3/3.0 (-1) | 2,055 (-8%) | 4mo | $203,000 | $99 | 50 |
| 129 Sexton St | 0.45mi | 4/1.5 | 1,932 (-14%) | 5mo | $160,000 | $83 | 48 |
| 18 Hawthorne St | 0.34mi | 5/1.5 (+1) | 1,980 (-12%) | 11mo | $40,000 | $20 | 46 |
| 15 Hawthorne | 0.37mi | 5/3.0 (+1) | 2,054 (-8%) | 23mo | $180,000 | $88 | 43 |
| 87 Overlook Blvd | 0.54mi | 4/3.0 | 2,072 (-8%) | 21mo | $234,500 | $113 | 42 |
| 100 Snyder Ave | 0.74mi | 3/3.0 (-1) | 2,100 (-6%) | 10mo | $189,150 | $90 | 40 |
| 264 Center St | 0.67mi | 3/1.5 (-1) | 1,976 (-12%) | 12mo | $212,000 | $107 | 30 |
Match score weights: distance 35% · size 25% · config 20% · recency 20%. Top-matched comps best support the ARV.
Projected returns pro-forma
-3.0% appreciation · 3.0% rent growth · sell at horizon
- IRR
- -5.9%
- Equity multiple
- 0.78×
- Total profit
- $-8,921
- Equity at exit
- $21,545
- IRR
- 3.7%
- Equity multiple
- 1.27×
- Total profit
- $10,762
- Equity at exit
- $12,494
Cash invested: $40,460 (down + closing). Projections, not guarantees.
Landlord ↔ Tenant lean methodology
- Overall (STATE)
- 73 Landlord-Friendly
- State Ohio
- 73 Landlord-Friendly · R+6
- County
- — inherits STATE
- City
- — inherits STATE
ZIP-level market 44471
- Home prices YoY
- -1.5%
- Active inventory
- 66
- Price-to-rent
- 8.5×
Monthly cashflow live
- Estimated rent
- $1,410 medium interval (Pro) →
- Mortgage (P&I)
- −$758
- Tax from tax record
- −$68 /mo · $813/yr
- Insurance
- −$60
- HOA
- −$0
- Vacancy / Maint / Mgmt
- −$296
- Net cashflow
- $228
Break-even live
Sensitivity live
| Price | -10% $310 | -5% $269 | +0% $228 | +5% $187 | +10% $147 |
|---|---|---|---|---|---|
| Rent | -10% $117 | -5% $173 | +0% $228 | +5% $284 | +10% $340 |
| Rate | -1.0pp $301 | -0.5pp $265 | base $228 | +0.5pp $191 | +1.0pp $153 |
UW: 25.0% down · 7.5% · 30yr · 1.5% tax · 5.0% vac · 8.0% maint · 8.0% mgmt
Financing live
Cash to close
- Down payment
- $36,125
- Closing costs
- $4,335
- Reserves months
- —
- Total cash needed
- —
Loan-product check · same deal, 3 products live
Conventional
25% down · 7.5% · 30yr
- Down + closing
- —
- Monthly P&I
- —
- Monthly cashflow
- —
- DSCR
- —
- Eligible?
- —
Personal DTI + credit; lowest rate.
DSCR
20% down · 8.5% · 30yr
- Down + closing
- —
- Monthly P&I
- —
- Monthly cashflow
- —
- DSCR
- —
- Eligible?
- —
No personal income docs; deal must DSCR.
Hard money
10% down · 12.0% · 12mo
- Down + closing
- —
- Monthly P&I
- —
- Monthly cashflow
- —
- DSCR
- —
- Eligible?
- —
Short-term bridge; refi at stabilization.
Rent comps 2 comps
| Address | Beds | Baths | Sqft | Rent | $/sqft | DOM | Units | Dist |
|---|---|---|---|---|---|---|---|---|
| 465 W Omar St Struthers, OH | 3.0 | 2.0 | 1544 | $1,800 | $1.17 | 14d | 1 | 1.25mi |
| 127 Oxford St Campbell, OH | 3.0 | 1.0 | 1575 | $975 | $0.62 | 44d | 1 | 1.42mi |
Listing history 15 events
-
2026-06-19days on market $144,500 Active 20 DOM
-
2026-06-18days on market $144,500 Active 19 DOM
-
2026-06-17days on market $144,500 Active 18 DOM
-
2026-06-16status $144,500 Active 17 DOM
-
2026-06-08status $144,500 Pending 17 DOM
-
2026-06-07days on market $144,500 Active 17 DOM
-
2026-06-03days on market $144,500 Active 13 DOM
-
2026-06-02days on market $144,500 Active 12 DOM
-
2026-06-01days on market $144,500 Active 11 DOM
-
2026-05-31days on market $144,500 Active 10 DOM
-
2026-05-30days on market $144,500 Active 9 DOM
-
2026-05-20$144,500 Active
-
2025-08-06price $159,900
-
2007-12-20soldstatus $39,000 201-char remark
Show marketing remark (201 chars)
Aluminium sided 2 1/2 story tri-plex. Up/down units including two two bedroom units plus efficiency unit. Owner pays all utilities. Fully occupied. Interior includes freshly painted plus new carpeting.
-
2006-12-14$49,900 201-char remark
Show marketing remark (201 chars)
Aluminium sided 2 1/2 story tri-plex. Up/down units including two two bedroom units plus efficiency unit. Owner pays all utilities. Fully occupied. Interior includes freshly painted plus new carpeting.
ⓘ Source: listings_history table (triggers on properties + properties_extension) + one-shot
backfill from property_details.listing_events for pre-trigger history.
Tax reassessment forecast OH · Partial reset (capped growth)
- Current annual tax
- $813 · $68/mo
- Projected year-2 tax
- $1,533 · $128/mo
- Expected delta
- +$721/yr (+$60/mo · 88.7%)
ⓘ Screening estimate from a state-policy table — verify with the county assessor before closing.
Climate risk First Street
- Flood 1/10 Low FEMA zone X (unshaded) · 0% chance over 30 yrs
- Wildfire 1/10 Low
- Heat 3/10 Moderate 7 d/yr ≥96°F today · 17 d/yr by 30 yrs out
- Wind 1/10 Low
- Air quality 3/10 Moderate 1 unhealthy d/yr today · 4 by 30 yrs out
Nearby sold comps map
Loading sold comps map…
Walkable amenities ~0.75 mi
Loading nearby amenities…
Taxation est. · year 1
- Rental income
- $16,922
- − Mortgage interest
- −$8,094
- − Property taxes
- −$813
- − Insurance
- −$722
- − Repairs & maintenance
- −$1,354
- − Management
- −$1,354
- − Depreciation
- −$4,204
- Taxable income
- $381
- Est. tax owed @ 24.0%
- −$92
- After-tax cash flow
- $2,648/yr
For passive investors: Depreciation is non-cash, so a rental often shows a tax loss while cash-flowing — sheltering income. Rental losses are passive: they offset passive income freely, and up to $25,000/yr can offset ordinary (W-2) income if you actively participate and your MAGI is under $100k (phasing out to $0 by $150k); unused losses carry forward. On sale, claimed depreciation is recaptured at up to 25%, and gains may owe capital-gains tax (a 1031 exchange can defer both). Figures are a year-1 estimate at your 24.0% rate — not tax advice; consult a CPA.
Schools (NCES district)
- District
- Struthers City
- NCES district ID
- 3904485
- Math proficiency
- 45% ▼ -12.00%
- Reading proficiency
- 52% ▼ -8.00%
- Median HH income
- $37,753
- Composite
- 40.35/100
- National rank
- #3742
- State rank
- #475 of 656 in OH
Livability — Struthers
- Score
- 71/100
- State rank
- #418
- US rank
- #6867
Category grades
Schools grade is shown separately in the Schools card above.
Census & demographics
- Census place
- Struthers, OH
- County
- Mahoning · 224,175 people
- City population
- 10,296
- Metro
- Youngstown-Warren, OH
- Population (ZIP)
- 10,296
- Household income
- $52,811
- Rent vs Own
- Severe rent burden
- 12.2
Population outlook (Mahoning County) Hauer SSP2
- Today (2025)
- 223,932 people
- By 2030
- 218,387 · -2.5%
- By 2040
- 205,367 · -8.3%
- By 2050
- 193,606 · -13.5%
- By 2075
- 173,694 · -22.4%
- By 2100
- 151,147 · -32.5%
Race, ethnicity, and origin ACS 2023
- Neighborhood character
- Predominantly White (82%)
- Race & ethnicity
- White 82% Hispanic / Latino 8% Two or more races 8% Black 4% Asian 1%
- Hispanic origin (detail)
- Mexican 2% Puerto Rican 5%
- Common ancestry
- Romanian 8% Lithuanian 4% Slovak 1%
- Foreign-born
- 2% · Canada
- Languages at home
- 94% English-only · Spanish 4% Arabic 1% Other Indo-European 1%
Political lean MEDSL · Mahoning
- 2024 margin
- Lean R (+9.4) · D 44.9% · R 54.4%
- 2008→2024 swing
- -36.1pp toward R · 2008: 26.6pp · 2024: -9.4pp
- All cycles
- 2024: R+9.4 2020: R+1.9 2016: D+3.0 2012: D+27.7 2008: D+26.6
Not yet ingested
- Civics
- —
Market trends
- HPI YoY
- ▼ -4.12%
- Current HPI
- 274.6394
- Rent YoY
- —
- Metro
- —
- State GDP YoY
- ▲ 1.98%
- F500 in state
- 48
Industry mix (Fortune 500 HQ in OH)
| Industry | F500 HQs | Revenue |
|---|---|---|
| Insurance | 3 | $145B |
|
||
| Industrial Machinery | 3 | $49B |
|
||
| Financial Services | 3 | $24B |
|
||
| Consumer Goods | 2 | $93B |
|
||
| Aerospace / Defense | 2 | $47B |
|
||
| Utilities | 2 | $33B |
|
||
Price history
+189.6% since first listed4 events — show timeline
- 2026-05-20 Listed $144,500 MLSNOW
- 2025-08-06 Price Changed $159,900 MLSNOW
- 2007-12-20 Sold (MLS) $39,000 MLSNOW
- 2006-12-14 Listed $49,900 MLSNOW
Property tax history
+4.3%/yrLatest (2025): $813 · -0.0% YoY. Source: county tax records.
Cash-flow waterfall
monthlySold comps — $/sqft
last 12 mo · ≤1 miLoading sold comps…