 Duplex
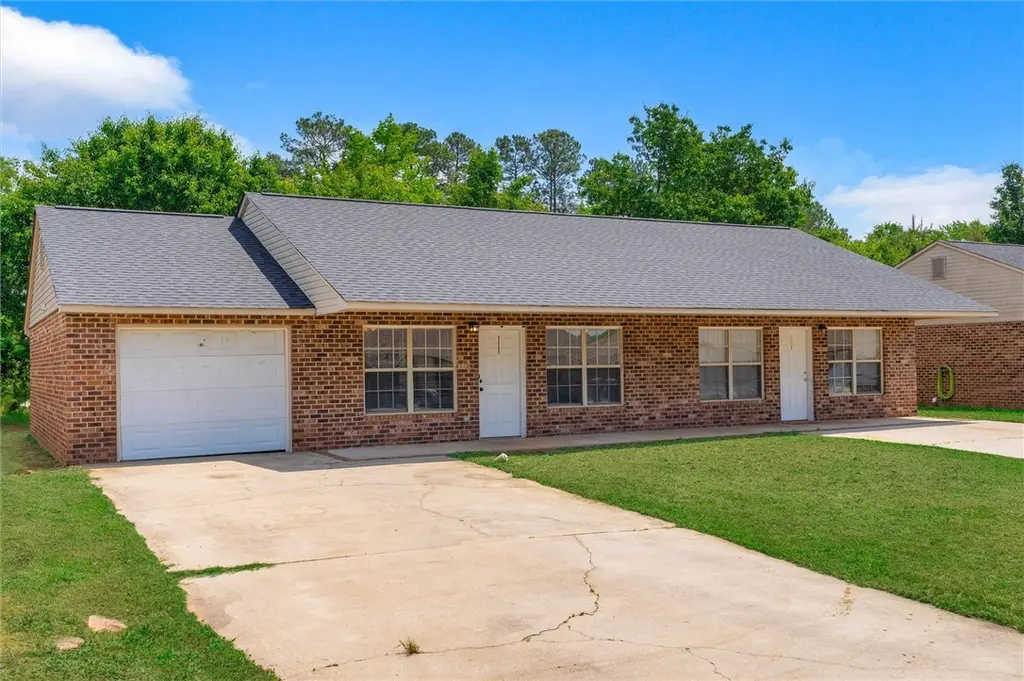
111 and 113 Premier Ct · Anderson, SC
Flood risk 1/10 · Minimal
- FEMA flood zone
- X (unshaded)
- Chance of flooding over 30 yrs
- 0.0%
- Est. flood insurance / yr
- $507 – $1,088
Fire risk 3/10 · Minor
- Est. fire insurance / yr
- $783 – $1,453
Heat risk 6/10 · Moderate
- Hot days now (above 106°F)
- 7 days/yr
- Hot days in 30 yrs
- 17 days/yr
Wind risk 3/10 · Minor
- Chance of severe wind over 30 yrs
- 5.0%
Air-quality risk 4/10 · Minor
- Unhealthy air days now
- 3 days/yr
- Unhealthy air days in 30 yrs
- 5 days/yr
Risk factors via First Street. Map © Google.
Why this score? — see what drove the B- grade
The composite is a weighted blend of 9 inputs, each scored 0–100. Each bar is that input's sub-score; the figure is the points it added to the 100-point composite (weight × sub-score).
- Cash flow +27.0/30.0
- DSCR +9.3/10.0
- ARV discount +7.5/15.0
- 1% rule +7.3/10.0
- Rent growth +4.1/5.0
- Condition / age +4.0/5.0
- Schools +3.9/10.0
- Livability +3.4/5.0
- Appreciation +0.0/10.0
$223,000
🖨 Deal sheet 📄 Offer letter ✓ Due diligence
Multi-family units
County records classify this as Multi-Family (2-4 Unit). Listing-text estimate: 2 units. confirmed
Listing remarks MLS
Don't miss a great opportunity to own this recently remodeled duplex that's already an income producer each side has 2 bed 1 bath and One side has a 1 car garage this property also has an all brick exterior
Key facts
- Fresh paint
- Newer roof
- New flooring
Tags
Property features AI
Finance
- Financial info: Twelve-month lease term
Exterior
- Parking: Garage
- Utilities: Public water; Public sewer
- Home design: Single-story; Brick construction
- Construction: Built within the last 21–30 years; Architectural shingle roof; Slab foundation
- Exterior features: City lot; Not in a subdivision; Paved parking
Interior
- Kitchen: Dishwasher; Oven; Range; Refrigerator; Water heater
- Heating & cooling: Heat pump for heating; Electric heating; Heat pump for cooling
- Interior features: Two-unit property
Neighborhood map
What this means for you Summary
Snapshot
- This is a 2 × 2-bed/1-bath units multifamily listed at $223k. Condition is rated good.
Deal economics
- At list price, monthly cash flow is $624 ($7k/yr) — positive. Per door: $312/mo.
- The deal already cash-flows at list — no discount required.
- Meets the 1% rule at list price ($3k rent vs $223k).
- Recommended offer: $216k (3.0% below list) — sets the bar for market timing.
- Cap rate 9.7% vs local median 3.3% in Anderson — top-decile yield for the area; either an underpriced asset or a hidden risk that comps aren't pricing in. Stress-test before assuming the spread holds.
Location & tenants
- Location reads 67/100 on livability (#98 in SC) — a middle-class / working-renter tenant base. Strengths: cost of living A+, health & safety A+, housing B+; Watch: amenities C-, schools D+, crime F.
- Anderson 05 (suburban): math 44% / reading 49% proficiency, ranked #20 of 80 in SC (top 25%) — families likely to look elsewhere, expect single-tenant / working-renter base with shorter leases.
- Market conditions: Rents rising fast (+6.5%/yr); 678 active listings in the ZIP; 7 comparable units currently listed for rent nearby; rentals leasing fast (median 3d on market — plan ~1-2 weeks tenant-placement turnaround); 1,255 units permitted in Anderson County in 2024 (0 in 5+ unit buildings).
- This rent runs 44% of the median local income ($74k/yr) — at the standard rent-burdened threshold; future hikes will face affordability resistance.
Forward outlook
- Local home prices are declining (-3.0%/yr); year-one equity from $2k of loan paydown is wiped out by about $7k of value loss. Plan a longer hold.
- Anderson County population projected at +14% by 2050 — modest demand growth; plan on rents tracking national, not racing it.
- At projected returns (-3.0% appreciation + 6.5% rent growth), your $62k cash investment doubles in ~8 years — after that, you're playing with house money.
Negotiation context
- It's been on market 50 days — a 3% lower offer ($216k) is reasonable based on typical stale-listing flexibility.
- 5 sale attempts since 7y ago with the ask held roughly flat each time — persistent listings suggest the price (not the market) is what's stuck; bring a comps-based counter.
- Current owner paid $190k; 17% above their basis — modest negotiation headroom, anchor on the comps not their cost.
Risks & watch-outs
- Climate carrying-cost: extreme-heat days projected 7→17/yr by 2055 (HVAC capex compounding) — expect insurance premiums to compound above CPI over the hold.
Questions for the listing agent
- It's been on market 50 days. Have you received any prior offers? Is the seller open to a 3% concession, seller financing, or rate buy-down credit?
- Can we see the unit-by-unit rent roll, current vacancy, and any below-market leases? What's the average tenancy length?
- What capital expenditures (roof, boiler, parking lot, exteriors) have been made in the last 5 years, and what's planned in the next 2?
- Is there a deadline driving the sale (1031 exchange, divorce, estate, relocation)? That informs how much negotiation room exists.
- Schools are D-rated, which usually means shorter tenancies and higher turnover. Who's the typical renter profile here, and what's been the actual vacancy rate?
- Crime grade is F in this area — have there been break-ins, vandalism, or insurance claims at this property in the last 3 years? What carrier currently insures it and at what premium?
- What's the average days-on-market for RENTAL listings here right now (not sales)? A rising rental-DOM trend means longer vacancies and softer asking-rent achievability than the comps imply.
- What's the recent tenant-quality profile in this submarket — average credit score on applications, eviction rate, late-payment / NSF rate, and stable-employment percentage? A property-management company in the area should have these aggregated.
- How much new apartment / multifamily construction is in the pipeline within 1–3 miles? Heavy new supply (>2% of stock underway) typically softens rents 12–24 months out; light construction supports rent growth.
Investment metrics
- 1% rule
- 1.23% ✓
- Cap rate
- 9.65%
- Cash-on-cash
- 12.00%
- DSCR
- 1.53
- GRM
- 6.8
CMA / ARV
No comps found within radius.
Show comp detail 3 sales within ~0.75 mi
| Address | Dist | Beds/Ba | Sqft | Sold | Price | $/sf | Match |
|---|---|---|---|---|---|---|---|
| 606 Highway 29 Byp | 0.09mi | 6/6.0 | 2,400 | 4mo | $300,000 | $125 | 80 |
| 106 & 108 Premier Ct | 0.05mi | —/— | — | 16mo | $195,000 | — | 72 |
| 102 & 104 Premier Ct | 0.06mi | —/— | — | 16mo | $195,000 | — | 71 |
Match score weights: distance 35% · size 25% · config 20% · recency 20%. Top-matched comps best support the ARV.
Projected returns pro-forma
-3.0% appreciation · 6.55% rent growth · sell at horizon
- IRR
- 5.5%
- Equity multiple
- 1.22×
- Total profit
- $13,806
- Equity at exit
- $33,250
- IRR
- 17.9%
- Equity multiple
- 2.73×
- Total profit
- $108,150
- Equity at exit
- $19,281
Cash invested: $62,440 (down + closing). Projections, not guarantees.
Landlord ↔ Tenant lean methodology
- Overall (STATE)
- 90 Strongly Landlord-Friendly
- State South Carolina
- 90 Strongly Landlord-Friendly · R+6
- County
- — inherits STATE
- City
- — inherits STATE
ZIP-level market 29621
- Rents YoY
- 6.5%
- Active inventory
- 678
- Price-to-rent
- 13.6×
Monthly cashflow live
- Estimated rent
- $2,741 high interval (Pro) →
- Mortgage (P&I)
- −$1,169
- Tax est. 1.5%
- −$279 /mo · $3,345/yr
- Insurance
- −$93
- HOA
- −$0
- Vacancy / Maint / Mgmt
- −$576
- Net cashflow
- $624
Break-even live
2-unit breakdown (identical units grouped — click to expand)
| Units | Beds | Baths | Est. rent |
|---|---|---|---|
| 2× units | 2 | 1 | $2,742 |
| #1 | 2 | 1 | $1,371 |
| #2 | 2 | 1 | $1,371 |
| Total (2 units) | $2,741 | ||
UW: 25.0% down · 7.5% · 30yr · 1.5% tax · 5.0% vac · 8.0% maint · 8.0% mgmt
Financing live
Cash to close
- Down payment
- $55,750
- Closing costs
- $6,690
- Reserves months
- —
- Total cash needed
- —
Loan-product check · same deal, 3 products live
Conventional
25% down · 7.5% · 30yr
- Down + closing
- —
- Monthly P&I
- —
- Monthly cashflow
- —
- DSCR
- —
- Eligible?
- —
Personal DTI + credit; lowest rate.
DSCR
20% down · 8.5% · 30yr
- Down + closing
- —
- Monthly P&I
- —
- Monthly cashflow
- —
- DSCR
- —
- Eligible?
- —
No personal income docs; deal must DSCR.
Hard money
10% down · 12.0% · 12mo
- Down + closing
- —
- Monthly P&I
- —
- Monthly cashflow
- —
- DSCR
- —
- Eligible?
- —
Short-term bridge; refi at stabilization.
Rent comps 7 comps
| Address | Beds | Baths | Sqft | Rent | $/sqft | DOM | Units | Dist |
|---|---|---|---|---|---|---|---|---|
| 305 Cedar Rdg Anderson, SC | 3.0 | 2.5 | 1603 | $1,745 | $1.09 | 3d | 1 | 0.60mi |
| 209 Polaris St Anderson, SC | 3.0 | 2.0 | 1500 | $1,500 | $1.00 | 10d | 1 | 0.67mi |
| 415 Nelson Dr Unit C Anderson, SC | 2.0 | 1.5 | — | $895 | — | 3d | 1 | 1.04mi |
| 226 Islay WAY Anderson, SC | 3.0 | 2.5 | 1411 | $1,695 | $1.20 | 3d | 1 | 1.07mi |
| 531 Mildred St Anderson, SC | 2.0 | 1.0 | 800 | $950 | $1.19 | 3d | 1 | 1.17mi |
| 2219 Snow Rd Anderson, SC | 1.0 | 1.0 | 1500 | $850 | $0.57 | 3d | 1 | 1.27mi |
| 119 Woodland Dr Unit B Anderson, SC | 2.0 | 1.5 | 1100 | $895 | $0.81 | 24d | 1 | 1.37mi |
Listing history 26 events
-
2026-06-18days on market $223,000 Active 50 DOM
-
2026-06-17days on market $223,000 Active 49 DOM
-
2026-06-16days on market $223,000 Active 48 DOM
-
2026-06-15days on market $223,000 Active 47 DOM
-
2026-06-13days on market $223,000 Active 45 DOM
-
2026-06-10days on market $223,000 Active 42 DOM
-
2026-06-09days on market $223,000 Active 41 DOM
-
2026-06-08days on market $223,000 Active 40 DOM
-
2026-06-07days on market $223,000 Active 39 DOM
-
2026-06-05days on market $223,000 Active 36 DOM
-
2026-06-03days on market $223,000 Active 35 DOM
-
2026-06-03days on market $223,000 Active 34 DOM
-
2026-06-01days on market $223,000 Active 33 DOM
-
2026-05-31days on market $223,000 Active 32 DOM
-
2026-04-29$225,000 Active
-
2025-09-12historical
-
2025-06-06status Active
-
2025-05-23historical Active Under Contract
-
2025-05-01$225,000 Active
-
2023-08-31soldstatus $190,000 Sold CO-OP Non Member 206-char remark
Show marketing remark (206 chars)
Don't miss a great opportunity to own this recently remodeled duplex that's already an income producer each side has 2 bed 1 bath and One side has a 1 car garage this property also has an all brick exterior
-
2023-08-16status Pending 206-char remark
Show marketing remark (206 chars)
Don't miss a great opportunity to own this recently remodeled duplex that's already an income producer each side has 2 bed 1 bath and One side has a 1 car garage this property also has an all brick exterior
-
2023-08-07$184,900 Active 206-char remark
Show marketing remark (206 chars)
Don't miss a great opportunity to own this recently remodeled duplex that's already an income producer each side has 2 bed 1 bath and One side has a 1 car garage this property also has an all brick exterior
-
2020-01-10soldstatus $93,000 Sold
-
2019-08-13status Pending
-
2019-08-08price $93,000
-
2019-07-10$105,000 Active
ⓘ Source: listings_history table (triggers on properties + properties_extension) + one-shot
backfill from property_details.listing_events for pre-trigger history.
Climate risk First Street
- Flood 1/10 Low FEMA zone X (unshaded) · 0% chance over 30 yrs
- Wildfire 3/10 Moderate
- Heat 6/10 Major 7 d/yr ≥106°F today · 17 d/yr by 30 yrs out
- Wind 3/10 Moderate 5% chance of damaging wind over 30 yrs
- Air quality 4/10 Moderate 3 unhealthy d/yr today · 5 by 30 yrs out
Nearby sold comps map
Loading sold comps map…
Walkable amenities ~0.75 mi
Loading nearby amenities…
Taxation est. · year 1
- Rental income
- $32,892
- − Mortgage interest
- −$12,491
- − Property taxes
- −$3,345
- − Insurance
- −$1,115
- − Repairs & maintenance
- −$2,631
- − Management
- −$2,631
- − Depreciation
- −$6,487
- Taxable income
- $4,191
- Est. tax owed @ 24.0%
- −$1,006
- After-tax cash flow
- $6,486/yr
For passive investors: Depreciation is non-cash, so a rental often shows a tax loss while cash-flowing — sheltering income. Rental losses are passive: they offset passive income freely, and up to $25,000/yr can offset ordinary (W-2) income if you actively participate and your MAGI is under $100k (phasing out to $0 by $150k); unused losses carry forward. On sale, claimed depreciation is recaptured at up to 25%, and gains may owe capital-gains tax (a 1031 exchange can defer both). Figures are a year-1 estimate at your 24.0% rate — not tax advice; consult a CPA.
Condition & rehab AI · 12 photos
This well-maintained and recently updated duplex is ready for immediate income potential and can be further enhanced with exterior painting and gutter cleaning.
Value-add opportunities
- Both Paint exterior — Enhances curb appeal and property value
- Both Clean gutters — Improves drainage and property value
Renovation cost estimate screening
Value-add ROI direction
- Both Paint exterior — Enhances curb appeal and property value ↑
- Both Clean gutters — Improves drainage and property value ↑
ⓘ Cost ranges are severity-bucket heuristics (US national rule-of-thumb). Get contractor quotes + a written scope before underwriting a rehab budget.
Schools (NCES district)
- District
- Anderson 05
- NCES district ID
- 4500900
- Math proficiency
- 44% ▼ -4.00%
- Reading proficiency
- 49% ▲ 2.00%
- Median HH income
- $39,718
- Composite
- 38.89/100
- National rank
- #4098
- State rank
- #20 of 80 in SC
Livability — Anderson
- Score
- 67/100
- State rank
- #98
- US rank
- #10772
Category grades
Schools grade is shown separately in the Schools card above.
Census & demographics
- Census place
- Anderson, SC
- County
- Anderson County · 99,076 people
- City population
- 87,992
- Metro
- Greenville-Anderson, SC
- Population (ZIP)
- 46,482
- Household income
- $74,256
- Rent vs Own
- Severe rent burden
- 1268.0
Population outlook (Anderson County) Hauer SSP2
- Today (2025)
- 210,546 people
- By 2030
- 217,791 · +3.4%
- By 2040
- 230,643 · +9.5%
- By 2050
- 240,220 · +14.1%
- By 2075
- 259,518 · +23.3%
- By 2100
- 258,696 · +22.9%
Race, ethnicity, and origin ACS 2023
- Neighborhood character
- Predominantly White (74%)
- Race & ethnicity
- White 74% Black 15% Two or more races 6% Hispanic / Latino 4% Asian 2%
- Common ancestry
- Serbian 3% Slovak 3% Romanian 3%
- Foreign-born
- 5% · Canada, China
- Languages at home
- 93% English-only · Spanish 3% Russian/Polish/Slavic 1% Other Indo-European 1%
Political lean MEDSL · Anderson
- 2024 margin
- Solid R (+47.4) · D 25.7% · R 73.1% · Other 1.2%
- 2008→2024 swing
- -14.1pp toward R · 2008: -33.3pp · 2024: -47.4pp
- All cycles
- 2024: R+47.4 2020: R+42.0 2016: R+43.7 2012: R+36.4 2008: R+33.3
Not yet ingested
- Civics
- —
Market trends
- HPI YoY
- ▼ -173.39%
- Current HPI
- 233.3422
- Rent YoY
- ▲ 6.55%
- Metro
- Greenville-Anderson, SC
- State GDP YoY
- ▲ 4.51%
- F500 in state
- 2
Industry mix (Fortune 500 HQ in SC)
| Industry | F500 HQs | Revenue |
|---|---|---|
| Packaging | 1 | $7B |
|
||
Price history
+114.3% since first listed12 events — show timeline
- 2026-04-29 Listed $225,000 WUMLS
- 2025-09-12 Listing Removed — WUMLS
- 2025-06-06 Relisted — WUMLS
- 2025-05-23 Contingent — WUMLS
- 2025-05-01 Listed $225,000 WUMLS
- 2023-08-31 Sold (MLS) $190,000 SPMLS
- 2023-08-16 Pending — SPMLS
- 2023-08-07 Listed $184,900 SPMLS
- 2020-01-10 Sold (MLS) $93,000 WUMLS
- 2019-08-13 Pending — WUMLS
- 2019-08-08 Price Changed $93,000 WUMLS
- 2019-07-10 Listed $105,000 WUMLS
Cash-flow waterfall
monthlySold comps — $/sqft
last 12 mo · ≤1 miLoading sold comps…