701 Alice · El Campo, TX
Flood risk 6/10 · Moderate
- FEMA flood zone
- AE
- Chance of flooding over 30 yrs
- 0.74%
- Est. flood insurance / yr
- $1,737 – $8,500
Fire risk 5/10 · Moderate
- Est. fire insurance / yr
- $1,222 – $2,270
Heat risk 8/10 · Major
- Hot days now (above 110°F)
- 6 days/yr
- Hot days in 30 yrs
- 19 days/yr
Wind risk 9/10 · Severe
- Chance of severe wind over 30 yrs
- 99.0%
Air-quality risk 1/10 · Minimal
- Unhealthy air days now
- 0 days/yr
- Unhealthy air days in 30 yrs
- 0 days/yr
Risk factors via First Street. Map © Google.
Why this score? — see what drove the B grade
The composite is a weighted blend of 9 inputs, each scored 0–100. Each bar is that input's sub-score; the figure is the points it added to the 100-point composite (weight × sub-score).
- Cash flow +30.0/30.0
- 1% rule +10.0/10.0
- DSCR +10.0/10.0
- ARV discount +9.6/15.0
- Livability +3.7/5.0
- Schools +3.5/10.0
- Rent growth +2.5/5.0
- Condition / age +1.0/5.0
- Appreciation +0.0/10.0
$65,000
🖨 Deal sheet 📄 Offer letter ✓ Due diligence
Listing remarks MLS
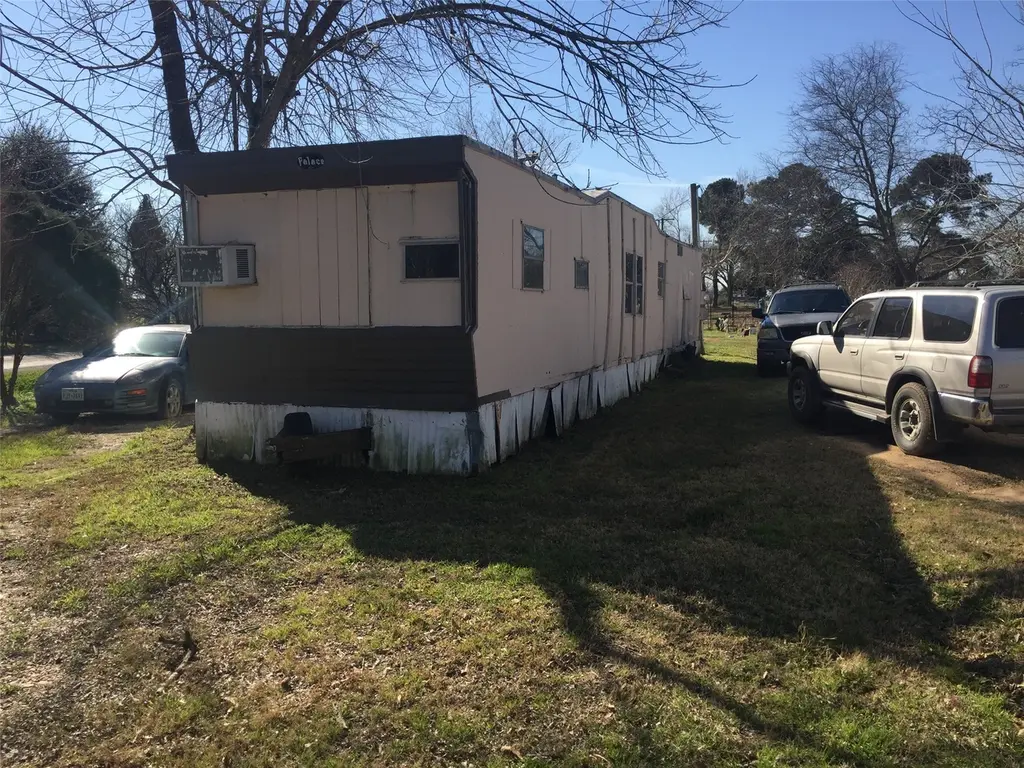
This property is a corner lot with two mobile homes currently on the property.. There is 83' feet frontage on Alice St. and 151' frontage on Wright St..
Key facts
- Frontage on alice st
- Corner lot
- Built 1972
Tags
Neighborhood map
What this means for you Summary
Snapshot
- This is a 3-bed/2.0-bath single-family listed at $65k. Condition is rated poor.
Deal economics
- At list price, monthly cash flow is $195 ($2k/yr) — positive.
- The deal already cash-flows at list — no discount required.
- Meets the 1% rule at list price ($1k rent vs $65k).
- Recommended offer: $57k (12.0% below list) — sets the bar for market timing.
- Cap rate 17.8% vs local median 3.2% in El Campo — top-decile yield for the area; either an underpriced asset or a hidden risk that comps aren't pricing in. Stress-test before assuming the spread holds.
Location & tenants
- Location reads 73/100 on livability (#204 in TX) — a middle-class / working-renter tenant base. Strengths: cost of living A+, housing A+, health & safety A+; Watch: employment D, schools D-, crime D-.
- El Campo ISD (town): math 44% / reading 38% proficiency, ranked #387 of 826 in TX (top 47%) — families likely to look elsewhere, expect single-tenant / working-renter base with shorter leases; 65% free/reduced lunch — lower-income household profile, screen leases tightly.
- Market conditions: 154 active listings in the ZIP; 191 units permitted in Wharton County in 2024 (45 in 5+ unit buildings).
Forward outlook
- Local home prices are declining (-3.0%/yr); year-one equity from $449 of loan paydown is wiped out by about $2k of value loss. Plan a longer hold.
- At projected returns (-3.0% appreciation + 3.0% rent growth), your $18k cash investment doubles in ~9 years — after that, you're playing with house money.
Negotiation context
- It's been on market 229 days — a 12% lower offer ($57k) is reasonable based on typical stale-listing flexibility.
- 2 sale attempts since 4y ago; this cycle's ask has dropped $20k (24%) from the opening price — seller is motivated, your offer sets the floor, not the list.
Risks & watch-outs
- Watch-outs: flood insurance adds $427/mo.
- Climate carrying-cost: in FEMA flood zone AE (mandatory federal flood insurance); severe wind risk, 99% chance of damaging wind over 30y; moderate wildfire risk; extreme-heat days projected 6→19/yr by 2055 (HVAC capex compounding) — expect insurance premiums to compound above CPI over the hold.
Questions for the listing agent
- It's been on market 229 days. Have you received any prior offers? Is the seller open to a 12% concession, seller financing, or rate buy-down credit?
- Have any recent inspections been done? Can we get a copy of the seller's disclosures and any deferred-maintenance estimates?
- Built in 1972 — when were the roof, HVAC, electrical panel, plumbing, and water heater last replaced?
- What's the actual annual flood-insurance premium (NFIP or private), and is the property in a SFHA with mandatory coverage?
- Why hasn't it sold? Are there any deal-killer items the seller is aware of (foundation, flood, title, zoning, code violations)?
- Is there a deadline driving the sale (1031 exchange, divorce, estate, relocation)? That informs how much negotiation room exists.
- Schools are D-rated, which usually means shorter tenancies and higher turnover. Who's the typical renter profile here, and what's been the actual vacancy rate?
- Crime grade is D in this area — have there been break-ins, vandalism, or insurance claims at this property in the last 3 years? What carrier currently insures it and at what premium?
- What's the average days-on-market for RENTAL listings here right now (not sales)? A rising rental-DOM trend means longer vacancies and softer asking-rent achievability than the comps imply.
- What's the recent tenant-quality profile in this submarket — average credit score on applications, eviction rate, late-payment / NSF rate, and stable-employment percentage? A property-management company in the area should have these aggregated.
- How much new for-sale + rental construction is in the pipeline within 1–3 miles? Heavy new supply typically softens prices + rents 12–24 months out; constrained supply supports both.
Investment metrics
- 1% rule
- 2.08% ✓
- Cap rate
- 17.76%
- Cash-on-cash
- 40.97%
- DSCR
- 2.82
- GRM
- 4.0
CMA / ARV
- ARV (median comp)
- $68,235
- List price
- $65,000
- Delta
- -4.74%
- Verdict
- FAIR
- Comps
- 13 within 1.0 mi
Show comp detail 3 sales within ~0.75 mi
| Address | Dist | Beds/Ba | Sqft | Sold | Price | $/sf | Match |
|---|---|---|---|---|---|---|---|
| 104 Jan St | 0.55mi | 2/1.0 (-1) | 728 (-2%) | 13mo | $49,000 | $67 | 51 |
| 401 W 2nd St | 0.61mi | 3/1.0 | 846 (+14%) | 11mo | $110,000 | $130 | 35 |
| 408 Lincoln St | 0.53mi | 2/1.0 (-1) | 672 (-10%) | 24mo | $75,000 | $112 | 30 |
Match score weights: distance 35% · size 25% · config 20% · recency 20%. Top-matched comps best support the ARV.
Projected returns pro-forma
-3.0% appreciation · 3.0% rent growth · sell at horizon
- IRR
- 3.1%
- Equity multiple
- 1.12×
- Total profit
- $2,160
- Equity at exit
- $9,692
- IRR
- 12.9%
- Equity multiple
- 2.04×
- Total profit
- $19,010
- Equity at exit
- $5,620
Cash invested: $18,200 (down + closing). Projections, not guarantees.
Landlord ↔ Tenant lean methodology
- Overall (STATE)
- 87 Strongly Landlord-Friendly
- State Texas
- 87 Strongly Landlord-Friendly · R+5
- County
- — inherits STATE
- City
- — inherits STATE
ZIP-level market 77437
- Home prices YoY
- -33.6%
- Active inventory
- 154
- Price-to-rent
- 4.0×
Monthly cashflow live
- Estimated rent
- $1,355 medium interval (Pro) →
- Mortgage (P&I)
- −$341
- Tax est. 1.5%
- −$81 /mo · $975/yr
- Insurance
- −$27
- Flood insurance flood zone
- −$427 /mo · $5,118/yr
- HOA
- −$0
- Vacancy / Maint / Mgmt
- −$285
- Net cashflow
- $195
Break-even live
UW: 25.0% down · 7.5% · 30yr · 1.5% tax · 5.0% vac · 8.0% maint · 8.0% mgmt
Financing live
Cash to close
- Down payment
- $16,250
- Closing costs
- $1,950
- Reserves months
- —
- Total cash needed
- —
Loan-product check · same deal, 3 products live
Conventional
25% down · 7.5% · 30yr
- Down + closing
- —
- Monthly P&I
- —
- Monthly cashflow
- —
- DSCR
- —
- Eligible?
- —
Personal DTI + credit; lowest rate.
DSCR
20% down · 8.5% · 30yr
- Down + closing
- —
- Monthly P&I
- —
- Monthly cashflow
- —
- DSCR
- —
- Eligible?
- —
No personal income docs; deal must DSCR.
Hard money
10% down · 12.0% · 12mo
- Down + closing
- —
- Monthly P&I
- —
- Monthly cashflow
- —
- DSCR
- —
- Eligible?
- —
Short-term bridge; refi at stabilization.
Listing history 14 events
-
2026-06-08days on market $65,000 Active 229 DOM
-
2026-06-07days on market $65,000 Active 228 DOM
-
2026-06-07days on market $65,000 Active 227 DOM
-
2026-06-03days on market $65,000 Active 224 DOM
-
2026-06-02days on market $65,000 Active 223 DOM
-
2026-06-01days on market $65,000 Active 222 DOM
-
2026-05-31days on market $65,000 Active 221 DOM
-
2026-05-30days on market $65,000 Active 220 DOM
-
2026-04-16price $65,000 152-char remark
Show marketing remark (152 chars)
This property is a corner lot with two mobile homes currently on the property.. There is 83' feet frontage on Alice St. and 151' frontage on Wright St..
-
2025-10-22$85,000 Active 152-char remark
Show marketing remark (152 chars)
This property is a corner lot with two mobile homes currently on the property.. There is 83' feet frontage on Alice St. and 151' frontage on Wright St..
-
2022-05-04soldstatus Sold 152-char remark
Show marketing remark (152 chars)
This property is a corner lot with two mobile homes currently on the property.. There is 83' feet frontage on Alice St. and 151' frontage on Wright St..
-
2022-04-03status Pending 152-char remark
Show marketing remark (152 chars)
This property is a corner lot with two mobile homes currently on the property.. There is 83' feet frontage on Alice St. and 151' frontage on Wright St..
-
2022-03-25status Option Pending 152-char remark
Show marketing remark (152 chars)
This property is a corner lot with two mobile homes currently on the property.. There is 83' feet frontage on Alice St. and 151' frontage on Wright St..
-
2022-03-10$45,000 Active 152-char remark
Show marketing remark (152 chars)
This property is a corner lot with two mobile homes currently on the property.. There is 83' feet frontage on Alice St. and 151' frontage on Wright St..
ⓘ Source: listings_history table (triggers on properties + properties_extension) + one-shot
backfill from property_details.listing_events for pre-trigger history.
Climate risk First Street
- Flood 6/10 Major FEMA zone AE · 74% chance over 30 yrs
- Wildfire 5/10 Major
- Heat 8/10 Severe 6 d/yr ≥110°F today · 19 d/yr by 30 yrs out
- Wind 9/10 Extreme 99% chance of damaging wind over 30 yrs
- Air quality 1/10 Low 0 unhealthy d/yr today · 0 by 30 yrs out
Nearby sold comps map
Loading sold comps map…
Walkable amenities ~0.75 mi
Loading nearby amenities…
Taxation est. · year 1
- Rental income
- $16,262
- − Mortgage interest
- −$3,641
- − Property taxes
- −$975
- − Insurance
- −$5,444
- − Repairs & maintenance
- −$1,301
- − Management
- −$1,301
- − Depreciation
- −$1,891
- Taxable income
- $1,710
- Est. tax owed @ 24.0%
- −$410
- After-tax cash flow
- $1,928/yr
For passive investors: Depreciation is non-cash, so a rental often shows a tax loss while cash-flowing — sheltering income. Rental losses are passive: they offset passive income freely, and up to $25,000/yr can offset ordinary (W-2) income if you actively participate and your MAGI is under $100k (phasing out to $0 by $150k); unused losses carry forward. On sale, claimed depreciation is recaptured at up to 25%, and gains may owe capital-gains tax (a 1031 exchange can defer both). Figures are a year-1 estimate at your 24.0% rate — not tax advice; consult a CPA.
Condition & rehab AI · 2 photos
This mobile home is in poor condition and requires extensive rehabilitation to improve its resale and rental value.
Repairs flagged
- Major foundation/structure — The mobile home is on a trailer, which may indicate structural issues.
- Major exterior/siding — The mobile home is on a trailer, which may indicate siding issues.
- Major roof — The mobile home is on a trailer, which may indicate roof issues.
- Major flooring — The mobile home is on a trailer, which may indicate flooring issues.
- Major interior walls/paint — The mobile home is on a trailer, which may indicate interior wall and paint issues.
- Major HVAC/mechanicals — The mobile home is on a trailer, which may indicate HVAC and mechanical issues.
- Major landscaping/curb appeal — The mobile home is on a trailer, which may indicate landscaping and curb appeal issues.
Value-add opportunities
- Both Rehabilitation of the mobile home and trailer — This would significantly improve the home's condition and appeal, making it more attractive for both resale and rental.
- Both Landscaping and curb appeal improvements — This would enhance the home's curb appeal and make it more attractive for both resale and rental.
- Both HVAC and mechanical system upgrades — This would improve the home's comfort and energy efficiency, making it more attractive for both resale and rental.
- Both Interior wall and paint updates — This would improve the home's interior appearance and make it more attractive for both resale and rental.
- Both Flooring replacement — This would improve the home's interior appearance and make it more attractive for both resale and rental.
- Both Roof and siding repairs — This would improve the home's exterior appearance and make it more attractive for both resale and rental.
Renovation cost estimate screening
| Repair item | Severity | Est. cost |
|---|---|---|
| foundation/structure · The mobile home is on a trailer, which may indicate structural issues. | Major | $15,000–50,000 |
| exterior/siding · The mobile home is on a trailer, which may indicate siding issues. | Major | $15,000–50,000 |
| roof · The mobile home is on a trailer, which may indicate roof issues. | Major | $15,000–50,000 |
| flooring · The mobile home is on a trailer, which may indicate flooring issues. | Major | $15,000–50,000 |
| interior walls/paint · The mobile home is on a trailer, which may indicate interior wall and paint issues. | Major | $15,000–50,000 |
| HVAC/mechanicals · The mobile home is on a trailer, which may indicate HVAC and mechanical issues. | Major | $15,000–50,000 |
| landscaping/curb appeal · The mobile home is on a trailer, which may indicate landscaping and curb appeal issues. | Major | $15,000–50,000 |
| Total estimated repair cost · 7 items | $105,000–350,000 |
Value-add ROI direction
- Both Rehabilitation of the mobile home and trailer — This would significantly improve the home's condition and appeal, making it more attractive for both resale and rental. ↑
- Both Landscaping and curb appeal improvements — This would enhance the home's curb appeal and make it more attractive for both resale and rental. ↑
- Both HVAC and mechanical system upgrades — This would improve the home's comfort and energy efficiency, making it more attractive for both resale and rental. ↑
- Both Interior wall and paint updates — This would improve the home's interior appearance and make it more attractive for both resale and rental. ↑
- Both Flooring replacement — This would improve the home's interior appearance and make it more attractive for both resale and rental. ↑
- Both Roof and siding repairs — This would improve the home's exterior appearance and make it more attractive for both resale and rental. ↑
ⓘ Cost ranges are severity-bucket heuristics (US national rule-of-thumb). Get contractor quotes + a written scope before underwriting a rehab budget.
Schools (NCES district)
- District
- El Campo ISD
- NCES district ID
- 4818280
- Math proficiency
- 44% ▼ -2.00%
- Reading proficiency
- 38% ▲ 1.00%
- Median HH income
- $44,351
- Composite
- 34.82/100
- National rank
- #5102
- State rank
- #387 of 826 in TX
Livability — El Campo
- Score
- 73/100
- State rank
- #204
- US rank
- #5196
Category grades
Schools grade is shown separately in the Schools card above.
Census & demographics
- Census place
- El Campo, TX
- City population
- 18,886
- Population (ZIP)
- 18,886
Population outlook (Wharton County) Hauer SSP2
- Today (2025)
- 42,448 people
- By 2030
- 42,726 · +0.7%
- By 2040
- 43,042 · +1.4%
- By 2050
- 43,368 · +2.2%
- By 2075
- 44,962 · +5.9%
- By 2100
- 44,510 · +4.9%
Race, ethnicity, and origin ACS 2023
- Neighborhood character
- Diverse neighborhood (Simpson 0.56)
- Race & ethnicity
- Hispanic / Latino 50% White 44% Two or more races 18% Black 6%
- Hispanic origin (detail)
- Mexican 45%
- Common ancestry
- Italian 1% Lithuanian 1% Slovak 1%
- Foreign-born
- 10% · Canada
- Languages at home
- 67% English-only · Spanish 32%
Political lean MEDSL · Wharton
- 2024 margin
- Solid R (+51.8) · D 23.8% · R 75.6%
- 2008→2024 swing
- -20.7pp toward R · 2008: -31.2pp · 2024: -51.8pp
- All cycles
- 2024: R+51.8 2020: R+43.1 2016: R+40.2 2012: R+39.1 2008: R+31.2
Not yet ingested
- Civics
- —
Market trends
- HPI YoY
- ▼ -91.78%
- Current HPI
- 181.5905
- Rent YoY
- —
- Metro
- —
- State GDP YoY
- ▲ 3.95%
- F500 in state
- 110
Industry mix (Fortune 500 HQ in TX)
| Industry | F500 HQs | Revenue |
|---|---|---|
| Energy | 16 | $1,198B |
|
||
| Technology | 5 | $198B |
|
||
| Engineering / Construction | 4 | $72B |
|
||
| Energy Services | 3 | $60B |
|
||
| Utilities | 3 | $41B |
|
||
| Healthcare | 2 | $330B |
|
||
Price history
+44.4% since first listed6 events — show timeline
- 2026-04-16 Price Changed $65,000 HARMLS
- 2025-10-22 Listed $85,000 HARMLS
- 2022-05-04 Sold (MLS) — HARMLS
- 2022-04-03 Pending — HARMLS
- 2022-03-25 Pending — HARMLS
- 2022-03-10 Listed $45,000 HARMLS
Cash-flow waterfall
monthlySold comps — $/sqft
last 12 mo · ≤1 miLoading sold comps…