811 S Columbia Ave · Sheffield, AL
Flood risk 1/10 · Minimal
- FEMA flood zone
- X (unshaded)
- Chance of flooding over 30 yrs
- 0.0%
- Est. flood insurance / yr
- $507 – $1,088
Fire risk 1/10 · Minimal
- Est. fire insurance / yr
- $916 – $1,700
Heat risk 6/10 · Moderate
- Hot days now (above 108°F)
- 7 days/yr
- Hot days in 30 yrs
- 20 days/yr
Wind risk 4/10 · Minor
- Chance of severe wind over 30 yrs
- 21.0%
Air-quality risk 1/10 · Minimal
- Unhealthy air days now
- 0 days/yr
- Unhealthy air days in 30 yrs
- 0 days/yr
Risk factors via First Street. Map © Google.
Why this score? — see what drove the B grade
The composite is a weighted blend of 9 inputs, each scored 0–100. Each bar is that input's sub-score; the figure is the points it added to the 100-point composite (weight × sub-score).
- Cash flow +30.0/30.0
- ARV discount +15.0/15.0
- 1% rule +10.0/10.0
- DSCR +10.0/10.0
- Livability +3.0/5.0
- Rent growth +2.5/5.0
- Schools +1.9/10.0
- Condition / age +1.0/5.0
- Appreciation +0.0/10.0
$99,999
🖨 Deal sheet 📄 Offer letter ✓ Due diligence
Listing remarks
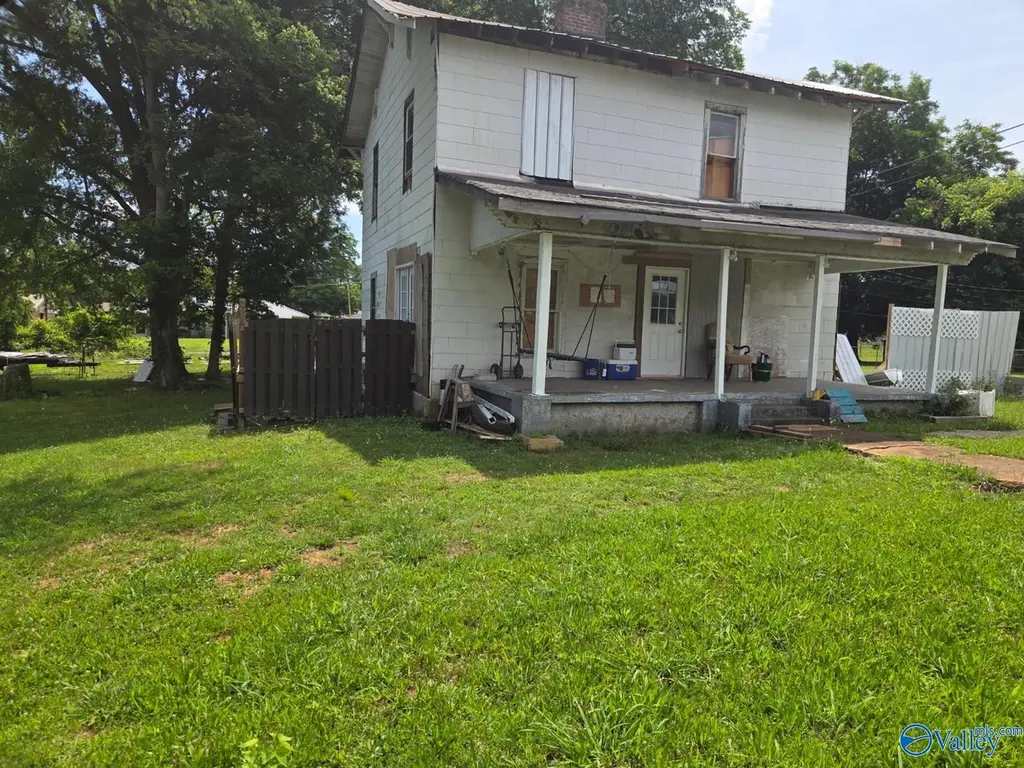
Calling all investors and renovators! This spacious 4-bedroom, 1-bath home offers a fantastic opportunity to add value and build equity. Featuring an unfinished interior ready for your vision, this property is ideal for a fix-and-flip project, rental investment, or affordable home renovation. Situated on a nice-sized yard with plenty of outdoor space, the home also includes natural gas heat for efficient utility service. With strong potential, this property is a great chance to invest in the growing Sheffield market. Property is being sold as-is. Bring your ideas and unlock this home's full potential!
Key facts
- Natural gas heat
- Outdoor space
- 0.23 acre lot
Tags
Property features AI
Finance
- HOA & community: No homeowners association
Exterior
- Parking: Dirt driveway
- Utilities: Public water; Public sewer; Natural gas available
- Home design: Single-family residence; Residential property; Built in 1950; Two-story
- Construction: Aluminum siding; No fireplaces
- Exterior features: 0.23-acre lot; Public water; Public sewer; Lot in City Of Sheffield subdivision
Interior
- Bathrooms: 1 full bathroom
- Heating & cooling: Natural gas heating; No central cooling
- Interior features: Crawl space basement; Two levels
Neighborhood map
What this means for you Summary
Snapshot
- This is a 4-bed/1.0-bath single-family listed at $100k. Condition is rated poor.
Deal economics
- At list price, monthly cash flow is $731 ($9k/yr) — positive.
- The deal already cash-flows at list — no discount required.
- Meets the 1% rule at list price ($2k rent vs $100k).
- Cap rate 15.1% vs local median 5.1% in Sheffield — top-decile yield for the area; either an underpriced asset or a hidden risk that comps aren't pricing in. Stress-test before assuming the spread holds.
Location & tenants
- Location reads 60/100 on livability (#312 in AL) — a middle-class / working-renter tenant base. Strengths: cost of living A+, housing A+; Watch: crime F, amenities F, commute F.
- Sheffield City (suburban): math 12% / reading 34% proficiency, ranked #103 of 129 in AL (top 80%) — low school quality limits family demand, transient renter base, plan for 1-2y turnover; 74% free/reduced lunch — lower-income household profile, screen leases tightly.
- Zoned schools: Sheffield Junior High School (math 2% / reading 32%, grade F, #200 of 257 statewide, top 78%, 186 students, 84% FRL); Sheffield High School (math 15% / reading 15%, grade F, #212 of 305 statewide, top 70%, 278 students, 66% FRL) — zoned schools at 75% FRL track the district average.
- Market conditions: 115 active listings in the ZIP; 1 comparable units currently listed for rent nearby; 91 units permitted in Colbert County in 2024 (0 in 5+ unit buildings).
Forward outlook
- Local home prices are declining (-3.0%/yr); year-one equity from $691 of loan paydown is wiped out by about $3k of value loss. Plan a longer hold.
- Colbert County population projected to shrink 7% by 2050 — rents likely to lag national; underwrite the cash flow, not the appreciation.
- At projected returns (-3.0% appreciation + 3.0% rent growth), your $28k cash investment doubles in ~4 years — after that, you're playing with house money.
Negotiation context
- Only 13 days on market — expect competitive offers; lowballing is unlikely to land.
- 2 sale attempts since 13y ago with the ask held roughly flat each time — persistent listings suggest the price (not the market) is what's stuck; bring a comps-based counter.
Risks & watch-outs
- Watch-outs: built in 1950 — expect roof / HVAC / electrical / plumbing capex.
- Climate carrying-cost: extreme-heat days projected 7→20/yr by 2055 (HVAC capex compounding) — expect insurance premiums to compound above CPI over the hold.
Questions for the listing agent
- Have any recent inspections been done? Can we get a copy of the seller's disclosures and any deferred-maintenance estimates?
- Built in 1950 — when were the roof, HVAC, electrical panel, plumbing, and water heater last replaced?
- Is there a deadline driving the sale (1031 exchange, divorce, estate, relocation)? That informs how much negotiation room exists.
- Schools are F-rated, which usually means shorter tenancies and higher turnover. Who's the typical renter profile here, and what's been the actual vacancy rate?
- Crime grade is F in this area — have there been break-ins, vandalism, or insurance claims at this property in the last 3 years? What carrier currently insures it and at what premium?
- What's the average days-on-market for RENTAL listings here right now (not sales)? A rising rental-DOM trend means longer vacancies and softer asking-rent achievability than the comps imply.
- What's the recent tenant-quality profile in this submarket — average credit score on applications, eviction rate, late-payment / NSF rate, and stable-employment percentage? A property-management company in the area should have these aggregated.
- How much new for-sale + rental construction is in the pipeline within 1–3 miles? Heavy new supply typically softens prices + rents 12–24 months out; constrained supply supports both.
Investment metrics
- 1% rule
- 1.80% ✓
- Cap rate
- 15.06%
- Cash-on-cash
- 31.33%
- DSCR
- 2.39
- GRM
- 4.6
CMA / ARV
- ARV (on-the-fly)
- $165,648
- Comps found
- 11
Show comp detail 11 sales within ~0.75 mi
| Address | Dist | Beds/Ba | Sqft | Sold | Price | $/sf | Match |
|---|---|---|---|---|---|---|---|
| 1003 Sterling Blvd | 0.31mi | 4/2.0 | 1,518 (-6%) | 21mo | $155,000 | $102 | 53 |
| 1001 Sterling Blvd | 0.31mi | 3/2.0 (-1) | 1,736 (+7%) | 19mo | $47,000 | $27 | 49 |
| 215 Sterling Blvd | 0.71mi | 3/2.0 (-1) | 1,680 (+3%) | 10mo | $139,900 | $83 | 43 |
| 105 Monroe St | 0.59mi | 3/2.0 (-1) | 1,827 (+12%) | 1mo | $185,000 | $101 | 42 |
| 704 Washington St | 0.60mi | 3/1.0 (-1) | 1,388 (-14%) | 8mo | $179,900 | $130 | 36 |
| 608 N Washington St | 0.65mi | 3/2.0 (-1) | 1,425 (-12%) | 7mo | $205,000 | $144 | 35 |
| 132 Monroe Dr | 0.65mi | 3/1.5 (-1) | 1,446 (-11%) | 13mo | $170,000 | $118 | 34 |
| 719 N Main St | 0.73mi | 3/2.0 (-1) | 1,785 (+10%) | 12mo | $163,000 | $91 | 30 |
| 907 14th Ave | 0.63mi | 3/2.0 (-1) | 1,400 (-14%) | 11mo | $105,000 | $75 | 29 |
| 801 Main St N | 0.67mi | 3/2.0 (-1) | 1,500 (-8%) | 22mo | $209,000 | $139 | 28 |
| 305 E 18th St | 0.64mi | 3/2.0 (-1) | 1,444 (-11%) | 18mo | $185,000 | $128 | 28 |
Match score weights: distance 35% · size 25% · config 20% · recency 20%. Top-matched comps best support the ARV.
Projected returns pro-forma
-3.0% appreciation · 3.0% rent growth · sell at horizon
- IRR
- 26.2%
- Equity multiple
- 2.08×
- Total profit
- $30,376
- Equity at exit
- $14,910
- IRR
- 33.8%
- Equity multiple
- 4.09×
- Total profit
- $86,506
- Equity at exit
- $8,646
Cash invested: $28,000 (down + closing). Projections, not guarantees.
Landlord ↔ Tenant lean methodology
- Overall (STATE)
- 90 Strongly Landlord-Friendly
- State Alabama
- 90 Strongly Landlord-Friendly · R+15
- County
- — inherits STATE
- City
- — inherits STATE
ZIP-level market 35660
- Home prices YoY
- -29.5%
- Active inventory
- 115
- Price-to-rent
- 4.6×
Monthly cashflow live
- Estimated rent
- $1,800 medium interval (Pro) →
- Mortgage (P&I)
- −$524
- Tax est. 1.5%
- −$125 /mo · $1,500/yr
- Insurance
- −$42
- HOA
- −$0
- Vacancy / Maint / Mgmt
- −$378
- Net cashflow
- $731
Break-even live
UW: 25.0% down · 7.5% · 30yr · 1.5% tax · 5.0% vac · 8.0% maint · 8.0% mgmt
Financing live
Cash to close
- Down payment
- $25,000
- Closing costs
- $3,000
- Reserves months
- —
- Total cash needed
- —
Loan-product check · same deal, 3 products live
Conventional
25% down · 7.5% · 30yr
- Down + closing
- —
- Monthly P&I
- —
- Monthly cashflow
- —
- DSCR
- —
- Eligible?
- —
Personal DTI + credit; lowest rate.
DSCR
20% down · 8.5% · 30yr
- Down + closing
- —
- Monthly P&I
- —
- Monthly cashflow
- —
- DSCR
- —
- Eligible?
- —
No personal income docs; deal must DSCR.
Hard money
10% down · 12.0% · 12mo
- Down + closing
- —
- Monthly P&I
- —
- Monthly cashflow
- —
- DSCR
- —
- Eligible?
- —
Short-term bridge; refi at stabilization.
Rent comps 1 comps
| Address | Beds | Baths | Sqft | Rent | $/sqft | DOM | Units | Dist |
|---|---|---|---|---|---|---|---|---|
| 701 E 18th St Sheffield, AL | 4.0 | 2.5 | 2000 | $1,800 | $0.90 | 43d | 1 | 0.32mi |
Listing history 12 events
-
2026-06-19days on market $99,999 Active 13 DOM
-
2026-06-18days on market $99,999 Active 12 DOM
-
2026-06-17days on market $99,999 Active 11 DOM
-
2026-06-16days on market $99,999 Active 10 DOM
-
2026-06-15days on market $99,999 Active 9 DOM
-
2026-06-14days on market $99,999 Active 7 DOM
-
2026-06-13days on market $99,999 Active 6 DOM
-
2026-06-10days on market $99,999 Active 4 DOM
-
2026-06-09days on market $99,999 Active 3 DOM
-
2026-06-08days on market $99,999 Active 2 DOM
-
2026-06-07remarks 608-char remark
-
2026-06-07$99,999 Active 1 DOM
ⓘ Source: listings_history table (triggers on properties + properties_extension) + one-shot
backfill from property_details.listing_events for pre-trigger history.
Climate risk First Street
- Flood 1/10 Low FEMA zone X (unshaded) · 0% chance over 30 yrs
- Wildfire 1/10 Low
- Heat 6/10 Major 7 d/yr ≥108°F today · 20 d/yr by 30 yrs out
- Wind 4/10 Moderate 21% chance of damaging wind over 30 yrs
- Air quality 1/10 Low 0 unhealthy d/yr today · 0 by 30 yrs out
Nearby sold comps map
Loading sold comps map…
Walkable amenities ~0.75 mi
Loading nearby amenities…
Taxation est. · year 1
- Rental income
- $21,600
- − Mortgage interest
- −$5,601
- − Property taxes
- −$1,500
- − Insurance
- −$500
- − Repairs & maintenance
- −$1,728
- − Management
- −$1,728
- − Depreciation
- −$2,909
- Taxable income
- $7,633
- Est. tax owed @ 24.0%
- −$1,832
- After-tax cash flow
- $6,939/yr
For passive investors: Depreciation is non-cash, so a rental often shows a tax loss while cash-flowing — sheltering income. Rental losses are passive: they offset passive income freely, and up to $25,000/yr can offset ordinary (W-2) income if you actively participate and your MAGI is under $100k (phasing out to $0 by $150k); unused losses carry forward. On sale, claimed depreciation is recaptured at up to 25%, and gains may owe capital-gains tax (a 1031 exchange can defer both). Figures are a year-1 estimate at your 24.0% rate — not tax advice; consult a CPA.
Condition & rehab AI · 11 photos
This property requires extensive repairs and renovations to bring it back to a livable condition. Significant structural damage and debris throughout the property make it a challenging but potentially rewarding fix-and-flip project.
Repairs flagged
- Major staircase — Significant damage to the staircase
- Major exterior siding — Significant damage to the exterior siding
- Major interior walls — Significant damage to the interior walls
- Major flooring — Significant damage to the flooring
Value-add opportunities
- Both exterior siding repair — Improves curb appeal and structural integrity
- Both interior wall repair — Enhances interior aesthetics and structural stability
- Both flooring replacement — Improves living space and structural integrity
- Both staircase repair — Ensures safety and structural integrity
Renovation cost estimate screening
| Repair item | Severity | Est. cost |
|---|---|---|
| staircase · Significant damage to the staircase | Major | $15,000–50,000 |
| exterior siding · Significant damage to the exterior siding | Major | $15,000–50,000 |
| interior walls · Significant damage to the interior walls | Major | $15,000–50,000 |
| flooring · Significant damage to the flooring | Major | $15,000–50,000 |
| Total estimated repair cost · 4 items | $60,000–200,000 |
Value-add ROI direction
- Both exterior siding repair — Improves curb appeal and structural integrity ↑
- Both interior wall repair — Enhances interior aesthetics and structural stability ↑
- Both flooring replacement — Improves living space and structural integrity ↑
- Both staircase repair — Ensures safety and structural integrity ↑
ⓘ Cost ranges are severity-bucket heuristics (US national rule-of-thumb). Get contractor quotes + a written scope before underwriting a rehab budget.
Schools (NCES district)
- District
- Sheffield City
- NCES district ID
- 0103000
- Math proficiency
- 12% ▼ -30.00%
- Reading proficiency
- 34% ▼ -1.00%
- Median HH income
- $34,188
- Composite
- 18.8/100
- National rank
- #8866
- State rank
- #103 of 129 in AL
Livability — Sheffield
- Score
- 60/100
- State rank
- #312
- US rank
- #19366
Category grades
Schools grade is shown separately in the Schools card above.
Census & demographics
- Census place
- Sheffield, AL
- City population
- 9,385
- Population (ZIP)
- 9,385
Population outlook (Colbert County) Hauer SSP2
- Today (2025)
- 54,154 people
- By 2030
- 53,746 · -0.8%
- By 2040
- 52,431 · -3.2%
- By 2050
- 50,303 · -7.1%
- By 2075
- 44,789 · -17.3%
- By 2100
- 36,676 · -32.3%
Race, ethnicity, and origin ACS 2023
- Neighborhood character
- Predominantly White (68%)
- Race & ethnicity
- White 68% Black 26% Two or more races 4% Hispanic / Latino 2%
- Common ancestry
- Slovak 1% Lithuanian 1% Serbian 1%
- Foreign-born
- 1% · Canada
- Languages at home
- 98% English-only · Spanish 2%
Political lean MEDSL · Colbert
- 2024 margin
- Solid R (+46.4) · D 26.4% · R 72.8%
- 2008→2024 swing
- -26.2pp toward R · 2008: -20.3pp · 2024: -46.4pp
- All cycles
- 2024: R+46.4 2020: R+38.9 2016: R+38.3 2012: R+20.4 2008: R+20.3
Not yet ingested
- Civics
- —
Market trends
- HPI YoY
- ▼ -74.23%
- Current HPI
- 177.3226
- Rent YoY
- —
- Metro
- —
- State GDP YoY
- ▲ 2.94%
- F500 in state
- 4
Industry mix (Fortune 500 HQ in AL)
| Industry | F500 HQs | Revenue |
|---|---|---|
| Financial Services | 1 | $8B |
|
||
| Healthcare | 1 | $5B |
|
||
Price history
+402.5% since first listed2 events — show timeline
- 2026-06-06 Listed $99,999 VMLS
- 2013-01-31 Listed $19,900 SAARMLS
Cash-flow waterfall
monthlySold comps — $/sqft
last 12 mo · ≤1 miLoading sold comps…