 Duplex
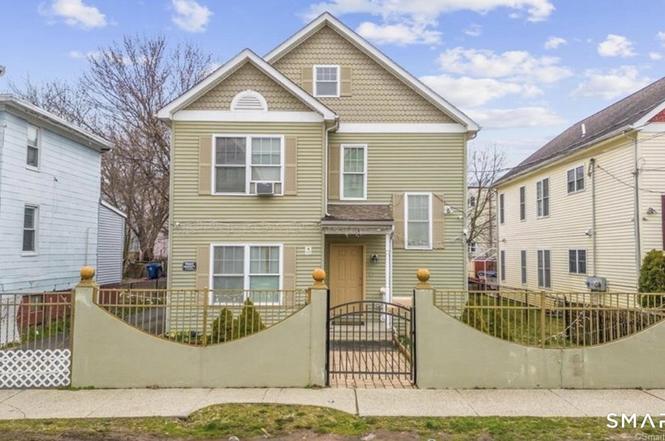
13 Button St · New Haven, CT
Flood risk 8/10 · Major
- FEMA flood zone
- X (unshaded)
- Chance of flooding over 30 yrs
- 0.97%
- Est. flood insurance / yr
- $473 – $860
Fire risk 1/10 · Minimal
- Est. fire insurance / yr
- $829 – $1,539
Heat risk 7/10 · Major
- Hot days now (above 99°F)
- 7 days/yr
- Hot days in 30 yrs
- 16 days/yr
Wind risk 6/10 · Moderate
- Chance of severe wind over 30 yrs
- 55.0%
Air-quality risk 5/10 · Moderate
- Unhealthy air days now
- 6 days/yr
- Unhealthy air days in 30 yrs
- 8 days/yr
Risk factors via First Street. Map © Google.
Why this score? — see what drove the C grade
The composite is a weighted blend of 9 inputs, each scored 0–100. Each bar is that input's sub-score; the figure is the points it added to the 100-point composite (weight × sub-score).
- Cash flow +18.8/30.0
- Appreciation +9.9/10.0
- DSCR +5.9/10.0
- 1% rule +5.0/10.0
- ARV discount +5.0/15.0
- Livability +4.0/5.0
- Rent growth +3.3/5.0
- Condition / age +2.5/5.0
- Schools +1.5/10.0
$460,000
🖨 Deal sheet 📄 Offer letter ✓ Due diligence
Multi-family units
County records classify this as Multi-Family (2-4 Unit). Listing-text estimate: 2 units. confirmed
Listing remarks MLS
Welcome to this rare gem! Built in 2005, this 2-family house offers two identical units, each featuring 3 bedrooms and 2 bathrooms. With both units already occupied by tenants on contracts, this is an excellent opportunity for passive income. Both units come equipped with gas furnaces, providing efficient and cost-effective heating throughout the winter months. Plus, with a fenced-in property, you can rest assured that your privacy and security are well-protected
Key facts
- 2 family house
- Fenced in property
- Gas furnaces
Tags
Property features AI
Exterior
- Parking: Off-street parking; 2 parking spaces
- Utilities: Public water connected; Public sewer connected
- Home design: Multi-family property (2-family)
- Construction: Frame construction; Vinyl siding; Concrete foundation; Asphalt shingle roof; Tan exterior color; Built as multi-family (3 units total)
- Exterior features: Level lot; Beach rights
Interior
- Bedrooms: 7 bedrooms
- Bathrooms: 5 full bathrooms
- Heating & cooling: Hot air heating; Natural gas heat; Electric 30-gallon hot water tank
- Interior features: 17 total rooms; Full, partially finished basement; Has attic with access via hatch
Neighborhood map
What this means for you Summary
Snapshot
- This is a 2 × 3-bed/2.0-bath units multifamily listed at $460k.
Deal economics
- At list price, monthly cash flow is $404 ($5k/yr) — positive. Per door: $202/mo.
- The deal already cash-flows at list — no discount required.
- Meets the 1% rule at list price ($5k rent vs $460k).
- Cap rate 7.5% vs local median 4.8% in New Haven — top-decile yield for the area; either an underpriced asset or a hidden risk that comps aren't pricing in. Stress-test before assuming the spread holds.
Location & tenants
- Location reads 79/100 on livability (#31 in CT, #2,190 nationally) — a middle-class / working-renter tenant base. Strengths: amenities A+, commute A+, health & safety A+; Watch: schools D+, employment D, crime F.
- New Haven School District (urban): math 12% / reading 25% proficiency, ranked #147 of 153 in CT (top 96%) — low school quality limits family demand, transient renter base, plan for 1-2y turnover; 66% free/reduced lunch — lower-income household profile, screen leases tightly.
- Market conditions: Rents rising (+3.3%/yr); 46 active listings in the ZIP; 7 comparable units currently listed for rent nearby; rentals at typical pace (median 24d on market — plan ~3-4 weeks tenant-placement turnaround); 43% of comp listings sitting > 30 days — soft ceiling on asking rent; 1,059 units permitted in South Central Connecticut Planning Region in 2024 (779 in 5+ unit buildings).
- At $4,607/mo this rent would consume 111% of the median local household income ($50k/yr) (locally 1321% of renters already pay >50% of income on rent) — very limited rent-growth headroom before tenants either downsize or default.
Forward outlook
- In year one you build about $48k of equity ($3k loan paydown + $45k appreciation (9.8% local appreciation)).
- At projected returns (9.8% appreciation + 3.3% rent growth), your $129k cash investment doubles in ~3 years — after that, you're playing with house money.
- By year 2, paydown + projected appreciation supports a ~$78k cash-out refi (75% LTV) — recoverable capital for the next deal without selling this one.
Negotiation context
- Only 3 days on market — expect competitive offers; lowballing is unlikely to land.
- 4 sale attempts since 21y ago with the ask held roughly flat each time — persistent listings suggest the price (not the market) is what's stuck; bring a comps-based counter.
- Current owner paid $391k; 18% above their basis — modest negotiation headroom, anchor on the comps not their cost.
Risks & watch-outs
- Watch-outs: flood insurance adds $56/mo.
- Climate carrying-cost: severe flood risk; major wind risk, 55% chance of damaging wind over 30y; extreme-heat days projected 7→16/yr by 2055 (HVAC capex compounding) — expect insurance premiums to compound above CPI over the hold.
Questions for the listing agent
- Can we see the unit-by-unit rent roll, current vacancy, and any below-market leases? What's the average tenancy length?
- What capital expenditures (roof, boiler, parking lot, exteriors) have been made in the last 5 years, and what's planned in the next 2?
- What's the actual annual flood-insurance premium (NFIP or private), and is the property in a SFHA with mandatory coverage?
- Is there a deadline driving the sale (1031 exchange, divorce, estate, relocation)? That informs how much negotiation room exists.
- Schools are D-rated, which usually means shorter tenancies and higher turnover. Who's the typical renter profile here, and what's been the actual vacancy rate?
- Crime grade is F in this area — have there been break-ins, vandalism, or insurance claims at this property in the last 3 years? What carrier currently insures it and at what premium?
- What's the average days-on-market for RENTAL listings here right now (not sales)? A rising rental-DOM trend means longer vacancies and softer asking-rent achievability than the comps imply.
- What's the recent tenant-quality profile in this submarket — average credit score on applications, eviction rate, late-payment / NSF rate, and stable-employment percentage? A property-management company in the area should have these aggregated.
- How much new apartment / multifamily construction is in the pipeline within 1–3 miles? Heavy new supply (>2% of stock underway) typically softens rents 12–24 months out; light construction supports rent growth.
Investment metrics
- 1% rule
- 1.00% ✓
- Cap rate
- 7.49%
- Cash-on-cash
- 4.28%
- DSCR
- 1.19
- GRM
- 8.3
CMA / ARV
- ARV (on-the-fly)
- $436,128
- Comps found
- 12
Show comp detail 12 sales within ~0.75 mi
| Address | Dist | Beds/Ba | Sqft | Sold | Price | $/sf | Match |
|---|---|---|---|---|---|---|---|
| 20-22 Hurlburt St | 0.07mi | 6/3.0 | 2,429 (-6%) | 0mo | $362,500 | $149 | 82 |
| 109 Hurlburt St | 0.20mi | 6/3.0 | 2,677 (+3%) | 9mo | $290,000 | $108 | 74 |
| 121 Plymouth St | 0.17mi | 5/2.0 (-1) | 2,539 (-2%) | 10mo | $355,000 | $140 | 67 |
| 272 Greenwich Ave | 0.38mi | 6/3.0 | 2,684 (+3%) | 13mo | $450,000 | $168 | 61 |
| 11 White St | 0.48mi | 6/3.0 | 2,502 (-4%) | 10mo | $445,000 | $178 | 59 |
| 95 Frank St | 0.36mi | 6/3.0 | 2,243 (-14%) | 2mo | $385,000 | $172 | 55 |
| 173 Rosette St | 0.13mi | 5/2.0 (-1) | 2,312 (-11%) | 13mo | $212,625 | $92 | 52 |
| 222 Howard Ave | 0.38mi | 5/3.0 (-1) | 2,311 (-11%) | 11mo | $470,000 | $203 | 46 |
| 63 Sea St | 0.68mi | 5/3.0 (-1) | 2,842 (+10%) | 0mo | $675,000 | $238 | 43 |
| 28 Frank St | 0.39mi | 7/2.0 (+1) | 2,282 (-12%) | 8mo | $330,000 | $145 | 42 |
| 312 Davenport Ave | 0.71mi | 6/2.0 | 2,348 (-10%) | 6mo | $312,000 | $133 | 38 |
| 44 Lambert St | 0.73mi | 6/3.0 | 2,256 (-13%) | 11mo | $460,000 | $204 | 31 |
Match score weights: distance 35% · size 25% · config 20% · recency 20%. Top-matched comps best support the ARV.
Projected returns pro-forma
9.81% appreciation · 3.3% rent growth · sell at horizon
- IRR
- 26.7%
- Equity multiple
- 3.11×
- Total profit
- $271,756
- Equity at exit
- $408,028
- IRR
- 23.5%
- Equity multiple
- 7.07×
- Total profit
- $781,550
- Equity at exit
- $873,230
Cash invested: $128,800 (down + closing). Projections, not guarantees.
Landlord ↔ Tenant lean methodology
- Overall (STATE)
- 27 Tenant-Leaning
- State Connecticut
- 27 Tenant-Leaning · D+7
- County
- — inherits STATE
- City
- — inherits STATE
ZIP-level market 06519
- Home prices YoY
- 2.7%
- Rents YoY
- 3.3%
- Active inventory
- 46
- Price-to-rent
- 16.6×
Monthly cashflow live
- Estimated rent
- $4,607 high interval (Pro) →
- Mortgage (P&I)
- −$2,412
- Tax from tax record
- −$576 /mo · $6,914/yr
- Insurance
- −$192
- Flood insurance flood zone
- −$56 /mo · $666/yr
- HOA
- −$0
- Vacancy / Maint / Mgmt
- −$967
- Net cashflow
- $404
Break-even live
2-unit breakdown (identical units grouped — click to expand)
| Units | Beds | Baths | Est. rent |
|---|---|---|---|
| 2× units | 3 | 2 | $4,608 |
| #1 | 3 | 2 | $2,304 |
| #2 | 3 | 2 | $2,304 |
| Total (2 units) | $4,607 | ||
UW: 25.0% down · 7.5% · 30yr · 1.5% tax · 5.0% vac · 8.0% maint · 8.0% mgmt
Financing live
Cash to close
- Down payment
- $115,000
- Closing costs
- $13,800
- Reserves months
- —
- Total cash needed
- —
Loan-product check · same deal, 3 products live
Conventional
25% down · 7.5% · 30yr
- Down + closing
- —
- Monthly P&I
- —
- Monthly cashflow
- —
- DSCR
- —
- Eligible?
- —
Personal DTI + credit; lowest rate.
DSCR
20% down · 8.5% · 30yr
- Down + closing
- —
- Monthly P&I
- —
- Monthly cashflow
- —
- DSCR
- —
- Eligible?
- —
No personal income docs; deal must DSCR.
Hard money
10% down · 12.0% · 12mo
- Down + closing
- —
- Monthly P&I
- —
- Monthly cashflow
- —
- DSCR
- —
- Eligible?
- —
Short-term bridge; refi at stabilization.
Rent comps 7 comps
| Address | Beds | Baths | Sqft | Rent | $/sqft | DOM | Units | Dist |
|---|---|---|---|---|---|---|---|---|
| 34 Cassius St Unit 36 New Haven, CT | 5.0 | 2.0 | 1872 | $2,300 | $1.23 | 43d | 1 | 0.22mi |
| 37 Center St Unit 2 West Haven, CT | 5.0 | 2.0 | 2500 | $3,300 | $1.32 | 2d | 1 | 1.02mi |
| 395 Crown St New Haven, CT | 6.0 | 3.5 | 2889 | $7,195 | $2.49 | 43d | 1 | 1.14mi |
| 131 Dwight St Unit 1 New Haven, CT | 6.0 | 3.0 | 3097 | $6,250 | $2.02 | 23d | 1 | 1.19mi |
| 131 Dwight St Unit 1 New Haven, CT | 6.0 | 3.0 | 3000 | $6,250 | $2.08 | 14d | 1 | 1.19mi |
| 67 Edgewood Ave New Haven, CT | 7.0 | 2.5 | 2000 | $6,100 | $3.05 | 43d | 1 | 1.32mi |
| 229 Dwight St New Haven, CT | 6.0 | 2.0 | 2400 | $4,995 | $2.08 | 2d | 1 | 1.36mi |
Listing history 4 events
-
2026-06-18days on market $460,000 Active 3 DOM
-
2026-06-17days on market $460,000 Active 2 DOM
-
2026-06-15remarks 536-char remark
-
2026-06-15$460,000 Active 1 DOM
ⓘ Source: listings_history table (triggers on properties + properties_extension) + one-shot
backfill from property_details.listing_events for pre-trigger history.
Tax reassessment forecast CT · Partial reset (capped growth)
- Current annual tax
- $6,914 · $576/mo
- Projected year-2 tax
- $8,379 · $698/mo
- Expected delta
- +$1,465/yr (+$122/mo · 21.2%)
ⓘ Screening estimate from a state-policy table — verify with the county assessor before closing.
Climate risk First Street
- Flood 8/10 Severe FEMA zone X (unshaded) · 97% chance over 30 yrs
- Wildfire 1/10 Low
- Heat 7/10 Severe 7 d/yr ≥99°F today · 16 d/yr by 30 yrs out
- Wind 6/10 Major 55% chance of damaging wind over 30 yrs
- Air quality 5/10 Major 6 unhealthy d/yr today · 8 by 30 yrs out
Nearby sold comps map
Loading sold comps map…
Walkable amenities ~0.75 mi
Loading nearby amenities…
Taxation est. · year 1
- Rental income
- $55,284
- − Mortgage interest
- −$25,767
- − Property taxes
- −$6,914
- − Insurance
- −$2,966
- − Repairs & maintenance
- −$4,423
- − Management
- −$4,423
- − Depreciation
- −$13,382
- Taxable loss
- −$2,591
- Est. tax savings @ 24.0%
- +$622
- After-tax cash flow
- $5,468/yr
For passive investors: Depreciation is non-cash, so a rental often shows a tax loss while cash-flowing — sheltering income. Rental losses are passive: they offset passive income freely, and up to $25,000/yr can offset ordinary (W-2) income if you actively participate and your MAGI is under $100k (phasing out to $0 by $150k); unused losses carry forward. On sale, claimed depreciation is recaptured at up to 25%, and gains may owe capital-gains tax (a 1031 exchange can defer both). Figures are a year-1 estimate at your 24.0% rate — not tax advice; consult a CPA.
Schools (NCES district)
- District
- New Haven School District
- NCES district ID
- 0902790
- Math proficiency
- 12% ▼ -10.00%
- Reading proficiency
- 25% ▼ -10.00%
- Median HH income
- $38,058
- Composite
- 15.48/100
- National rank
- #9308
- State rank
- #147 of 153 in CT
Livability — New Haven
- Score
- 79/100
- State rank
- #31
- US rank
- #2190
Category grades
Schools grade is shown separately in the Schools card above.
Census & demographics
- Census place
- New Haven, CT
- County
- New Haven County · 688,236 people
- City population
- 132,813
- Metro
- New Haven-Milford, CT
- Population (ZIP)
- 15,605
- Household income
- $49,619
- Rent vs Own
- Severe rent burden
- 1321.0
Population outlook (South Central Connecticut County) Hauer SSP2
- By 2040
- 608,362
Race, ethnicity, and origin ACS 2023
- Neighborhood character
- Diverse neighborhood (Simpson 0.67)
- Race & ethnicity
- Hispanic / Latino 49% Black 26% White 15% Two or more races 13% Asian 4% Native American 1%
- Hispanic origin (detail)
- Mexican 15% Puerto Rican 25% Dominican 3%
- Common ancestry
- Romanian 1% Lithuanian 1%
- Foreign-born
- 25% · Canada, Jamaica, China
- Languages at home
- 50% English-only · Spanish 42% Other Indo-European 4% Arabic 1%
Political lean MEDSL · South Central Connecticut
- 2024 margin
- Strong D (+20.1) · D 59.0% · R 38.9% · Other 2.1%
- All cycles
- 2024: D+20.1
Not yet ingested
- Civics
- —
Market trends
- HPI YoY
- ▲ 9.81%
- Current HPI
- 377.4885
- Rent YoY
- ▲ 3.30%
- Metro
- New Haven-Milford, CT
- State GDP YoY
- ▲ 1.06%
- F500 in state
- 38
Industry mix (Fortune 500 HQ in CT)
| Industry | F500 HQs | Revenue |
|---|---|---|
| Industrial Machinery | 4 | $38B |
|
||
| Insurance | 3 | $71B |
|
||
| Financial Services | 2 | $25B |
|
||
| Transportation / Logistics | 2 | $18B |
|
||
| Healthcare | 1 | $247B |
|
||
| Telecommunications | 1 | $55B |
|
||
Price history
+187.5% since first listed11 events — show timeline
- 2026-06-15 Listed $460,000 Smart MLS
- 2023-05-10 Sold (Public Records) $391,000 Public Records
- 2023-05-09 Sold (MLS) $391,000 Smart MLS
- 2023-04-04 Pending — Smart MLS
- 2023-04-02 Listed $359,000 Smart MLS
- 2023-03-28 Coming Soon $359,000 Smart MLS
- 2016-04-13 Sold (MLS) $160,000 Smart MLS
- 2015-12-17 Listing Removed — Smart MLS
- 2015-11-12 Listed $153,000 Smart MLS
- 2006-06-13 Sold (MLS) $160,000 Smart MLS
- 2005-12-07 Listed $160,000 Smart MLS
Property tax history
+5.7%/yrLatest (2023): $6,914 · -6.4% YoY. Source: county tax records.
Cash-flow waterfall
monthlySold comps — $/sqft
last 12 mo · ≤1 miLoading sold comps…