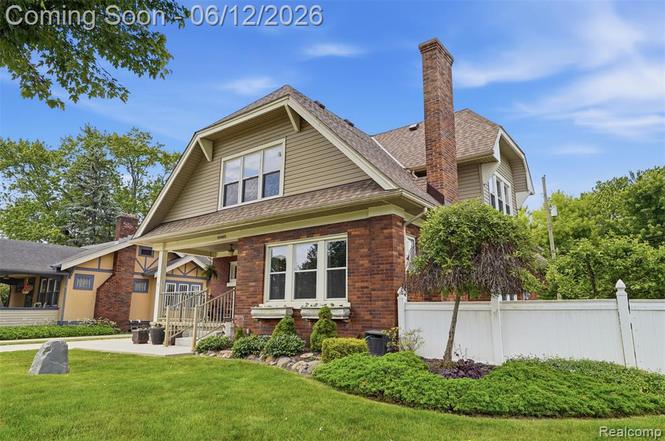
30069 Homedale · South Lyon, MI
Flood risk 1/10 · Minimal
- FEMA flood zone
- X (unshaded)
- Chance of flooding over 30 yrs
- 0.0%
- Est. flood insurance / yr
- $507 – $1,088
Fire risk 3/10 · Minor
- Est. fire insurance / yr
- $784 – $1,456
Heat risk 2/10 · Minimal
- Hot days now (above 95°F)
- 7 days/yr
- Hot days in 30 yrs
- 15 days/yr
Wind risk 2/10 · Minimal
- Chance of severe wind over 30 yrs
- —
Air-quality risk 2/10 · Minimal
- Unhealthy air days now
- 1 days/yr
- Unhealthy air days in 30 yrs
- 2 days/yr
Risk factors via First Street. Map © Google.
Why this score? — see what drove the C grade
The composite is a weighted blend of 9 inputs, each scored 0–100. Each bar is that input's sub-score; the figure is the points it added to the 100-point composite (weight × sub-score).
- Cash flow +20.2/30.0
- ARV discount +11.1/15.0
- DSCR +6.4/10.0
- Schools +4.7/10.0
- 1% rule +4.3/10.0
- Livability +4.2/5.0
- Rent growth +2.5/5.0
- Condition / age +2.5/5.0
- Appreciation +0.0/10.0
$439,000
🖨 Deal sheet (PDF) 📄 Offer letter ✓ Due diligence
Listing remarks MLS
Beautifully updated and meticulously maintained home loaded with major improvements inside and out! This move-in ready property features a complete kitchen remodel (2019) with all new appliances, remodeled bathrooms, and refinished hardwood floors (2026). The spacious primary suite includes a beautifully updated bath (2021) featuring the home's original clawfoot tub, while large walk-in closets provide exceptional storage throughout the bedrooms. Enjoy peace of mind with extensive mechanical and exterior upgrades, including a new lifetime warranty GAF shingle roof with complete roof overhaul in 2025, new flat roof over the upstairs rear bedroom (2025), two-stage high-efficiency furnace and ultra high-efficiency A/C (2020), updated electrical grounding (2023), constant pressure well pump (2023), sump pump with battery backup (2020), and a portable whole-house generator included with the sale. Water quality is exceptional with a 64,000-grain water softener, Centaur carbon iron filter (2021), and reverse osmosis drinking water system (2023). Outdoor living is just as impressive with a new composite rear deck and flagstone patio (2023), updated front porch, vinyl siding, newer windows with lifetime guarantee, and fresh concrete driveway, sidewalk, and garage floor (2021). The garage was fully remodeled in 2023 with insulation, electrical, drywall, and a professionally applied polyaspartic floor coating with industrial urethane finish. A one-car garage-sized shed with new electrical and drywall (2024) offers even more functional space. Additional highlights include a complete chimney rebuild (Dec 2024), remodeled basement (2026), attic insulation and glass block windows, and septic system pumped and inspected in August 2025. A rare opportunity to own a home where the big-ticket items have already been done!
Key facts
- Walk-in closets
- Clawfoot tub
- Kitchen remodel
Tags
Property features AI
Exterior
- Parking: Detached 2-car garage
- Utilities: Private well water; Septic tank sewer
- Home design: Single-family residence; Two levels; Ground-level entry with steps
- Construction: Brick and wood siding construction; Brick/mortar foundation; Asphalt roof; Built above grade with finished living area and additional finished space below grade
- Exterior features: Fenced lot; Gravel road access
Interior
- Bathrooms: 2 full bathrooms
- Heating & cooling: Central air conditioning; Forced air heating; Natural gas heating
- Interior features: Finished basement; Total of 14 rooms
Neighborhood map
What this means for you Summary
Snapshot
- This is a 5-bed/2.0-bath single-family listed at $439k.
Deal economics
- At list price, monthly cash flow is $554 ($7k/yr) — positive.
- The deal already cash-flows at list — no discount required.
- To meet the 1% rule (rent ≥ 1% of price), the offer needs to be $410k (6.6% below list).
- Recommended offer: $410k (6.6% below list) — sets the bar for 1% rule.
- Cap rate 7.8% vs local median 2.6% in South Lyon — top-decile yield for the area; either an underpriced asset or a hidden risk that comps aren't pricing in. Stress-test before assuming the spread holds.
Location & tenants
- Location reads 83/100 on livability (#46 in MI, #953 nationally) — a professional / high-income tenant draw. Strengths: crime A+, cost of living A+, housing A+; Watch: amenities C-, commute F.
- South Lyon Community Schools (suburban): math 46% / reading 59% proficiency, ranked #74 of 540 in MI (top 14%) — acceptable for families but not a draw, mixed tenant base, ~2y average lease; only 16% free/reduced lunch — higher-income household profile.
- Market conditions: 89 active listings in the ZIP; 1 comparable units currently listed for rent nearby; 2,614 units permitted in Oakland County in 2024 (721 in 5+ unit buildings).
Forward outlook
- Local home prices are declining (-3.0%/yr); year-one equity from $3k of loan paydown is wiped out by about $13k of value loss. Plan a longer hold.
- Oakland County population projected at +10% by 2050 — modest demand growth; plan on rents tracking national, not racing it.
Negotiation context
- Only 5 days on market — expect competitive offers; lowballing is unlikely to land.
- 7 sale attempts since 29y ago with the ask held roughly flat each time — persistent listings suggest the price (not the market) is what's stuck; bring a comps-based counter.
- Current owner paid $78k; list at $439k implies a 466% gain — meaningful room to come down on a strong offer.
Risks & watch-outs
- Watch-outs: built in 1929 — expect roof / HVAC / electrical / plumbing capex.
Questions for the listing agent
- Built in 1929 — when were the roof, HVAC, electrical panel, plumbing, and water heater last replaced?
- Is there a deadline driving the sale (1031 exchange, divorce, estate, relocation)? That informs how much negotiation room exists.
- Schools are B-rated — typically a magnet for longer-tenancy family renters. What's the average tenant stay here, and is there a school-zone premium baked into asking?
- What's the average days-on-market for RENTAL listings here right now (not sales)? A rising rental-DOM trend means longer vacancies and softer asking-rent achievability than the comps imply.
- What's the recent tenant-quality profile in this submarket — average credit score on applications, eviction rate, late-payment / NSF rate, and stable-employment percentage? A property-management company in the area should have these aggregated.
- How much new for-sale + rental construction is in the pipeline within 1–3 miles? Heavy new supply typically softens prices + rents 12–24 months out; constrained supply supports both.
Investment metrics
- 1% rule
- 0.93% ✗
- Cap rate
- 7.81%
- Cash-on-cash
- 5.41%
- DSCR
- 1.24
- GRM
- 8.9
CMA / ARV
- ARV (on-the-fly)
- $477,201
- Comps found
- 1
Show comp detail 1 sale within ~0.75 mi
| Address | Dist | Beds/Ba | Sqft | Sold | Price | $/sf | Match |
|---|---|---|---|---|---|---|---|
| 29651 Autumn Gold Dr | 0.65mi | 4/2.5 (-1) | 2,471 (+13%) | 4mo | $541,500 | $219 | 37 |
Match score weights: distance 35% · size 25% · config 20% · recency 20%. Top-matched comps best support the ARV.
Projected returns pro-forma
-3.0% appreciation · 3.0% rent growth · sell at horizon
- IRR
- -8.0%
- Equity multiple
- 0.71×
- Total profit
- $-35,993
- Equity at exit
- $65,456
- IRR
- 1.6%
- Equity multiple
- 1.11×
- Total profit
- $13,487
- Equity at exit
- $37,957
Cash invested: $122,920 (down + closing). Projections, not guarantees.
Landlord ↔ Tenant lean methodology
- Overall (STATE)
- 62 Landlord-Friendly
- State Michigan
- 62 Landlord-Friendly · EVEN
- County
- — inherits STATE
- City
- — inherits STATE
ZIP-level market 48165
- Active inventory
- 89
- Price-to-rent
- 8.9×
Monthly cashflow live
- Estimated rent
- $4,100 medium interval (Pro) →
- Mortgage (P&I)
- −$2,302
- Tax from tax record
- −$200 /mo · $2,397/yr
- Insurance
- −$183
- HOA
- −$0
- Vacancy / Maint / Mgmt
- −$861
- Net cashflow
- $554
Break-even live
Sensitivity live
| Price | -10% $803 | -5% $678 | +0% $554 | +5% $430 | +10% $306 |
|---|---|---|---|---|---|
| Rent | -10% $230 | -5% $392 | +0% $554 | +5% $716 | +10% $878 |
| Rate | -1.0pp $775 | -0.5pp $666 | base $554 | +0.5pp $440 | +1.0pp $325 |
UW: 25.0% down · 7.5% · 30yr · 1.5% tax · 5.0% vac · 8.0% maint · 8.0% mgmt
Financing live
Cash to close
- Down payment
- $109,750
- Closing costs
- $13,170
- Reserves months
- —
- Total cash needed
- —
Loan-product check · same deal, 3 products live
Conventional
25% down · 7.5% · 30yr
- Down + closing
- —
- Monthly P&I
- —
- Monthly cashflow
- —
- DSCR
- —
- Eligible?
- —
Personal DTI + credit; lowest rate.
DSCR
20% down · 8.5% · 30yr
- Down + closing
- —
- Monthly P&I
- —
- Monthly cashflow
- —
- DSCR
- —
- Eligible?
- —
No personal income docs; deal must DSCR.
Hard money
10% down · 12.0% · 12mo
- Down + closing
- —
- Monthly P&I
- —
- Monthly cashflow
- —
- DSCR
- —
- Eligible?
- —
Short-term bridge; refi at stabilization.
Rent comps 1 comps
| Address | Beds | Baths | Sqft | Rent | $/sqft | DOM | Units | Dist |
|---|---|---|---|---|---|---|---|---|
| 4881 Marquette Dr Milford, MI | 4.0 | 2.5 | 2400 | $4,100 | $1.71 | 0d | 1 | 0.76mi |
Listing history 6 events
-
2026-06-17status $439,000 Pending 5 DOM
-
2026-06-16days on market $439,000 Active 5 DOM
-
2026-06-15days on market $439,000 Active 4 DOM
-
2026-06-13days on market $439,000 Active 2 DOM
-
2026-06-13remarks 693-char remark
-
2026-06-13$439,000 Active 1 DOM
ⓘ Source: listings_history table (triggers on properties + properties_extension) + one-shot
backfill from property_details.listing_events for pre-trigger history.
Tax reassessment forecast MI · Partial reset (capped growth)
- Current annual tax
- $2,397 · $200/mo
- Projected year-2 tax
- $4,579 · $382/mo
- Expected delta
- +$2,182/yr (+$182/mo · 91.0%)
ⓘ Screening estimate from a state-policy table — verify with the county assessor before closing.
Climate risk First Street
- Flood 1/10 Low FEMA zone X (unshaded) · 0% chance over 30 yrs
- Wildfire 3/10 Moderate
- Heat 2/10 Low 7 d/yr ≥95°F today · 15 d/yr by 30 yrs out
- Wind 2/10 Low
- Air quality 2/10 Low 1 unhealthy d/yr today · 2 by 30 yrs out
Nearby sold comps map
Loading sold comps map…
Walkable amenities ~0.75 mi
Loading nearby amenities…
Taxation est. · year 1
- Rental income
- $49,200
- − Mortgage interest
- −$24,591
- − Property taxes
- −$2,397
- − Insurance
- −$2,195
- − Repairs & maintenance
- −$3,936
- − Management
- −$3,936
- − Depreciation
- −$12,771
- Taxable loss
- −$626
- Est. tax savings @ 24.0%
- +$150
- After-tax cash flow
- $6,800/yr
For passive investors: Depreciation is non-cash, so a rental often shows a tax loss while cash-flowing — sheltering income. Rental losses are passive: they offset passive income freely, and up to $25,000/yr can offset ordinary (W-2) income if you actively participate and your MAGI is under $100k (phasing out to $0 by $150k); unused losses carry forward. On sale, claimed depreciation is recaptured at up to 25%, and gains may owe capital-gains tax (a 1031 exchange can defer both). Figures are a year-1 estimate at your 24.0% rate — not tax advice; consult a CPA.
Schools (NCES district)
- District
- South Lyon Community Schools
- NCES district ID
- 2632250
- Math proficiency
- 46% ▼ -10.00%
- Reading proficiency
- 59% ▼ -4.00%
- Median HH income
- $71,419
- Composite
- 46.86/100
- National rank
- #2372
- State rank
- #74 of 540 in MI
Livability — South Lyon
- Score
- 83/100
- State rank
- #46
- US rank
- #953
Category grades
Schools grade is shown separately in the Schools card above.
Census & demographics
- City population
- 37,789
- Population (ZIP)
- 9,141
Population outlook (Oakland County) Hauer SSP2
- Today (2025)
- 1,335,747 people
- By 2030
- 1,375,100 · +2.9%
- By 2040
- 1,435,385 · +7.5%
- By 2050
- 1,469,250 · +10.0%
- By 2075
- 1,531,946 · +14.7%
- By 2100
- 1,450,485 · +8.6%
Race, ethnicity, and origin ACS 2023
- Neighborhood character
- Predominantly White (76%)
- Race & ethnicity
- White 76% Asian 11% Two or more races 10% Hispanic / Latino 8% Black 2%
- Hispanic origin (detail)
- Mexican 7%
- Common ancestry
- Romanian 9% Italian 2% Lithuanian 2%
- Foreign-born
- 8% · Canada, Vietnam, China
- Languages at home
- 87% English-only · Other Asian/Pacific 6% Spanish 4% Vietnamese 1%
Political lean MEDSL · Oakland
- 2024 margin
- D (+10.6) · D 54.4% · R 43.8% · Other 1.9%
- 2008→2024 swing
- -3.9pp toward R · 2008: 14.5pp · 2024: 10.6pp
- All cycles
- 2024: D+10.6 2020: D+14.1 2016: D+8.1 2012: D+8.1 2008: D+14.5
Not yet ingested
- Civics
- —
Market trends
- HPI YoY
- ▼ -169.34%
- Current HPI
- 211.8766
- Rent YoY
- —
- Metro
- —
- State GDP YoY
- ▲ 1.37%
- F500 in state
- 28
Industry mix (Fortune 500 HQ in MI)
| Industry | F500 HQs | Revenue |
|---|---|---|
| Automotive Parts | 3 | $48B |
|
||
| Automotive | 2 | $372B |
|
||
| Chemicals | 1 | $45B |
|
||
| Automotive Retail | 1 | $29B |
|
||
| Healthcare / Medical Devices | 1 | $23B |
|
||
| Automotive Technology | 1 | $20B |
|
||
Price history
+150.9% since first listed14 events — show timeline
- 2026-06-12 Listed $439,000 MiRealSource-MiMLS
- 2026-06-12 Listed $439,000 REALCOMP
- 2026-06-10 Coming Soon $439,000 MiRealSource-MiMLS
- 2009-08-31 Sold (MLS) $77,500 REALCOMP
- 2009-06-21 Listed $70,500 REALCOMP
- 2009-05-15 Listing Removed — REALCOMP
- 2009-04-30 Listed $70,500 REALCOMP
- 2009-04-15 Listing Removed — REALCOMP
- 2009-01-06 Listed $75,900 REALCOMP
- 1998-07-02 Sold (Public Records) $160,000 Public Records
- 1998-05-26 Sold (MLS) $160,000 REALCOMP
- 1997-12-17 Listed $175,000 REALCOMP
- 1997-12-14 Listing Removed — REALCOMP
- 1997-06-13 Listed $175,000 REALCOMP
Property tax history
+2.1%/yrLatest (2025): $2,397 · +4.3% YoY. Source: county tax records.
Cash-flow waterfall
monthlySold comps — $/sqft
last 12 mo · ≤1 miLoading sold comps…