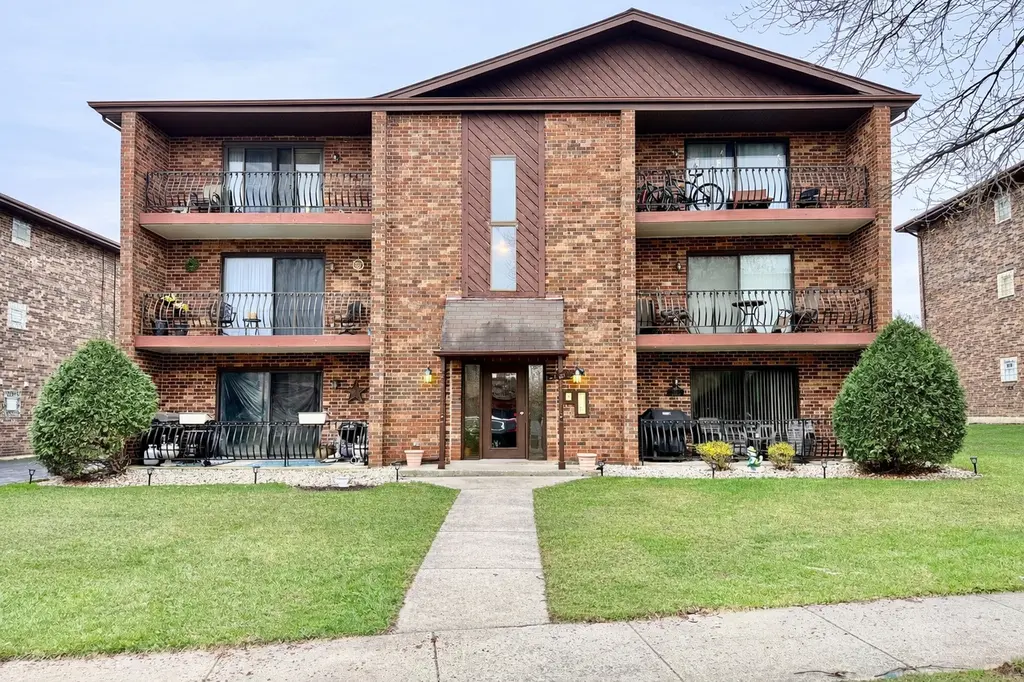
7925 Paxton Ave Unit 3B · Tinley Park, IL
Flood risk 1/10 · Minimal
- FEMA flood zone
- X (unshaded)
- Chance of flooding over 30 yrs
- 0.0%
- Est. flood insurance / yr
- $507 – $1,088
Fire risk 1/10 · Minimal
- Est. fire insurance / yr
- $804 – $1,492
Heat risk 3/10 · Minor
- Hot days now (above 102°F)
- 7 days/yr
- Hot days in 30 yrs
- 15 days/yr
Wind risk 2/10 · Minimal
- Chance of severe wind over 30 yrs
- —
Air-quality risk 4/10 · Minor
- Unhealthy air days now
- 4 days/yr
- Unhealthy air days in 30 yrs
- 5 days/yr
Risk factors via First Street. Map © Google.
Why this score? — see what drove the C- grade
The composite is a weighted blend of 9 inputs, each scored 0–100. Each bar is that input's sub-score; the figure is the points it added to the 100-point composite (weight × sub-score).
- Cash flow +20.6/30.0
- ARV discount +7.5/15.0
- 1% rule +6.5/10.0
- DSCR +6.5/10.0
- Livability +3.7/5.0
- Schools +3.4/10.0
- Rent growth +2.5/5.0
- Condition / age +2.5/5.0
- Appreciation +0.0/10.0
$204,900
🖨 Deal sheet 📄 Offer letter ✓ Due diligence
Listing remarks
Welcome to this bright and spacious 2-bedroom, 2-bath condo in the heart of Tinley Park! Featuring large rooms and beautiful hardwood floors throughout the condo, this home offers both comfort and style. Step out onto your private balcony-perfect for relaxing or entertaining. It is located near McCarthy park, The Bettenhausen Recreation Center and Tinley Park Pool, Grissom Jr. High, Andrew High School, and the Metra train station. A great opportunity to put your touch on a condo with a fantastic location!
Key facts
- Private balcony
- Fantastic location
- Hardwood floors
Tags
Property features AI
Finance
- HOA & community: Monthly association fee of $250; Association covers water, insurance, exterior maintenance, lawn care, scavenger and snow removal; Pets allowed (cats and dogs) with limits; maximum pet weight 25 lbs
Exterior
- Parking: Two assigned parking spaces
- Utilities: Water: Lake Michigan and public; Sewer: Storm sewer
- Home design: Attached single condo; Entry level: 3; Part of a 6-unit building; Estimated living area; Age: 41–50 years; Commuter train and interstate access nearby
- Construction: Brick construction
- Exterior features: Balcony; Common lot dimensions
Interior
- Kitchen: Eating area/table space; Range; Microwave; Dishwasher; Refrigerator
- Bedrooms: Master bedroom on main level (14 x 14); Second bedroom on main level (12 x 11); Two additional bedrooms
- Flooring: Luxury vinyl flooring in main living areas and bedrooms; Laminate flooring noted for other areas
- Bathrooms: One full bath; One half bath (in master bedroom)
- Heating & cooling: Natural gas heating; Central air conditioning
- Interior features: Five total rooms; Dining area combined with family room; In-unit laundry
- Laundry & utility: Washer and dryer in unit
Neighborhood map
What this means for you Summary
Snapshot
- This is a 2-bed/1.5-bath condo listed at $205k.
Deal economics
- At list price, monthly cash flow is $273 ($3k/yr) — positive.
- The deal already cash-flows at list — no discount required.
- Meets the 1% rule at list price ($2k rent vs $205k).
- Recommended offer: $193k (6.0% below list) — sets the bar for market timing.
- Cap rate 7.9% vs local median 4.3% in Tinley Park — top-decile yield for the area; either an underpriced asset or a hidden risk that comps aren't pricing in. Stress-test before assuming the spread holds.
Location & tenants
- Location reads 74/100 on livability (#246 in IL, #4,453 nationally) — a middle-class / working-renter tenant base. Strengths: commute A+, employment A+, housing A+; Watch: amenities F, health & safety F.
- Cons Hsd 230 (suburban): math 35% / reading 39% proficiency, ranked #146 of 620 in IL (top 24%) — families likely to look elsewhere, expect single-tenant / working-renter base with shorter leases.
- Zoned schools: Victor J Andrew High School (math 32% / reading 36%, grade F, #147 of 693 statewide, top 22%, 2,259 students, 0% FRL).
- Market conditions: 151 active listings in the ZIP; 7 comparable units currently listed for rent nearby; rentals leasing fast (median 5d on market — plan ~1-2 weeks tenant-placement turnaround); solid renter incomes; 6,272 units permitted in Cook County in 2024 (4,658 in 5+ unit buildings).
Forward outlook
- Local home prices are declining (-3.0%/yr); year-one equity from $1k of loan paydown is wiped out by about $6k of value loss. Plan a longer hold.
Negotiation context
- It's been on market 69 days — a 6% lower offer ($193k) is reasonable based on typical stale-listing flexibility.
- Current owner paid $87k; list at $205k implies a 136% gain — meaningful room to come down on a strong offer.
Questions for the listing agent
- It's been on market 69 days. Have you received any prior offers? Is the seller open to a 6% concession, seller financing, or rate buy-down credit?
- What does the HOA fee cover, when was the last increase, and are there any pending special assessments or reserve-fund shortfalls?
- Any open or pending special assessments — roof, HVAC, plumbing, elevator, façade? What's the per-unit balance and payoff schedule, and is the seller paying it off at close or rolling it to the buyer?
- Why hasn't it sold? Are there any deal-killer items the seller is aware of (foundation, flood, title, zoning, code violations)?
- Is there a deadline driving the sale (1031 exchange, divorce, estate, relocation)? That informs how much negotiation room exists.
- What's the average days-on-market for RENTAL listings here right now (not sales)? A rising rental-DOM trend means longer vacancies and softer asking-rent achievability than the comps imply.
- What's the recent tenant-quality profile in this submarket — average credit score on applications, eviction rate, late-payment / NSF rate, and stable-employment percentage? A property-management company in the area should have these aggregated.
- How much new apartment / multifamily construction is in the pipeline within 1–3 miles? Heavy new supply (>2% of stock underway) typically softens rents 12–24 months out; light construction supports rent growth.
Investment metrics
- 1% rule
- 1.15% ✓
- Cap rate
- 7.89%
- Cash-on-cash
- 5.71%
- DSCR
- 1.25
- GRM
- 7.3
CMA / ARV
No comps found within radius.
Projected returns pro-forma
-3.0% appreciation · 3.0% rent growth · sell at horizon
- IRR
- -7.4%
- Equity multiple
- 0.73×
- Total profit
- $-15,687
- Equity at exit
- $30,551
- IRR
- 2.3%
- Equity multiple
- 1.16×
- Total profit
- $9,280
- Equity at exit
- $17,716
Cash invested: $57,372 (down + closing). Projections, not guarantees.
Landlord ↔ Tenant lean methodology
- Overall (STATE)
- 43 Moderately Tenant-Leaning
- State Illinois
- 43 Moderately Tenant-Leaning · D+7
- County
- — inherits STATE
- City
- — inherits STATE
ZIP-level market 60477
- Active inventory
- 151
- Price-to-rent
- 7.3×
Monthly cashflow live
- Estimated rent
- $2,350 high interval (Pro) →
- Mortgage (P&I)
- −$1,075
- Tax from tax record
- −$174 /mo · $2,088/yr
- Insurance
- −$85
- HOA
- −$250
- Vacancy / Maint / Mgmt
- −$494
- Net cashflow
- $273
Break-even live
UW: 25.0% down · 7.5% · 30yr · 1.5% tax · 5.0% vac · 8.0% maint · 8.0% mgmt
Financing live
Cash to close
- Down payment
- $51,225
- Closing costs
- $6,147
- Reserves months
- —
- Total cash needed
- —
Loan-product check · same deal, 3 products live
Conventional
25% down · 7.5% · 30yr
- Down + closing
- —
- Monthly P&I
- —
- Monthly cashflow
- —
- DSCR
- —
- Eligible?
- —
Personal DTI + credit; lowest rate.
DSCR
20% down · 8.5% · 30yr
- Down + closing
- —
- Monthly P&I
- —
- Monthly cashflow
- —
- DSCR
- —
- Eligible?
- —
No personal income docs; deal must DSCR.
Hard money
10% down · 12.0% · 12mo
- Down + closing
- —
- Monthly P&I
- —
- Monthly cashflow
- —
- DSCR
- —
- Eligible?
- —
Short-term bridge; refi at stabilization.
Rent comps 7 comps
| Address | Beds | Baths | Sqft | Rent | $/sqft | DOM | Units | Dist |
|---|---|---|---|---|---|---|---|---|
| 16450 Cherry Hill Ave Tinley Park, IL | 3.0 | 2.0 | 1370 | $3,100 | $2.26 | 7d | 1 | 0.93mi |
| 16851 Harlem Ave Tinley Park, IL | 1.0–2.0 | 1.0–2.0 | 857 | $3,065 | $3.58 | 1d | 24 | 1.02mi |
| 16180 Apple Ln #2 Tinley Park, IL | 3.0 | 2.5 | 1250 | $2,900 | $2.32 | 5d | 1 | 1.15mi |
| 17385 70th Ave Apt I Tinley Park, IL | 2.0 | 1.0 | 900 | $1,350 | $1.50 | 16d | 1 | 1.41mi |
| 17545 71st Ave Tinley Park, IL | 3.0 | 1.5 | 1144 | $1,800 | $1.57 | 1d | 1 | 1.45mi |
| 17537 70th Ct Tinley Park, IL | 3.0 | 1.5 | 1170 | $3,000 | $2.56 | 1d | 1 | 1.47mi |
| 17212 Oak Park Ave Unit 2SE Tinley Park, IL | 2.0 | 2.0 | 1200 | $2,600 | $2.17 | 10d | 1 | 1.48mi |
HOA detail condo
- Monthly dues
- $250 · $3,000/yr
- Likely covers
- pool
- Assessments
- None detected in remarks — confirm with the listing agent.
Listing history 17 events
-
2026-06-18days on market $204,900 Active 69 DOM
-
2026-06-17days on market $204,900 Active 68 DOM
-
2026-06-16days on market $204,900 Active 67 DOM
-
2026-06-15days on market $204,900 Active 66 DOM
-
2026-06-13days on market $204,900 Active 64 DOM
-
2026-06-09days on market $204,900 Active 60 DOM
-
2026-06-08days on market $204,900 Active 59 DOM
-
2026-06-07pricedays on market $204,900 Active 58 DOM
-
2026-06-04days on market $209,900 Active 55 DOM
-
2026-06-03days on market $209,900 Active 54 DOM
-
2026-06-02days on market $209,900 Active 53 DOM
-
2026-06-01days on market $209,900 Active 52 DOM
-
2026-05-31days on market $209,900 Active 51 DOM
-
2026-04-27price $209,900
-
2026-04-10$214,900 Active
-
1998-05-28soldstatus $87,000
-
1994-05-27soldstatus $55,000
ⓘ Source: listings_history table (triggers on properties + properties_extension) + one-shot
backfill from property_details.listing_events for pre-trigger history.
Tax reassessment forecast IL · Partial reset (capped growth)
- Current annual tax
- $2,088 · $174/mo
- Projected year-2 tax
- $3,370 · $281/mo
- Expected delta
- +$1,281/yr (+$107/mo · 61.4%)
ⓘ Screening estimate from a state-policy table — verify with the county assessor before closing.
Climate risk First Street
- Flood 1/10 Low FEMA zone X (unshaded) · 0% chance over 30 yrs
- Wildfire 1/10 Low
- Heat 3/10 Moderate 7 d/yr ≥102°F today · 15 d/yr by 30 yrs out
- Wind 2/10 Low
- Air quality 4/10 Moderate 4 unhealthy d/yr today · 5 by 30 yrs out
Nearby sold comps map
Loading sold comps map…
Walkable amenities ~0.75 mi
Loading nearby amenities…
Taxation est. · year 1
- Rental income
- $28,204
- − Mortgage interest
- −$11,478
- − Property taxes
- −$2,088
- − Insurance
- −$1,024
- − Repairs & maintenance
- −$2,256
- − Management
- −$2,256
- − HOA
- −$3,000
- − Depreciation
- −$5,961
- Taxable income
- $140
- Est. tax owed @ 24.0%
- −$34
- After-tax cash flow
- $3,240/yr
For passive investors: Depreciation is non-cash, so a rental often shows a tax loss while cash-flowing — sheltering income. Rental losses are passive: they offset passive income freely, and up to $25,000/yr can offset ordinary (W-2) income if you actively participate and your MAGI is under $100k (phasing out to $0 by $150k); unused losses carry forward. On sale, claimed depreciation is recaptured at up to 25%, and gains may owe capital-gains tax (a 1031 exchange can defer both). Figures are a year-1 estimate at your 24.0% rate — not tax advice; consult a CPA.
Schools (NCES district)
- District
- Cons Hsd 230
- NCES district ID
- 1708400
- Math proficiency
- 35% ▼ -8.00%
- Reading proficiency
- 39% ▼ -6.00%
- Median HH income
- $73,953
- Composite
- 34.29/100
- National rank
- #5244
- State rank
- #146 of 620 in IL
Livability — Tinley Park
- Score
- 74/100
- State rank
- #246
- US rank
- #4453
Category grades
Schools grade is shown separately in the Schools card above.
Census & demographics
- Census place
- Tinley Park, IL
- County
- Cook County · 4,486,803 people
- City population
- 35,976
- Metro
- Chicago-Naperville-Elgin, IL-IN-WI
- Population (ZIP)
- 35,976
- Household income
- $94,927
- Rent vs Own
- Severe rent burden
- 753.0
Population outlook (Cook County) Hauer SSP2
- Today (2025)
- 5,347,519 people
- By 2030
- 5,357,703 · +0.2%
- By 2040
- 5,324,924 · -0.4%
- By 2050
- 5,230,762 · -2.2%
- By 2075
- 4,785,735 · -10.5%
- By 2100
- 4,188,836 · -21.7%
Race, ethnicity, and origin ACS 2023
- Neighborhood character
- Predominantly White (74%)
- Race & ethnicity
- White 74% Hispanic / Latino 12% Two or more races 9% Black 7% Asian 3%
- Hispanic origin (detail)
- Mexican 9% Puerto Rican 2%
- Common ancestry
- Romanian 14% Iranian 3% Lithuanian 2%
- Foreign-born
- 9% · Canada, China
- Languages at home
- 85% English-only · Spanish 6% Arabic 5% Other Indo-European 1%
Political lean MEDSL · Cook
- 2024 margin
- Solid D (+42.0) · D 70.4% · R 28.4% · Other 1.2%
- 2008→2024 swing
- -11.4pp toward R · 2008: 53.4pp · 2024: 42.0pp
- All cycles
- 2024: D+42.0 2020: D+50.3 2016: D+53.0 2012: D+49.4 2008: D+53.4
Not yet ingested
- Civics
- —
Market trends
- HPI YoY
- ▼ -272.64%
- Current HPI
- 190.7548
- Rent YoY
- —
- Metro
- Chicago-Naperville-Elgin, IL-IN-WI
- State GDP YoY
- ▲ 1.59%
- F500 in state
- 60
Industry mix (Fortune 500 HQ in IL)
| Industry | F500 HQs | Revenue |
|---|---|---|
| Insurance | 4 | $201B |
|
||
| Consumer Goods | 4 | $87B |
|
||
| Industrial Machinery | 3 | $64B |
|
||
| Healthcare | 2 | $55B |
|
||
| Retail / Pharmacy | 1 | $148B |
|
||
| Agriculture / Food | 1 | $86B |
|
||
Price history
+281.6% since first listed4 events — show timeline
- 2026-04-27 Price Changed $209,900 MRED as Distributed by MLS Grid
- 2026-04-10 Listed $214,900 MRED as Distributed by MLS Grid
- 1998-05-28 Sold (Public Records) $87,000 Public Records
- 1994-05-27 Sold (Public Records) $55,000 Public Records
Property tax history
+0.1%/yrLatest (2023): $2,088 · +16.6% YoY. Source: county tax records.
Cash-flow waterfall
monthlySold comps — $/sqft
last 12 mo · ≤1 miLoading sold comps…