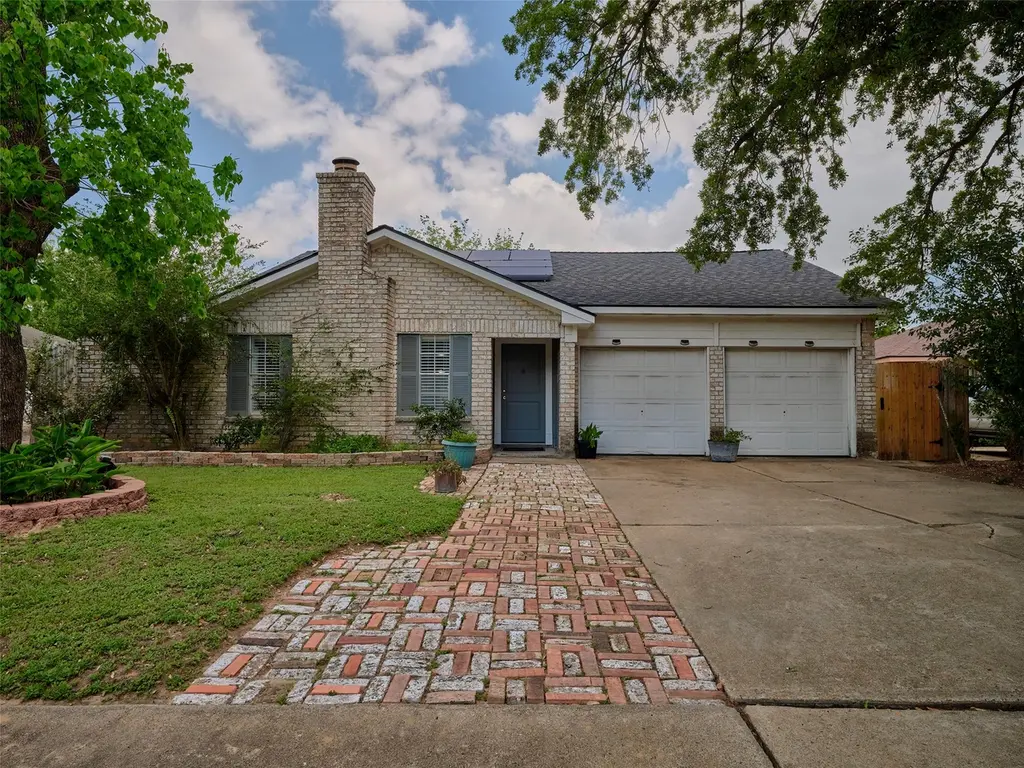
22106 Fincastle Dr · Houston, TX
Flood risk 3/10 · Minor
- FEMA flood zone
- X (unshaded)
- Chance of flooding over 30 yrs
- 0.2%
- Est. flood insurance / yr
- $507 – $1,088
Fire risk 1/10 · Minimal
- Est. fire insurance / yr
- $1,222 – $2,270
Heat risk 9/10 · Severe
- Hot days now (above 110°F)
- 7 days/yr
- Hot days in 30 yrs
- 20 days/yr
Wind risk 8/10 · Major
- Chance of severe wind over 30 yrs
- 99.0%
Air-quality risk 2/10 · Minimal
- Unhealthy air days now
- 1 days/yr
- Unhealthy air days in 30 yrs
- 2 days/yr
Risk factors via First Street. Map © Google.
Why this score? — see what drove the D grade
The composite is a weighted blend of 9 inputs, each scored 0–100. Each bar is that input's sub-score; the figure is the points it added to the 100-point composite (weight × sub-score).
- ARV discount +13.6/15.0
- Cash flow +8.2/30.0
- Schools +5.7/10.0
- 1% rule +3.7/10.0
- Livability +3.7/5.0
- Rent growth +2.5/5.0
- Condition / age +2.5/5.0
- DSCR +2.2/10.0
- Appreciation +0.0/10.0
$249,900
🖨 Deal sheet (PDF) 📄 Offer letter ✓ Due diligence
Listing remarks
GREAT LOCATION in a HIGHLY DESIRED NEIGHBORHOOD. Hurry to see what this nice one story home has to offer. The home features some recent interior paint, nice tile flooring in family areas, with laminate and vinyl plank in bedrooms, NO CARPET! This home has +/- 1916 sqft of space, and a huge family room with vaulted ceilings and full fireplace hearth wall, with wood burning fireplace. The kitchen is spacious and offers a massive peninsula with cooktop, as well as full range oven on opposite wall. The home was originally four bedrooms, but the closet for that bedroom was made into a pantry for the kitchen on the opposite wall. It could be converted back if the fourth bedroom with closet was n
Key facts
- Huge family room
- Tile flooring
- Vaulted ceilings
Tags
Property features AI
Finance
- HOA & community: Part of Goodwin and Company association; Community pool, playground and park; Annual association fee
Exterior
- Parking: Attached 2-car garage; Driveway parking
- Security: Smoke detectors
- Utilities: Public water; Public sewer; Concrete road access
- Home design: Residential property; Slab foundation; Composition roof; Built in 1977
- Construction: Brick, cement siding, and wood siding construction
- Exterior features: Deck; Patio; Porch; Backyard fence; Subdivision lot setting
Interior
- Kitchen: Dishwasher; Electric cooktop; Electric oven; Electric range / free-standing range; Disposal; Microwave; Refrigerator
- Bedrooms: Primary bedroom (First floor) — 16x12; Bedroom (First floor) — 14x10; Bedroom (First floor) — 11x10; Office (can serve as bedroom) (First floor) — 11x10; 4 possible bedrooms total
- Flooring: Engineered hardwood; Laminate plank; Tile; Vinyl
- Bathrooms: 2 full bathrooms; Primary bathroom (First floor) — 9x6; Bathroom (First floor) — 10x5
- Heating & cooling: Central heating (electric); Central air conditioning (electric)
- Interior features: Breakfast bar; Tile countertops; Tub with shower; Vaulted ceilings; Ceiling fans; Programmable thermostat; Wood-burning fireplace
- Laundry & utility: Washer hookup; Electric dryer hookup
Neighborhood map
What this means for you Summary
Snapshot
- This is a 3-bed/2.0-bath single-family listed at $250k.
Deal economics
- At list price, monthly cash flow is $-231 ($-3k/yr) — negative.
- To cash-flow at today's rent, offer at most $209k (16.3% below list).
- To meet the 1% rule (rent ≥ 1% of price), the offer needs to be $216k (13.4% below list).
- Recommended offer: $209k (16.3% below list) — sets the bar for cash-flow.
- Cap rate 5.2% vs local median 3.2% in Houston — top-decile yield for the area; either an underpriced asset or a hidden risk that comps aren't pricing in. Stress-test before assuming the spread holds.
Location & tenants
- Location reads 74/100 on livability (#184 in TX, #4,771 nationally) — a middle-class / working-renter tenant base. Strengths: amenities A+, cost of living A+, housing A+; Watch: crime F.
- Katy ISD (suburban): math 61% / reading 63% proficiency, ranked #29 of 826 in TX (top 4%) — acceptable for families but not a draw, mixed tenant base, ~2y average lease.
- Zoned schools: West Memorial El (math 32% / reading 38%, grade F, #1,965 of 4,322 statewide, top 46%, 829 students, 69% FRL); West Memorial J H (math 42% / reading 48%, grade D, #479 of 1,662 statewide, top 29%, 927 students, 72% FRL); Katy H S (math 62% / reading 74%, grade B, #150 of 1,632 statewide, top 10%, 3,330 students, 38% FRL) — zoned schools average 60% FRL vs 27% district-wide (32 pts higher); higher-poverty schools than district average — tighter screening recommended.
- Zoned-school proficiency averages 49% at this address vs 62% district-wide (-13 pts) — the specific schools serving this property underperform the Katy ISD average; the district grade overstates school quality for this exact location.
- Market conditions: Rents soft (-0.1%/yr); 396 active listings in the ZIP; 25 comparable units currently listed for rent nearby; rentals at typical pace (median 15d on market — plan ~3-4 weeks tenant-placement turnaround); solid renter incomes; 29,883 units permitted in Harris County in 2024 (8,621 in 5+ unit buildings).
Forward outlook
- Local home prices are declining (-3.0%/yr); year-one equity from $2k of loan paydown is wiped out by about $7k of value loss. Plan a longer hold.
- Harris County population projected at +47% by 2050 — long-run rental-demand tailwind backs the buy-and-hold thesis.
Negotiation context
- It's been on market 40 days — a 3% lower offer ($242k) is reasonable based on typical stale-listing flexibility.
Risks & watch-outs
- Climate carrying-cost: severe wind risk, 99% chance of damaging wind over 30y; extreme-heat days projected 7→20/yr by 2055 (HVAC capex compounding) — expect insurance premiums to compound above CPI over the hold.
Questions for the listing agent
- What do current leases actually rent for vs. the listed asking? Can we see a recent rent roll and the last 12 months of T-12 income?
- It's been on market 40 days. Have you received any prior offers? Is the seller open to a 16% concession, seller financing, or rate buy-down credit?
- Built in 1977 — when were the roof, HVAC, electrical panel, plumbing, and water heater last replaced?
- What does the HOA fee cover, when was the last increase, and are there any pending special assessments or reserve-fund shortfalls?
- Is there a deadline driving the sale (1031 exchange, divorce, estate, relocation)? That informs how much negotiation room exists.
- Schools are D-rated, which usually means shorter tenancies and higher turnover. Who's the typical renter profile here, and what's been the actual vacancy rate?
- Crime grade is F in this area — have there been break-ins, vandalism, or insurance claims at this property in the last 3 years? What carrier currently insures it and at what premium?
- The area grade is low — what's the realistic commute time and amenity access for the typical tenant pool here? Any planned neighborhood developments (good or bad) we should know about?
- What's the average days-on-market for RENTAL listings here right now (not sales)? A rising rental-DOM trend means longer vacancies and softer asking-rent achievability than the comps imply.
- What's the recent tenant-quality profile in this submarket — average credit score on applications, eviction rate, late-payment / NSF rate, and stable-employment percentage? A property-management company in the area should have these aggregated.
- How much new for-sale + rental construction is in the pipeline within 1–3 miles? Heavy new supply typically softens prices + rents 12–24 months out; constrained supply supports both.
Investment metrics
- 1% rule
- 0.87% ✗
- Cap rate
- 5.18%
- Cash-on-cash
- -3.96%
- DSCR
- 0.82
- GRM
- 9.6
CMA / ARV
- ARV (median comp)
- $288,928
- List price
- $249,900
- Delta
- -13.51%
- Verdict
- UNDERPRICED
- Comps
- 20 within 1.0 mi
Show comp detail 12 sales within ~0.75 mi
| Address | Dist | Beds/Ba | Sqft | Sold | Price | $/sf | Match |
|---|---|---|---|---|---|---|---|
| 22106 Fincastle Dr | 0.00mi | 3/2.0 | 1,916 (0%) | 0mo | $249,900 | $130 | 100 |
| 22319 Elsinore Dr | 0.28mi | 3/2.0 | 1,978 (+3%) | 1mo | $225,000 | $114 | 81 |
| 22330 Deville Dr | 0.33mi | 4/2.0 (+1) | 1,978 (+3%) | 1mo | $332,900 | $168 | 73 |
| 22210 Woodrose Dr | 0.38mi | 3/2.0 | 1,780 (-7%) | 1mo | $329,900 | $185 | 70 |
| 22106 Woodrose Dr | 0.34mi | 3/2.0 | 2,144 (+12%) | 2mo | $250,000 | $117 | 62 |
| 438 Concordia Dr | 0.59mi | 4/2.0 (+1) | 1,883 (-2%) | 3mo | $339,000 | $180 | 62 |
| 502 Pickford Dr | 0.65mi | 3/2.0 | 1,830 (-4%) | 3mo | $245,000 | $134 | 60 |
| 422 Concordia Dr | 0.59mi | 4/2.0 (+1) | 2,010 (+5%) | 4mo | $298,500 | $149 | 57 |
| 214 Buckeye Dr | 0.60mi | 3/2.0 | 1,710 (-11%) | 2mo | $270,000 | $158 | 52 |
| 22615 Poppyfield Dr | 0.64mi | 4/2.0 (+1) | 2,090 (+9%) | 2mo | $335,000 | $160 | 48 |
| 22726 Goldstone Dr | 0.68mi | 4/2.0 (+1) | 2,082 (+9%) | 2mo | $275,000 | $132 | 47 |
| 506 Concordia Dr | 0.60mi | 3/2.0 | 1,656 (-14%) | 3mo | $250,000 | $151 | 47 |
Match score weights: distance 35% · size 25% · config 20% · recency 20%. Top-matched comps best support the ARV.
Projected returns pro-forma
-3.0% appreciation · 0.0% rent growth · sell at horizon
- IRR
- -26.8%
- Equity multiple
- 0.12×
- Total profit
- $-61,396
- Equity at exit
- $37,261
- IRR
- -42.3%
- Equity multiple
- -0.38×
- Total profit
- $-96,269
- Equity at exit
- $21,607
Cash invested: $69,972 (down + closing). Projections, not guarantees.
Landlord ↔ Tenant lean methodology
- Overall (STATE)
- 87 Strongly Landlord-Friendly
- State Texas
- 87 Strongly Landlord-Friendly · R+5
- County
- — inherits STATE
- City
- — inherits STATE
ZIP-level market 77450
- Home prices YoY
- -28.1%
- Rents YoY
- -0.1%
- Active inventory
- 396
- Price-to-rent
- 9.6×
Monthly cashflow live
- Estimated rent
- $2,165 high interval (Pro) →
- Mortgage (P&I)
- −$1,311
- Tax from tax record
- −$474 /mo · $5,686/yr
- Insurance
- −$104
- HOA
- −$53
- Vacancy / Maint / Mgmt
- −$455
- Net cashflow
- $-231
Break-even live
Sensitivity live
| Price | -10% $-90 | -5% $-160 | +0% $-231 | +5% $-302 | +10% $-373 |
|---|---|---|---|---|---|
| Rent | -10% $-402 | -5% $-317 | +0% $-231 | +5% $-146 | +10% $-60 |
| Rate | -1.0pp $-105 | -0.5pp $-168 | base $-231 | +0.5pp $-296 | +1.0pp $-362 |
UW: 25.0% down · 7.5% · 30yr · 1.5% tax · 5.0% vac · 8.0% maint · 8.0% mgmt
Financing live
Cash to close
- Down payment
- $62,475
- Closing costs
- $7,497
- Reserves months
- —
- Total cash needed
- —
Loan-product check · same deal, 3 products live
Conventional
25% down · 7.5% · 30yr
- Down + closing
- —
- Monthly P&I
- —
- Monthly cashflow
- —
- DSCR
- —
- Eligible?
- —
Personal DTI + credit; lowest rate.
DSCR
20% down · 8.5% · 30yr
- Down + closing
- —
- Monthly P&I
- —
- Monthly cashflow
- —
- DSCR
- —
- Eligible?
- —
No personal income docs; deal must DSCR.
Hard money
10% down · 12.0% · 12mo
- Down + closing
- —
- Monthly P&I
- —
- Monthly cashflow
- —
- DSCR
- —
- Eligible?
- —
Short-term bridge; refi at stabilization.
Rent comps 25 comps
| Address | Beds | Baths | Sqft | Rent | $/sqft | DOM | Units | Dist |
|---|---|---|---|---|---|---|---|---|
| 451 Gentilly Dr Katy, TX | 3.0 | 2.0 | 1818 | $1,875 | $1.03 | 7d | 1 | 0.33mi |
| 451 Gentilly Dr Katy, TX | 3.0 | 2.0 | 1818 | $1,875 | $1.03 | 0d | 1 | 0.33mi |
| 222 Mason Creek Dr Unit 3174 Katy, TX | 3.0 | 2.0 | 1235 | $1,978 | $1.60 | 13d | 1 | 0.49mi |
| 222 Mason Creek Dr Unit 255 Katy, TX | 3.0 | 2.0 | 1235 | $1,978 | $1.60 | 45d | 1 | 0.49mi |
| 222 Mason Creek Dr Unit 3047 Katy, TX | 3.0 | 2.0 | 1235 | $1,978 | $1.60 | 13d | 1 | 0.55mi |
| 21550 Provincial Blvd Katy, TX | 1.0–3.0 | 1.0–2.0 | 1024 | $2,099 | $2.05 | 4d | 39 | 0.63mi |
| 423 Pickford Dr Katy, TX | 3.0 | 2.0 | 1523 | $1,745 | $1.15 | 14d | 1 | 0.64mi |
| 21455 Merchants Way Katy, TX | 3.0 | 2.5 | 1405 | $2,137 | $1.52 | 45d | 1 | 0.65mi |
| 21542 Provincial Blvd Katy, TX | 3.0 | 2.0 | 1308 | $1,912 | $1.46 | 45d | 1 | 0.83mi |
| 719 Park Knoll Ln Katy, TX | 4.0 | 4.5 | 2460 | $6,800 | $2.76 | 14d | 1 | 0.94mi |
| 21540 Provincial Blvd Katy, TX | 1.0–3.0 | 1.0–2.0 | 1052 | $2,149 | $2.04 | 0d | 48 | 0.97mi |
| 510 Westgreen Blvd Unit 533 Katy, TX | 2.0 | 2.0 | 1250 | $1,753 | $1.40 | 14d | 1 | 1.02mi |
| 510 Westgreen Blvd Unit 547 Katy, TX | 2.0 | 2.0 | 1250 | $1,753 | $1.40 | 45d | 1 | 1.02mi |
| 510 Westgreen Blvd Unit 2174 Katy, TX | 2.0 | 2.0 | 1250 | $1,728 | $1.38 | 17d | 1 | 1.02mi |
| 1046 Apache Falls Dr Katy, TX | 3.0 | 2.0 | 1805 | $2,400 | $1.33 | 26d | 1 | 1.06mi |
| 918 Cheyenne Meadows Dr Katy, TX | 3.0 | 2.0 | 1802 | $1,821 | $1.01 | 24d | 1 | 1.08mi |
| 21610 Park Wick Ln Katy, TX | 4.0 | 2.5 | 2150 | $2,150 | $1.00 | 14d | 1 | 1.12mi |
| 614 Ellingham Dr Katy, TX | 4.0 | 2.5 | 2513 | $3,150 | $1.25 | 18d | 1 | 1.25mi |
| 1562 N Westgreen Blvd Katy, TX | 3.0 | 2.0 | 1670 | $1,850 | $1.11 | 45d | 1 | 1.30mi |
| 21707 Park Bend Dr Katy, TX | 3.0 | 2.0 | 1500 | $2,300 | $1.53 | 45d | 1 | 1.37mi |
| 20926 Hamlet Ridge Ln Katy, TX | 4.0 | 2.5 | 2460 | $2,195 | $0.89 | 26d | 1 | 1.38mi |
| 1413 S Mason Rd Katy, TX | 2.0 | 2.0 | 1285 | $1,695 | $1.32 | 13d | 1 | 1.43mi |
| 1616 Partnership Way Katy, TX | 3.0 | 1.0–3.0 | 1283 | $2,940 | $2.29 | 0d | 49 | 1.46mi |
| 21430 Park Brook Dr Katy, TX | 4.0 | 2.0 | 2248 | $2,300 | $1.02 | 20d | 1 | 1.49mi |
| 23615 Western Centre Dr Katy, TX | 1.0–3.0 | 1.0–2.0 | 1051 | $2,230 | $2.12 | 0d | 31 | 1.49mi |
HOA detail
- Monthly dues
- $53 · $636/yr
Listing history 3 events
-
2026-04-20$259,900 Active 989-char remark
-
2002-01-09soldstatus
-
1988-01-02soldstatus
ⓘ Source: listings_history table (triggers on properties + properties_extension) + one-shot
backfill from property_details.listing_events for pre-trigger history.
Tax reassessment forecast TX · Resets to sale price
- Current annual tax
- $5,686 · $474/mo
- Projected year-2 tax
- $5,686 · $474/mo
- Expected delta
- $0/yr ($0/mo · 0.0%)
ⓘ Screening estimate from a state-policy table — verify with the county assessor before closing.
Climate risk First Street
- Flood 3/10 Moderate FEMA zone X (unshaded) · 20% chance over 30 yrs
- Wildfire 1/10 Low
- Heat 9/10 Extreme 7 d/yr ≥110°F today · 20 d/yr by 30 yrs out
- Wind 8/10 Severe 99% chance of damaging wind over 30 yrs
- Air quality 2/10 Low 1 unhealthy d/yr today · 2 by 30 yrs out
Nearby sold comps map
Loading sold comps map…
Walkable amenities ~0.75 mi
Loading nearby amenities…
Taxation est. · year 1
- Rental income
- $25,979
- − Mortgage interest
- −$13,998
- − Property taxes
- −$5,686
- − Insurance
- −$1,250
- − Repairs & maintenance
- −$2,078
- − Management
- −$2,078
- − HOA
- −$636
- − Depreciation
- −$7,270
- Taxable loss
- −$7,017
- Est. tax savings @ 24.0%
- +$1,684
- After-tax cash flow
- $-1,090/yr
For passive investors: Depreciation is non-cash, so a rental often shows a tax loss while cash-flowing — sheltering income. Rental losses are passive: they offset passive income freely, and up to $25,000/yr can offset ordinary (W-2) income if you actively participate and your MAGI is under $100k (phasing out to $0 by $150k); unused losses carry forward. On sale, claimed depreciation is recaptured at up to 25%, and gains may owe capital-gains tax (a 1031 exchange can defer both). Figures are a year-1 estimate at your 24.0% rate — not tax advice; consult a CPA.
Schools (NCES district)
- District
- Katy ISD
- NCES district ID
- 4825170
- Math proficiency
- 61% ▼ -7.00%
- Reading proficiency
- 63% ▼ -3.00%
- Median HH income
- $90,312
- Composite
- 56.59/100
- National rank
- #1146
- State rank
- #29 of 826 in TX
Livability — Houston
- Score
- 74/100
- State rank
- #184
- US rank
- #4771
Category grades
Schools grade is shown separately in the Schools card above.
Census & demographics
- County
- Harris County · 4,702,590 people
- City population
- 3,226,434
- Metro
- Houston-The Woodlands-Sugar Land, TX
- Population (ZIP)
- 71,906
- Household income
- $106,402
- Rent vs Own
- Severe rent burden
- 2259.0
Population outlook (Harris County) Hauer SSP2
- Today (2025)
- 5,571,493 people
- By 2030
- 6,089,821 · +9.3%
- By 2040
- 7,142,806 · +28.2%
- By 2050
- 8,185,864 · +46.9%
- By 2075
- 10,574,329 · +89.8%
- By 2100
- 12,109,958 · +117.4%
Race, ethnicity, and origin ACS 2023
- Neighborhood character
- Diverse neighborhood (Simpson 0.65)
- Race & ethnicity
- White 53% Hispanic / Latino 22% Two or more races 14% Asian 12% Black 7%
- Hispanic origin (detail)
- Mexican 10% Cuban 1%
- Common ancestry
- Lithuanian 3% Italian 2% Slovak 2%
- Foreign-born
- 26% · Canada, China, Jamaica
- Languages at home
- 67% English-only · Spanish 15% Other Indo-European 5% Chinese 3%
Political lean MEDSL · Harris
- 2024 margin
- Lean D (+5.5) · D 52.0% · R 46.4% · Other 1.6%
- 2008→2024 swing
- +3.9pp toward D · 2008: 1.6pp · 2024: 5.5pp
- All cycles
- 2024: D+5.5 2020: D+13.3 2016: D+12.4 2012: D+0.1 2008: D+1.6
Not yet ingested
- Civics
- —
Market trends
- HPI YoY
- ▼ -95.50%
- Current HPI
- 244.792
- Rent YoY
- ▼ -0.13%
- Metro
- Houston-The Woodlands-Sugar Land, TX
- State GDP YoY
- ▲ 3.95%
- F500 in state
- 110
Industry mix (Fortune 500 HQ in TX)
| Industry | F500 HQs | Revenue |
|---|---|---|
| Energy | 16 | $1,198B |
|
||
| Technology | 5 | $198B |
|
||
| Engineering / Construction | 4 | $72B |
|
||
| Energy Services | 3 | $60B |
|
||
| Utilities | 3 | $41B |
|
||
| Healthcare | 2 | $330B |
|
||
Price history
-3.8% since first listed6 events — show timeline
- 2026-06-17 Sold (MLS) — HARMLS
- 2026-05-30 Pending — HARMLS
- 2026-05-26 Price Changed $249,900 HARMLS
- 2026-04-20 Listed $259,900 HARMLS
- 2002-01-09 Sold (Public Records) — Public Records
- 1988-01-02 Sold (Public Records) — Public Records
Property tax history
+4.2%/yrLatest (2025): $5,686 · +8.9% YoY. Source: county tax records.
Cash-flow waterfall
monthlySold comps — $/sqft
last 12 mo · ≤1 miLoading sold comps…