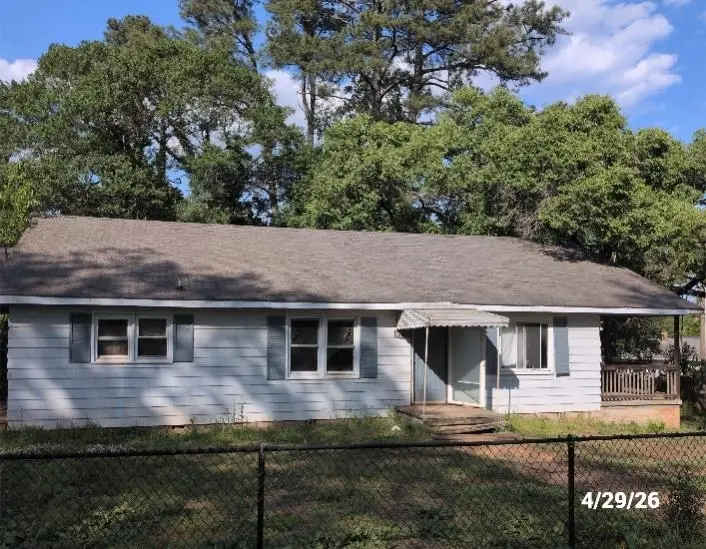
203 Brenton Ave · Whitney, SC
Flood risk 1/10 · Minimal
- FEMA flood zone
- X (unshaded)
- Chance of flooding over 30 yrs
- 0.0%
- Est. flood insurance / yr
- $507 – $1,088
Fire risk 2/10 · Minimal
- Est. fire insurance / yr
- $783 – $1,453
Heat risk 6/10 · Moderate
- Hot days now (above 105°F)
- 7 days/yr
- Hot days in 30 yrs
- 16 days/yr
Wind risk 2/10 · Minimal
- Chance of severe wind over 30 yrs
- 2.0%
Air-quality risk 4/10 · Minor
- Unhealthy air days now
- 3 days/yr
- Unhealthy air days in 30 yrs
- 4 days/yr
Risk factors via First Street. Map © Google.
Why this score? — see what drove the B- grade
The composite is a weighted blend of 9 inputs, each scored 0–100. Each bar is that input's sub-score; the figure is the points it added to the 100-point composite (weight × sub-score).
- Cash flow +30.0/30.0
- 1% rule +10.0/10.0
- DSCR +10.0/10.0
- ARV discount +7.5/15.0
- Schools +3.1/10.0
- Rent growth +2.7/5.0
- Livability +2.5/5.0
- Condition / age +2.5/5.0
- Appreciation +0.0/10.0
$85,000
🖨 Deal sheet (PDF) 📄 Offer letter ✓ Due diligence
Listing remarks
Investment Opportunity! This 3-bedroom, 1-bath bungalow offers endless potential for investors, flippers, or buyers looking to add their personal touch. Featuring classic bungalow charm and a functional layout, this home is ready for some TLC to restore it to its original character and beauty. Conveniently located near shopping, schools, restaurants, and with easy access to Interstate I-85, the property offers both value and location. Whether you're looking for your next renovation project or investment property, this one has great possibilities!
Key facts
- Near schools
- Bungalow charm
- Near shopping
Tags
Property features AI
Finance
- HOA & community: No community amenities listed
Exterior
- Parking: Gravel driveway
- Utilities: Public water; Cable available
- Home design: Single family residence; One level
- Construction: Composition roof
- Exterior features: Sloped, wooded lot
Interior
- Kitchen: Free‑standing range
- Flooring: Vinyl flooring; Hardwood flooring
- Bathrooms: 1 full bathroom
- Heating & cooling: Ceiling fans for cooling
- Interior features: Ceiling fans; Laminate countertops
- Laundry & utility: Washer hookup on main level; Electric dryer hookup
Neighborhood map
What this means for you Summary
Snapshot
- This is a 3-bed/1.0-bath single-family listed at $85k.
Deal economics
- At list price, monthly cash flow is $613 ($7k/yr) — positive.
- The deal already cash-flows at list — no discount required.
- Meets the 1% rule at list price ($1k rent vs $85k).
- Recommended offer: $82k (3.0% below list) — sets the bar for market timing.
Location & tenants
- Location reads: area grade B — affects rentability + tenant quality, not the cash-flow math above.
- Spartanburg 07 (urban): math 34% / reading 41% proficiency, ranked #39 of 80 in SC (top 49%) — families likely to look elsewhere, expect single-tenant / working-renter base with shorter leases; 62% free/reduced lunch — lower-income household profile, screen leases tightly.
- Zoned schools: Spartanburg High (math 67% / reading 79%, grade B+, #44 of 196 statewide, top 23%, 2,056 students, 85% FRL) — zoned schools average 85% FRL vs 62% district-wide (24 pts higher); higher-poverty schools than district average — tighter screening recommended.
- Zoned-school proficiency averages 73% at this address vs 38% district-wide (+36 pts) — the actual schools serving this property are materially stronger than the Spartanburg 07 average implies; a family-tenant draw the district grade alone would hide.
- Market conditions: Rents flat; 275 active listings in the ZIP; 10 comparable units currently listed for rent nearby; rentals at typical pace (median 23d on market — plan ~3-4 weeks tenant-placement turnaround); 3,129 units permitted in Spartanburg County in 2024 (40 in 5+ unit buildings).
Forward outlook
- Local home prices are declining (-3.0%/yr); year-one equity from $588 of loan paydown is wiped out by about $3k of value loss. Plan a longer hold.
- Spartanburg County population projected at +18% by 2050 — long-run rental-demand tailwind backs the buy-and-hold thesis.
- At projected returns (-3.0% appreciation + 0.6% rent growth), your $24k cash investment doubles in ~5 years — after that, you're playing with house money.
Negotiation context
- It's been on market 37 days — a 3% lower offer ($82k) is reasonable based on typical stale-listing flexibility.
- 2 sale attempts since 24y ago; this cycle's ask has dropped $10k (11%) from the opening price — seller is motivated, your offer sets the floor, not the list.
- Current owner paid $57k; 49% above their basis — modest negotiation headroom, anchor on the comps not their cost.
Risks & watch-outs
- Watch-outs: built in 1950 — expect roof / HVAC / electrical / plumbing capex.
- Climate carrying-cost: extreme-heat days projected 7→16/yr by 2055 (HVAC capex compounding) — expect insurance premiums to compound above CPI over the hold.
Questions for the listing agent
- It's been on market 37 days. Have you received any prior offers? Is the seller open to a 3% concession, seller financing, or rate buy-down credit?
- Built in 1950 — when were the roof, HVAC, electrical panel, plumbing, and water heater last replaced?
- Is there a deadline driving the sale (1031 exchange, divorce, estate, relocation)? That informs how much negotiation room exists.
- What's the average days-on-market for RENTAL listings here right now (not sales)? A rising rental-DOM trend means longer vacancies and softer asking-rent achievability than the comps imply.
- What's the recent tenant-quality profile in this submarket — average credit score on applications, eviction rate, late-payment / NSF rate, and stable-employment percentage? A property-management company in the area should have these aggregated.
- How much new for-sale + rental construction is in the pipeline within 1–3 miles? Heavy new supply typically softens prices + rents 12–24 months out; constrained supply supports both.
Investment metrics
- 1% rule
- 1.72% ✓
- Cap rate
- 14.94%
- Cash-on-cash
- 30.89%
- DSCR
- 2.37
- GRM
- 4.8
CMA / ARV
- ARV (on-the-fly)
- $236,250
- Comps found
- 12
Show comp detail 12 sales within ~0.75 mi
| Address | Dist | Beds/Ba | Sqft | Sold | Price | $/sf | Match |
|---|---|---|---|---|---|---|---|
| 671 Chesnee Hwy Hwy | 0.08mi | 3/2.0 | 1,301 (-4%) | 2mo | $199,900 | $154 | 85 |
| 197 Loblolly Dr | 0.30mi | 3/2.0 | 1,333 (-1%) | 7mo | $241,800 | $181 | 74 |
| 613 Greenhill Rd | 0.49mi | 3/1.0 | 1,260 (-7%) | 3mo | $195,000 | $155 | 63 |
| 301 E Myles Ln | 0.43mi | 3/2.0 | 1,244 (-8%) | 0mo | $219,000 | $176 | 63 |
| 198 Loblolly Dr | 0.28mi | 3/2.0 | 1,200 (-11%) | 4mo | $225,000 | $188 | 61 |
| 119 Larch Cir | 0.31mi | 2/2.0 (-1) | 1,491 (+10%) | 2mo | $180,000 | $121 | 57 |
| 821 Hillwood Ave | 0.48mi | 3/1.5 | 1,244 (-8%) | 7mo | $120,000 | $96 | 56 |
| 813 Hillwood Ave Ave | 0.51mi | 3/1.0 | 1,164 (-14%) | 1mo | $147,500 | $127 | 53 |
| 1030 Mayview St | 0.62mi | 3/1.5 | 1,229 (-9%) | 4mo | $217,000 | $177 | 51 |
| 14 Damson St | 0.47mi | 2/1.0 (-1) | 1,160 (-14%) | 0mo | $165,000 | $142 | 50 |
| 711 Springhill Ave | 0.50mi | 3/2.0 | 1,170 (-13%) | 3mo | $204,900 | $175 | 48 |
| 964 Iron Ore Rd Rd | 0.64mi | 3/2.0 | 1,180 (-13%) | 1mo | $220,000 | $186 | 44 |
Match score weights: distance 35% · size 25% · config 20% · recency 20%. Top-matched comps best support the ARV.
Projected returns pro-forma
-3.0% appreciation · 0.64% rent growth · sell at horizon
- IRR
- 23.0%
- Equity multiple
- 1.92×
- Total profit
- $21,854
- Equity at exit
- $12,674
- IRR
- 29.5%
- Equity multiple
- 3.35×
- Total profit
- $55,983
- Equity at exit
- $7,349
Cash invested: $23,800 (down + closing). Projections, not guarantees.
Landlord ↔ Tenant lean methodology
- Overall (STATE)
- 90 Strongly Landlord-Friendly
- State South Carolina
- 90 Strongly Landlord-Friendly · R+6
- County
- — inherits STATE
- City
- — inherits STATE
ZIP-level market 29307
- Home prices YoY
- -17.7%
- Rents YoY
- 0.6%
- Active inventory
- 275
- Price-to-rent
- 4.8×
Monthly cashflow live
- Estimated rent
- $1,462 high interval (Pro) →
- Mortgage (P&I)
- −$446
- Tax from tax record
- −$61 /mo · $733/yr
- Insurance
- −$35
- HOA
- −$0
- Vacancy / Maint / Mgmt
- −$307
- Net cashflow
- $613
Break-even live
Sensitivity live
| Price | -10% $661 | -5% $637 | +0% $613 | +5% $589 | +10% $565 |
|---|---|---|---|---|---|
| Rent | -10% $497 | -5% $555 | +0% $613 | +5% $670 | +10% $728 |
| Rate | -1.0pp $656 | -0.5pp $634 | base $613 | +0.5pp $591 | +1.0pp $568 |
UW: 25.0% down · 7.5% · 30yr · 1.5% tax · 5.0% vac · 8.0% maint · 8.0% mgmt
Financing live
Cash to close
- Down payment
- $21,250
- Closing costs
- $2,550
- Reserves months
- —
- Total cash needed
- —
Loan-product check · same deal, 3 products live
Conventional
25% down · 7.5% · 30yr
- Down + closing
- —
- Monthly P&I
- —
- Monthly cashflow
- —
- DSCR
- —
- Eligible?
- —
Personal DTI + credit; lowest rate.
DSCR
20% down · 8.5% · 30yr
- Down + closing
- —
- Monthly P&I
- —
- Monthly cashflow
- —
- DSCR
- —
- Eligible?
- —
No personal income docs; deal must DSCR.
Hard money
10% down · 12.0% · 12mo
- Down + closing
- —
- Monthly P&I
- —
- Monthly cashflow
- —
- DSCR
- —
- Eligible?
- —
Short-term bridge; refi at stabilization.
Rent comps 10 comps
| Address | Beds | Baths | Sqft | Rent | $/sqft | DOM | Units | Dist |
|---|---|---|---|---|---|---|---|---|
| 731 Old Whitney Rd Spartanburg, SC | 3.0 | 2.5 | 1450 | $1,700 | $1.17 | 15d | 1 | 0.30mi |
| 121 Garner Rd Spartanburg, SC | 1.0–2.0 | 1.0–2.0 | 940 | $1,465 | $1.56 | 22d | 32 | 0.69mi |
| 320 Spruce St Spartanburg, SC | 1.0–3.0 | 1.0–1.5 | 830 | $1,150 | $1.38 | 22d | 1 | 0.84mi |
| 490 Barnwell Rd Spartanburg, SC | 3.0 | 2.0 | 1575 | $1,706 | $1.08 | 15d | 1 | 1.02mi |
| 3900 Taggart Dr Spartanburg, SC | 1.0–3.0 | 1.0–2.0 | 854 | $1,295 | $1.52 | 22d | 3 | 1.25mi |
| 692 Southern St Spartanburg, SC | 2.0 | 1.0 | 1000 | $1,100 | $1.10 | 15d | 1 | 1.27mi |
| 560 Magnolia St Spartanburg, SC | 2.0 | 1.0 | 965 | $1,113 | $1.15 | 22d | 1 | 1.33mi |
| 753A Leonard St Spartanburg, SC | 2.0 | 1.0 | 1130 | $1,185 | $1.05 | 15d | 1 | 1.35mi |
| 119 Bonner Rd Spartanburg, SC | 2.0 | 1.0 | 900 | $845 | $0.94 | 22d | 1 | 1.42mi |
| 1214 Spring St Spartanburg, SC | 3.0 | 1.0 | 1362 | $1,395 | $1.02 | 15d | 1 | 1.44mi |
Listing history 20 events
-
2026-06-21days on market $85,000 Active 37 DOM
-
2026-06-18days on market $85,000 Active 34 DOM
-
2026-06-17days on market $85,000 Active 33 DOM
-
2026-06-16days on market $85,000 Active 32 DOM
-
2026-06-15days on market $85,000 Active 31 DOM
-
2026-06-14days on market $85,000 Active 29 DOM
-
2026-06-13days on market $85,000 Active 28 DOM
-
2026-06-10days on market $85,000 Active 26 DOM
-
2026-06-09days on market $85,000 Active 25 DOM
-
2026-06-09price $85,000 Active 24 DOM
-
2026-06-08days on market $95,000 Active 24 DOM
-
2026-06-07days on market $95,000 Active 23 DOM
-
2026-06-02days on market $95,000 Active 18 DOM
-
2026-06-01days on market $95,000 Active 17 DOM
-
2026-05-31days on market $95,000 Active 16 DOM
-
2026-05-30days on market $95,000 Active 15 DOM
-
2026-05-13$95,000 Active
-
2002-08-01soldstatus $57,200
-
2002-07-31soldstatus $57,200
-
2002-07-02$57,000
ⓘ Source: listings_history table (triggers on properties + properties_extension) + one-shot
backfill from property_details.listing_events for pre-trigger history.
Tax reassessment forecast SC · Resets to sale price
- Current annual tax
- $733 · $61/mo
- Projected year-2 tax
- $733 · $61/mo
- Expected delta
- $0/yr ($0/mo · 0.0%)
ⓘ Screening estimate from a state-policy table — verify with the county assessor before closing.
Climate risk First Street
- Flood 1/10 Low FEMA zone X (unshaded) · 0% chance over 30 yrs
- Wildfire 2/10 Low
- Heat 6/10 Major 7 d/yr ≥105°F today · 16 d/yr by 30 yrs out
- Wind 2/10 Low 2% chance of damaging wind over 30 yrs
- Air quality 4/10 Moderate 3 unhealthy d/yr today · 4 by 30 yrs out
Nearby sold comps map
Loading sold comps map…
Walkable amenities ~0.75 mi
Loading nearby amenities…
Taxation est. · year 1
- Rental income
- $17,544
- − Mortgage interest
- −$4,761
- − Property taxes
- −$733
- − Insurance
- −$425
- − Repairs & maintenance
- −$1,404
- − Management
- −$1,404
- − Depreciation
- −$2,473
- Taxable income
- $6,345
- Est. tax owed @ 24.0%
- −$1,523
- After-tax cash flow
- $5,830/yr
For passive investors: Depreciation is non-cash, so a rental often shows a tax loss while cash-flowing — sheltering income. Rental losses are passive: they offset passive income freely, and up to $25,000/yr can offset ordinary (W-2) income if you actively participate and your MAGI is under $100k (phasing out to $0 by $150k); unused losses carry forward. On sale, claimed depreciation is recaptured at up to 25%, and gains may owe capital-gains tax (a 1031 exchange can defer both). Figures are a year-1 estimate at your 24.0% rate — not tax advice; consult a CPA.
Schools (NCES district)
- District
- Spartanburg 07
- NCES district ID
- 4503660
- Math proficiency
- 34% ▼ -1.00%
- Reading proficiency
- 41% ▼ -1.00%
- Median HH income
- $35,825
- Composite
- 31.04/100
- National rank
- #6087
- State rank
- #39 of 80 in SC
Livability — Whitney
No livability data for this city. (Only ~50 U.S. cities are tracked.)
Census & demographics
- Census place
- Whitney, SC
- County
- Spartanburg County · 258,607 people
- Metro
- Spartanburg, SC
- Population (ZIP)
- 19,115
- Household income
- $65,850
- Rent vs Own
- Severe rent burden
- 438.0
Population outlook (Spartanburg County) Hauer SSP2
- Today (2025)
- 325,495 people
- By 2030
- 338,800 · +4.1%
- By 2040
- 363,471 · +11.7%
- By 2050
- 384,156 · +18.0%
- By 2075
- 430,137 · +32.1%
- By 2100
- 442,733 · +36.0%
Race, ethnicity, and origin ACS 2023
- Neighborhood character
- Predominantly White (74%)
- Race & ethnicity
- White 74% Black 20% Two or more races 4% Hispanic / Latino 3%
- Common ancestry
- Serbian 4% Slovak 2% Romanian 1%
- Foreign-born
- 4% · Canada, Jamaica
- Languages at home
- 91% English-only · Spanish 5% Russian/Polish/Slavic 1% Other Indo-European 1%
Political lean MEDSL · Spartanburg
- 2024 margin
- Solid R (+33.6) · D 32.6% · R 66.2% · Other 1.2%
- 2008→2024 swing
- -12.0pp toward R · 2008: -21.6pp · 2024: -33.6pp
- All cycles
- 2024: R+33.6 2020: R+27.3 2016: R+30.0 2012: R+23.1 2008: R+21.6
Not yet ingested
- Civics
- —
Market trends
- HPI YoY
- ▼ -52.58%
- Current HPI
- 244.9855
- Rent YoY
- ▲ 0.64%
- Metro
- Spartanburg, SC
- State GDP YoY
- ▲ 4.51%
- F500 in state
- 2
Industry mix (Fortune 500 HQ in SC)
| Industry | F500 HQs | Revenue |
|---|---|---|
| Packaging | 1 | $7B |
|
||
Price history
+66.7% since first listed4 events — show timeline
- 2026-05-13 Listed $95,000 SPMLS
- 2002-08-01 Sold (Public Records) $57,200 Public Records
- 2002-07-31 Sold (MLS) $57,200 SPMLS
- 2002-07-02 Listed $57,000 SPMLS
Property tax history
+3.6%/yrLatest (2025): $733 · +1.4% YoY. Source: county tax records.
Cash-flow waterfall
monthlySold comps — $/sqft
last 12 mo · ≤1 miLoading sold comps…