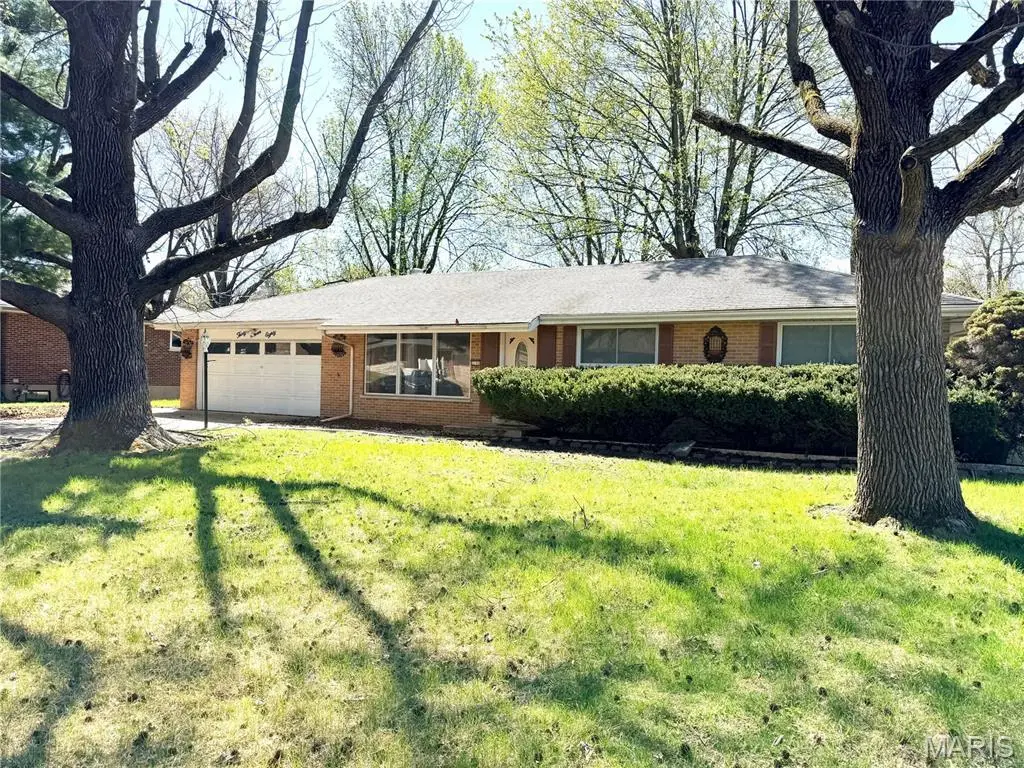
3780 Marietta Dr · Florissant, MO
Flood risk 4/10 · Minor
- FEMA flood zone
- X (unshaded)
- Chance of flooding over 30 yrs
- 0.22%
- Est. flood insurance / yr
- $473 – $860
Fire risk 1/10 · Minimal
- Est. fire insurance / yr
- $1,054 – $1,958
Heat risk 5/10 · Moderate
- Hot days now (above 106°F)
- 7 days/yr
- Hot days in 30 yrs
- 21 days/yr
Wind risk 2/10 · Minimal
- Chance of severe wind over 30 yrs
- 1.0%
Air-quality risk 3/10 · Minor
- Unhealthy air days now
- 3 days/yr
- Unhealthy air days in 30 yrs
- 5 days/yr
Risk factors via First Street. Map © Google.
Why this score? — see what drove the B grade
The composite is a weighted blend of 9 inputs, each scored 0–100. Each bar is that input's sub-score; the figure is the points it added to the 100-point composite (weight × sub-score).
- Cash flow +22.7/30.0
- ARV discount +15.0/15.0
- Appreciation +10.0/10.0
- DSCR +7.3/10.0
- 1% rule +5.9/10.0
- Rent growth +4.4/5.0
- Livability +3.7/5.0
- Condition / age +2.5/5.0
- Schools +1.2/10.0
$169,900
🖨 Deal sheet (PDF) 📄 Offer letter ✓ Due diligence
Listing remarks MLS
This 3-bedroom, 2.5-bath home has over 2,500 square feet of living space including an addition living room and 2-“sleeping rooms” with a bathroom in the finished basement. The main level has a beautiful spacious living room and an eat-in kitchen. Plus there is a room addition on the back of the home offering even more space. The outside a patio overlooks the spacious backyard with mature tree. The backyard also back to open space behind the home offering great privacy. This home has 2-car garage, that you can actually get two cars in. Plus there is additional room for other yard equipment or storage. Schedule your showing TODAY! It won't last long at this price....!
Key facts
- Open space
- Spacious backyard
- Finished basement
Tags
Neighborhood map
What this means for you Summary
Snapshot
- This is a 3-bed/2.5-bath single-family listed at $170k.
Deal economics
- At list price, monthly cash flow is $292 ($4k/yr) — positive.
- The deal already cash-flows at list — no discount required.
- Meets the 1% rule at list price ($2k rent vs $170k).
- Recommended offer: $165k (3.0% below list) — sets the bar for market timing.
- Cap rate 8.4% vs local median 6.3% in Florissant — top-decile yield for the area; either an underpriced asset or a hidden risk that comps aren't pricing in. Stress-test before assuming the spread holds.
Location & tenants
- Location reads 73/100 on livability (#82 in MO) — a middle-class / working-renter tenant base. Strengths: cost of living A+, housing A+, health & safety B+; Watch: crime C-, amenities D+, schools D.
- Ferguson-Florissant R-II (suburban): math 7% / reading 20% proficiency, ranked #311 of 324 in MO (top 96%) — low school quality limits family demand, transient renter base, plan for 1-2y turnover; 70% free/reduced lunch — lower-income household profile, screen leases tightly.
- Market conditions: Rents rising fast (+7.5%/yr); 218 active listings in the ZIP; 13 comparable units currently listed for rent nearby; rentals at typical pace (median 15d on market — plan ~3-4 weeks tenant-placement turnaround); 920 units permitted in St. Louis County in 2024 (250 in 5+ unit buildings).
- This rent runs 33% of the median local income ($67k/yr) — at the standard rent-burdened threshold; future hikes will face affordability resistance.
Forward outlook
- In year one you build about $18k of equity ($1k loan paydown + $17k appreciation (10.0% local appreciation)).
- At projected returns (10.0% appreciation + 7.5% rent growth), your $48k cash investment doubles in ~3 years — after that, you're playing with house money.
- By year 3, paydown + projected appreciation supports a ~$46k cash-out refi (75% LTV) — recoverable capital for the next deal without selling this one.
Negotiation context
- It's been on market 50 days — a 3% lower offer ($165k) is reasonable based on typical stale-listing flexibility.
- 2 sale attempts since 13y ago with the ask held roughly flat each time — persistent listings suggest the price (not the market) is what's stuck; bring a comps-based counter.
- Current owner paid $89k; list at $170k implies a 91% gain — meaningful room to come down on a strong offer.
Risks & watch-outs
- Climate carrying-cost: extreme-heat days projected 7→21/yr by 2055 (HVAC capex compounding) — expect insurance premiums to compound above CPI over the hold.
Questions for the listing agent
- It's been on market 50 days. Have you received any prior offers? Is the seller open to a 3% concession, seller financing, or rate buy-down credit?
- Built in 1960 — when were the roof, HVAC, electrical panel, plumbing, and water heater last replaced?
- Is there a deadline driving the sale (1031 exchange, divorce, estate, relocation)? That informs how much negotiation room exists.
- Schools are D-rated, which usually means shorter tenancies and higher turnover. Who's the typical renter profile here, and what's been the actual vacancy rate?
- What's the average days-on-market for RENTAL listings here right now (not sales)? A rising rental-DOM trend means longer vacancies and softer asking-rent achievability than the comps imply.
- What's the recent tenant-quality profile in this submarket — average credit score on applications, eviction rate, late-payment / NSF rate, and stable-employment percentage? A property-management company in the area should have these aggregated.
- How much new for-sale + rental construction is in the pipeline within 1–3 miles? Heavy new supply typically softens prices + rents 12–24 months out; constrained supply supports both.
Investment metrics
- 1% rule
- 1.09% ✓
- Cap rate
- 8.36%
- Cash-on-cash
- 7.37%
- DSCR
- 1.33
- GRM
- 7.7
CMA / ARV
- ARV (median comp)
- $234,784
- List price
- $169,900
- Delta
- -27.64%
- Verdict
- UNDERPRICED
- Comps
- 20 within 1.0 mi
Show comp detail 12 sales within ~0.75 mi
| Address | Dist | Beds/Ba | Sqft | Sold | Price | $/sf | Match |
|---|---|---|---|---|---|---|---|
| 1480 Surrey Dr | 0.21mi | 3/2.0 | 1,415 (-10%) | 5mo | $139,900 | $99 | 67 |
| 1 Club Grounds North Dr | 0.26mi | 3/2.0 | 1,426 (-10%) | 4mo | $209,900 | $147 | 66 |
| 35 Wild Ridge/hazeltine | 0.61mi | 3/2.0 | 1,612 (+2%) | 1mo | $317,742 | $197 | 65 |
| 3940 Parker Rd | 0.33mi | 3/1.5 | 1,705 (+8%) | 4mo | $182,000 | $107 | 64 |
| 3175 Harness Dr | 0.57mi | 4/2.0 (+1) | 1,608 (+2%) | 0mo | $240,000 | $149 | 63 |
| 660 Brookstone Dr | 0.53mi | 4/2.0 (+1) | 1,647 (+4%) | 0mo | $205,500 | $125 | 60 |
| 33 Club Grounds South Dr | 0.42mi | 3/3.0 | 1,771 (+12%) | 1mo | $235,000 | $133 | 57 |
| 4 Whitney Cir | 0.34mi | 4/2.0 (+1) | 1,722 (+9%) | 5mo | $254,900 | $148 | 57 |
| 2010 Cordoba Dr | 0.54mi | 3/2.0 | 1,436 (-9%) | 2mo | $229,900 | $160 | 56 |
| 3255 Classic Dr | 0.62mi | 3/2.0 | 1,416 (-10%) | 0mo | $250,000 | $177 | 52 |
| 1480 Stallion Dr | 0.51mi | 4/2.0 (+1) | 1,737 (+10%) | 4mo | $239,900 | $138 | 49 |
| 3515 Saint Catherine St | 0.66mi | 3/2.0 | 1,389 (-12%) | 4mo | $199,900 | $144 | 44 |
Match score weights: distance 35% · size 25% · config 20% · recency 20%. Top-matched comps best support the ARV.
Projected returns pro-forma
10.0% appreciation · 7.51% rent growth · sell at horizon
- IRR
- 31.5%
- Equity multiple
- 3.52×
- Total profit
- $119,943
- Equity at exit
- $153,059
- IRR
- 28.8%
- Equity multiple
- 8.57×
- Total profit
- $359,951
- Equity at exit
- $330,078
Cash invested: $47,572 (down + closing). Projections, not guarantees.
Landlord ↔ Tenant lean methodology
- Overall (STATE)
- 81 Strongly Landlord-Friendly
- State Missouri
- 81 Strongly Landlord-Friendly · R+10
- County
- — inherits STATE
- City
- — inherits STATE
ZIP-level market 63033
- Home prices YoY
- 2.5%
- Rents YoY
- 7.5%
- Active inventory
- 218
- Price-to-rent
- 7.7×
Monthly cashflow live
- Estimated rent
- $1,850 high interval (Pro) →
- Mortgage (P&I)
- −$891
- Tax from tax record
- −$207 /mo · $2,485/yr
- Insurance
- −$71
- HOA
- −$0
- Vacancy / Maint / Mgmt
- −$388
- Net cashflow
- $292
Break-even live
Sensitivity live
| Price | -10% $388 | -5% $340 | +0% $292 | +5% $244 | +10% $196 |
|---|---|---|---|---|---|
| Rent | -10% $146 | -5% $219 | +0% $292 | +5% $365 | +10% $438 |
| Rate | -1.0pp $378 | -0.5pp $335 | base $292 | +0.5pp $248 | +1.0pp $203 |
UW: 25.0% down · 7.5% · 30yr · 1.5% tax · 5.0% vac · 8.0% maint · 8.0% mgmt
Financing live
Cash to close
- Down payment
- $42,475
- Closing costs
- $5,097
- Reserves months
- —
- Total cash needed
- —
Loan-product check · same deal, 3 products live
Conventional
25% down · 7.5% · 30yr
- Down + closing
- —
- Monthly P&I
- —
- Monthly cashflow
- —
- DSCR
- —
- Eligible?
- —
Personal DTI + credit; lowest rate.
DSCR
20% down · 8.5% · 30yr
- Down + closing
- —
- Monthly P&I
- —
- Monthly cashflow
- —
- DSCR
- —
- Eligible?
- —
No personal income docs; deal must DSCR.
Hard money
10% down · 12.0% · 12mo
- Down + closing
- —
- Monthly P&I
- —
- Monthly cashflow
- —
- DSCR
- —
- Eligible?
- —
Short-term bridge; refi at stabilization.
Rent comps 13 comps
| Address | Beds | Baths | Sqft | Rent | $/sqft | DOM | Units | Dist |
|---|---|---|---|---|---|---|---|---|
| 3 Cantabrian Ct Florissant, MO | 3.0 | 2.0 | 1436 | $1,881 | $1.31 | 15d | 1 | 0.63mi |
| 2075 Cordoba Dr Florissant, MO | 3.0 | 2.0 | 1523 | $1,850 | $1.21 | 15d | 1 | 0.66mi |
| 1600 Horseshoe Dr Florissant, MO | 3.0 | 2.0 | 1314 | $1,550 | $1.18 | 44d | 1 | 0.75mi |
| 4440 Parker Rd Black Jack, MO | 3.0 | 2.0 | 1900 | $1,711 | $0.90 | 2d | 1 | 0.85mi |
| 4583 Whisper Lake Dr Black Jack, MO | 1.0–5.0 | 1.0–2.5 | 1225 | $1,156 | $0.94 | 2d | 17 | 0.88mi |
| 3930 Belcroft Dr Florissant, MO | 3.0 | 3.0 | 1408 | $1,935 | $1.37 | 44d | 1 | 0.95mi |
| 1785 Trotter Way Florissant, MO | 3.0 | 2.0 | 1297 | $1,806 | $1.39 | 8d | 1 | 0.96mi |
| 945 Paddock Dr Florissant, MO | 4.0 | 2.0 | 1875 | $1,850 | $0.99 | 5d | 1 | 1.15mi |
| 4872 Bristol Rock Rd Black Jack, MO | 4.0 | 2.0 | 1448 | $2,061 | $1.42 | 2d | 1 | 1.31mi |
| 560 Jamaica Pl Florissant, MO | 3.0 | 2.0 | 1350 | $1,653 | $1.22 | 44d | 1 | 1.32mi |
| 12 Country Ln Florissant, MO | 3.0 | 2.0 | 1881 | $2,250 | $1.20 | 44d | 1 | 1.32mi |
| 410 Ridge Dr Florissant, MO | 3.0 | 2.0 | 1226 | $1,650 | $1.35 | 18d | 1 | 1.44mi |
| 11635 Hazeloak Dr Black Jack, MO | 3.0 | 2.0 | 1124 | $1,728 | $1.54 | 18d | 1 | 1.45mi |
Listing history 15 events
-
2026-06-10status $169,900 Pending 50 DOM
-
2026-06-09days on market $169,900 Active 50 DOM
-
2026-06-08days on market $169,900 Active 49 DOM
-
2026-06-07days on market $169,900 Active 48 DOM
-
2026-06-05days on market $169,900 Active 45 DOM
-
2026-06-03days on market $169,900 Active 44 DOM
-
2026-06-02status $169,900 Active 43 DOM
-
2026-05-14price $169,900 686-char remark
Show marketing remark (686 chars)
This 3-bedroom, 2.5-bath home has over 2,500 square feet of living space including an addition living room and 2-“sleeping rooms” with a bathroom in the finished basement. The main level has a beautiful spacious living room and an eat-in kitchen. Plus there is a room addition on the back of the home offering even more space. The outside a patio overlooks the spacious backyard with mature tree. The backyard also back to open space behind the home offering great privacy. This home has 2-car garage, that you can actually get two cars in. Plus there is additional room for other yard equipment or storage. Schedule your showing TODAY! It won't last long at this price....!
-
2026-04-09$175,000 Active 686-char remark
Show marketing remark (686 chars)
This 3-bedroom, 2.5-bath home has over 2,500 square feet of living space including an addition living room and 2-“sleeping rooms” with a bathroom in the finished basement. The main level has a beautiful spacious living room and an eat-in kitchen. Plus there is a room addition on the back of the home offering even more space. The outside a patio overlooks the spacious backyard with mature tree. The backyard also back to open space behind the home offering great privacy. This home has 2-car garage, that you can actually get two cars in. Plus there is additional room for other yard equipment or storage. Schedule your showing TODAY! It won't last long at this price....!
-
2014-04-07soldstatus $89,000
-
2014-03-28soldstatus 925-char remark
Show marketing remark (925 chars)
Bring your family home! This cute brick ranch has it all! The freshly painted main level has a beautiful spacious Living Room and an eat-in Kitchen, 3 large Bedrooms with big closets, plus Dining and Family Rooms. The lower level has more for your family: Media/Rec Room, a Play Room for the kiddies and two additional rooms for office, play areas, or whatever you like! Add to all this, another full bath with custom vanity! Outside a patio overlooks the spacious, landscaped lot. Oversized 2 car garage with work area. This home offers many unique and desirable features: custom vanities, custom front door, crown molding and other trimwork. You'll be proud to call this one "Home"! Home has more spuare footage than shows on county records. New furnace was installed in November 2013 and a new kitchen range was installed in Aug, 2013, Seller is motivated and ready for an offer. Additional Rooms: Sun Room
-
2013-04-11$94,900 925-char remark
Show marketing remark (925 chars)
Bring your family home! This cute brick ranch has it all! The freshly painted main level has a beautiful spacious Living Room and an eat-in Kitchen, 3 large Bedrooms with big closets, plus Dining and Family Rooms. The lower level has more for your family: Media/Rec Room, a Play Room for the kiddies and two additional rooms for office, play areas, or whatever you like! Add to all this, another full bath with custom vanity! Outside a patio overlooks the spacious, landscaped lot. Oversized 2 car garage with work area. This home offers many unique and desirable features: custom vanities, custom front door, crown molding and other trimwork. You'll be proud to call this one "Home"! Home has more spuare footage than shows on county records. New furnace was installed in November 2013 and a new kitchen range was installed in Aug, 2013, Seller is motivated and ready for an offer. Additional Rooms: Sun Room
-
1996-05-10soldstatus $77,500
-
1995-06-21soldstatus $80,000
-
1993-04-13soldstatus $80,000
ⓘ Source: listings_history table (triggers on properties + properties_extension) + one-shot
backfill from property_details.listing_events for pre-trigger history.
Tax reassessment forecast MO · Resets to sale price
- Current annual tax
- $2,485 · $207/mo
- Projected year-2 tax
- $2,485 · $207/mo
- Expected delta
- $0/yr ($0/mo · 0.0%)
ⓘ Screening estimate from a state-policy table — verify with the county assessor before closing.
Climate risk First Street
- Flood 4/10 Moderate FEMA zone X (unshaded) · 22% chance over 30 yrs
- Wildfire 1/10 Low
- Heat 5/10 Major 7 d/yr ≥106°F today · 21 d/yr by 30 yrs out
- Wind 2/10 Low 100% chance of damaging wind over 30 yrs
- Air quality 3/10 Moderate 3 unhealthy d/yr today · 5 by 30 yrs out
Nearby sold comps map
Loading sold comps map…
Walkable amenities ~0.75 mi
Loading nearby amenities…
Taxation est. · year 1
- Rental income
- $22,194
- − Mortgage interest
- −$9,517
- − Property taxes
- −$2,485
- − Insurance
- −$850
- − Repairs & maintenance
- −$1,776
- − Management
- −$1,776
- − Depreciation
- −$4,943
- Taxable income
- $849
- Est. tax owed @ 24.0%
- −$204
- After-tax cash flow
- $3,303/yr
For passive investors: Depreciation is non-cash, so a rental often shows a tax loss while cash-flowing — sheltering income. Rental losses are passive: they offset passive income freely, and up to $25,000/yr can offset ordinary (W-2) income if you actively participate and your MAGI is under $100k (phasing out to $0 by $150k); unused losses carry forward. On sale, claimed depreciation is recaptured at up to 25%, and gains may owe capital-gains tax (a 1031 exchange can defer both). Figures are a year-1 estimate at your 24.0% rate — not tax advice; consult a CPA.
Schools (NCES district)
- District
- Ferguson-Florissant R-II
- NCES district ID
- 2912010
- Math proficiency
- 7% ▼ -9.00%
- Reading proficiency
- 20% ▼ -6.00%
- Median HH income
- $44,610
- Composite
- 11.96/100
- National rank
- #9666
- State rank
- #311 of 324 in MO
Livability — Florissant
- Score
- 73/100
- State rank
- #82
- US rank
- #5406
Category grades
Schools grade is shown separately in the Schools card above.
Census & demographics
- County
- Saint Louis County · 888,823 people
- City population
- 69,104
- Metro
- St. Louis, MO-IL
- Population (ZIP)
- 43,056
- Household income
- $66,776
- Rent vs Own
- Severe rent burden
- 1429.0
Population outlook (St. Louis County) Hauer SSP2
- Today (2025)
- 1,025,227 people
- By 2030
- 1,028,023 · +0.3%
- By 2040
- 1,020,940 · -0.4%
- By 2050
- 1,007,280 · -1.8%
- By 2075
- 987,277 · -3.7%
- By 2100
- 921,984 · -10.1%
Race, ethnicity, and origin ACS 2023
- Neighborhood character
- Predominantly Black (71%)
- Race & ethnicity
- Black 71% White 23% Two or more races 4% Hispanic / Latino 1%
- Common ancestry
- Romanian 1% Lithuanian 1% Italian 1%
- Foreign-born
- 3% · Canada, Vietnam
- Languages at home
- 95% English-only · Spanish 1% French/Haitian/Cajun 1%
Political lean MEDSL · St. Louis
- 2024 margin
- Strong D (+23.4) · D 60.8% · R 37.4% · Other 1.7%
- 2008→2024 swing
- +3.5pp toward D · 2008: 19.9pp · 2024: 23.4pp
- All cycles
- 2024: D+23.4 2020: D+24.0 2016: D+16.2 2012: D+13.7 2008: D+19.9
Not yet ingested
- Civics
- —
Market trends
- HPI YoY
- ▲ 13.78%
- Current HPI
- 570.6
- Rent YoY
- ▲ 7.51%
- Metro
- St. Louis, MO-IL
- State GDP YoY
- ▲ 1.84%
- F500 in state
- 20
Industry mix (Fortune 500 HQ in MO)
| Industry | F500 HQs | Revenue |
|---|---|---|
| Healthcare | 1 | $163B |
|
||
| Insurance | 1 | $21B |
|
||
| Industrial Technology | 1 | $17B |
|
||
| Retail | 1 | $16B |
|
||
| Industrial Distribution | 1 | $10B |
|
||
| Utilities | 1 | $9B |
|
||
Price history
+112.4% since first listed8 events — show timeline
- 2026-05-14 Price Changed $169,900 MARIS as Distributed by MLS Grid
- 2026-04-09 Listed $175,000 MARIS as Distributed by MLS Grid
- 2014-04-07 Sold (Public Records) $89,000 Public Records
- 2014-03-28 Sold (MLS) — MARIS as Distributed by MLS Grid
- 2013-04-11 Listed $94,900 MARIS as Distributed by MLS Grid
- 1996-05-10 Sold (Public Records) $77,500 Public Records
- 1995-06-21 Sold (Public Records) $80,000 Public Records
- 1993-04-13 Sold (Public Records) $80,000 Public Records
Property tax history
+3.1%/yrLatest (2022): $2,485 · +5.1% YoY. Source: county tax records.
Cash-flow waterfall
monthlySold comps — $/sqft
last 12 mo · ≤1 miLoading sold comps…